The Effect of Financial
Development on Income
Inequality in
Africa
Looking for a Needle in a Haystack?
Master’s thesis within Economics
Author: Milcent Chimboza
Master’s Thesis in Economics
Title: The effect of financial development on income inequality in Africa: Looking for a needle in a haystack?
Author: Milcent Chimboza
Tutor: Scott Hacker
Mikaela Backman
Date: 2014-01-27
Subject terms: Financial development, income inequality, Africa, Greenwood- Jovanovic hypothesis, Gini coefficient
Abstract
This paper investigates the effect of financial development on income inequality in 20 African countries. Theory and a growing number of empirical studies sug-gest that the former exerts a negative impact on the latter by enabling low-income holders to undertake income-enhancing education and business investments, thereby promoting a tighter income distribution. However, using the share of GDP constituted by domestic credit to the private sector and broad money respectively as proxies for financial development, the results of this study fail to give signifi-cant evidence of this income-equalising effect. Given the heterogeneous nature of the economies studied here and the fact that data quality and quantity improve over time, it is believed that country-specific studies and future research can offer more conclusive results on how financial development influences income distribu-tion in the African context. This would also provide a stronger foundadistribu-tion for pol-icy recommendations in the continent’s plight to address the persistent high levels of income inequality.
Acknowledgement
I am indebted to my tutors, Scott Hacker and Mikaela Backman for their patient and insightful guidance during the entire course of this study. Your efforts are greatly appreciated!
In addition, I would like to extend a tremendous thanks to my family and friends who are near and far for the constant support and encouragement. Thank you es-pecially to: my Queen, for her never-ending love and generosity; to Lily, for al-lowing me to be the definition of an inconvenience; and to my Chipego, for truly being one.
Finally and most importantly, thank You Jesus for never failing me, even when I have You. Your grace and faithfulness continue to astound me.
Table of Contents
1
Introduction ... 1
2
Literature Overview ... 3
2.1 The theory on finance and inequality ... 3
2.2 Financial Development and Inequality: The African Story ... 5
2.3 The empirical findings on finance and inequality ... 9
3
Data and Estimation Methodology ... 12
3.1 Data and Model ... 12
3.2 Estimation Technique ... 14
4
Estimation Results and Discussion ... 15
4.1 Summary statistics ... 15 4.2 Regression Results ... 16 4.3 Additional tests ... 17 4.4 Discussion ... 18
5
Conclusion ... 20
List of references ... 22
6
Appendix ... 25
6.1 Descriptive statistics of the Gini by country (1990-2005) ... 25
6.2 Scatter plot matrix of variables ... 26
6.3 Partial correlations for domestic credit and broad money ... 26
6.4 Heteroskedasticity and multicollinearity tests ... 27
6.4.1 Model with domestic credit (DC) ... 27
6.4.2 Model with broad money (M2) ... 27
6.5 Estimations based on the inverted U-curve hypothesis ... 28
1
Introduction
The relationship between financial development and economic growth has been a sub-ject of interest to economists for over a century. Since the pioneering thoughts of Schumpeter (1911) who highlights the role of finance in enabling entrepreneurs to em-ploy credit for productive activities, a great deal of research has been undertaken to as-certain the degree to and the channels through which financial development contributes to economic growth (for instance Goldsmith, 1969; McKinnon, 1973; Shaw, 1973; and Levine, 1997). These works suggests that a well-functioning and properly regulated fi-nancial sector induces growth by promoting and mobilising saving and investment, both in quantity and quality, which in turn enhances economic performance. This view is usually termed as the supply-leading response.
Alternatively, the demand-following school of thought argues that is it rather economic development that spurs financial development as growth leads to the demand for specif-ic financial servspecif-ices (Robinson, 1952). Reconciling these two views is the suggestion of a bi-directional relationship between the two macroeconomic variables. However the conspicuous absence of the role of finance in the famous review of development eco-nomics by Stern (1989) gives support to Lucas’ (1988) warnings against the overem-phasis of the role of financial development on economic development outcomes. Al-though these contributions create a highly nuanced finance-growth discussion, the suppy-leading response is currently on the forefront. This is highlighted by the recent global interest in creating a more inclusive financial sector as a means of addressing poverty and income inequality.
Such an effort is illustrated by the emphasis laid on financial inclusion as a major objec-tive on the global development agenda by the G20 since 2010. In addition, there are at-tempts to facilitate collection and provision of more accurate data on financial develop-ment (as the traditional ones have sometimes been criticised of only capturing the size and not necessarily revealing the efficiency of the financial sector). This is also evi-denced by the recent establishment of the World Bank’s Global Financial Inclusion In-dex (Global FinIn-dex).
Academically, the growing research in this area is mainly based on the theoretical foun-dations of financial sector development and income inequality relating in either an in-verted U-shaped manner as suggested by Greenwood and Jovanovic (1990), or a nega-tive linear relationship as contrasted by Barnejee and Newman (1993), and Galor and Zeira (1993). Regardless of the perspective taken, the general idea lies in the expected ability of more developed financial sectors to offer a wider variety of services to a broader range of segments on the income distribution. This allows even the poorer seg-ments (who would otherwise not afford to make use of financial services in the case of undeveloped financial sectors) of the population to obtain credit so they can undertake education and business investments. These productivity-enhancing activities then work to create a more equal distribution of income, a result that several cross-country studies such as Beck et al. (2007), Kappel (2010) and Jeanneney and Kpodar (2011) attest to. In light of this optimism regarding the impact of financial development on income ine-quality, this paper seeks to assess the demand-leading response in the African context. Although it is the second most unequal region after Latin America, very few studies have assessed the role of financial sector development on equalising the continent’s
in-In a study on South Africa, Odhiambo (2009) investigates the impact posed on poverty by financial sector reforms and economic growth respectively. Although both variables have a poverty-alleviating effect, financial development shows a weaker influence in comparison to economic growth. Looking at the experience of a larger set of countries (29 Sub-Saharan countries for the period 1980-2002), Kai and Hamori (2009) estimate a panel model to assess how globalisation and financial depth as measured by the ratio of broad money to gross domestic production (GDP) affect income inequality. Their study finds that financial development has a significant income-equalising effect. In contrast, estimations by Fowowe and Abidoye (2013) on data from 27 countries covering the pe-riod 1981-2005 show that indicators of financial development constituted by both the share of GDP constituted by broad money and domestic credit to the private sector re-spectively are negatively associated with income inequality but lack statistical signifi-cance. In this case, income inequality is measured by the Gini coefficient obtained from calculations by the World Bank’s povcal, a tool designed to accurately calculate poverty and inequality measures.
These contradicting results could be a reflection of the different indicators and samples used, and also highlight the limitations associated with proxies for the variables of in-terest. In order to add to the scant research and assess what further insights can be gained for the African context, this study attempts to unveil the interaction between the variables using a cross-section approach on a sample of 20 African countries, based on data averaged for the period 1990-2005. Both domestic credit and broad money are used to represent financial depth. The former is the most common measure and is argued to capture the ease with which one can obtain credit that can be used for economically productive activities, while the latter is argued to be more appropriate in the context of developing countries as large shares of the population there rely more on deposits than credit to undertake investments (Jeanneney and Kpodar, 2011). To account for inequal-ity, an alternative measure of the Gini index, obtained from Solt’s Standardised World Income Inequality Database (SWIID) v.4.0 is used. This index is employed due to the fact that it standardises data from various inequality indices, making it more comparable across countries and time.
Similar to Fowowe and Abidoyeo (2013) the results of this study deviate from Kai and Hamori (2009) and from the theoretical predictions as both measures of financial devel-opment used are found to be statistically insignificant in decreasing income inequality. This suggests that the main sources of a more equal distribution of income in Africa might lie outside the financial sector development. However given the wide disparities of the African countries under examination, the application of a cross-sectional estima-tion might mask more than it reveals. Individual case studies and regional analyses could therefore provide a better way of gaining more conclusive results as remarked in the conclusion.
The rest of the paper is organised as follows: section 2 gives a more detailed picture of the finance-inequality nexus by offering the theoretical and empirical background on this relationship, as well as the African experience. In section 3 the data and methodol-ogy are discussed, the results of which are presented and analysed in section 4. Lastly, section 5 gives concluding remarks and suggestions for further research.
2
Literature Overview
2.1
The theory on finance and inequality
The traditional approach to financial development and economic growth was originally presented by the likes of Bagehot (1873) and (1911) who argue that the existence of fi-nancial intermediaries facilitates the creation of assets and aids economic agents in mak-ing portfolio decisions. Goldsmith (1969) identifies increased efficiency in investment as the key channel through which the financial sector enhances growth, whereas McKinnon (1973) and Shaw (1973) hold that financial liberalisation enhances savings and thereby investment, as the South East Asian countries showed in the 1990s. Conse-quently, the McKinnon-Shaw hypothesis suggests that it lies in the interest of policy makers to design policies that enhance incentives to save. As savings increase, interest rate declines, which increases investments. Thus, the pioneering work suggests that fi-nancial development promotes capital formation both in quality and quantity, which in turn induces growth.
With this supply-leading response as a point of departure, the argument for financial development as a factor enhancing equal distribution of income lies on the premise that when the financial sector develops, it caters to a larger share of the population, which not only benefits aggregate economic growth outcomes, but also individual welfare. An underdeveloped financial sector is characterised by high information asymmetry and transaction costs that exclude lower socioeconomic strata that often lack credit history and collateral from accessing financial services (Banerjee and Newman, 1993; Galor and Zeira, 1993; Rajan and Zingales, 2003). Thus, increasing access to financial instru-ments, services and institutions enhances opportunities for the poor to undertake in-vestments in education and enterprise, which potentially reduces inequality. This is what literature identifies as the direct channel through which financial development re-duces income inequality.
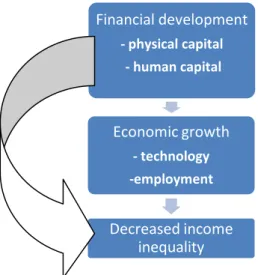
In addition, improvements in the financial sector pose an indirect impact on inequality as welfare gains from overall economic growth induce firms and entrepreneurs to em-ploy better technology in production and create better emem-ployment opportunities for the less fortunate (Claessens and Perotti, 2007; Kappel, 2010; Jeanneney and Kpodar, 2011). However, this presents an issue of reverse-causality as economic growth in turn also promotes financial development according to the demand-following hypothesis (Robinson, 1952). Figure 2.1 summarises the interaction channels through which finan-cial development impacts income inequality.
With this background, there are two main views on how the financial development-income inequality nexus plays out over time.The first perspective is based on Kuznets’ (1955) assertion of an inverted U-shaped association between income inequality and economic development. Pre-industrialisation, incomes in rural areas are equal but lower than in urban areas. However as the rate of urbanisation increases, income disparities increase but new generations born to the rural poor can exploit opportunities in urban areas. Gradually, income in lower-income groups increase, which in turn narrows the overall inequality.
Figure 2.1. A summary of the direct and indirect channels between financial development and income inequality following the supply-leading hypothesis.
Source: Author’s own
Adapted to the financial development-inequality context, an economy with two produc-tion technologies, one characterised by low risk and constant but low returns and the other riskier with higher returns, Greenwood and Jovanovic (1990) describe how finan-cial sector development and income inequality evolve on an inverted U-shaped path. Initially, when financial intermediaries are less developed, growth is slow, reflected by a positive relationship between financial development and income inequality. During the transition to the intermediate stage characterised by a deepening of the financial sec-tor, both income inequality and income levels increase. The inverted U-shape reflects the existence of a fixed cost to participate in the financial sector, which restricts those agents who cannot afford it from using financial services. The source of growth lies in the financial intermediary development which helps to lessen the impact of information frictions on risky investment. This is achieved by collecting and analysing information on investment projects, smoothing away idiosyncratic shock through risk diversifica-tion, trading and pooling. Increased income levels enable a wider base of individuals to exploit the services offered by financial intermediaries in their investment activities. Thus, an increasing number of agents gain access to financial intermediation and in-vestment opportunities (through both banks and equity markets) with increased income, which results in a more equal distribution of income in the end. This is when the finan-cial structure is mature.
However, this school of thought has been challenged by a second strand of literature which suggests a negative linear association between financial development and income equality instead. Banerjee and Newman (1993) suggest that individuals choose occupa-tions from the four categories of: subsistence, employment, self-employment and entre-preneurship. One of the factors determining the choice is the initial distribution of wealth, which is often based on bequest. Self-employment and entrepreneurship, which are associated with high returns, require external capital, which is lent on the basis of monetary collateral, which only those bequeathed with it can provide. Thus, the poor cannot overcome the collateral hurdle to become self-employed or entrepreneurs, and the rich become richer. However, generational transitions are possible since the fluctuat-ing nature of returns may make those in these two categories either relatively richer or
Financial development - physical capital - human capital Economic growth - technology -employment Decreased income inequality
poorer. These changes in wages create an avenue through which the children of the em-ployed can overcome the collateral barrier to become self-emem-ployed. This model high-lights how financial development works to reduce income inequality by employing techniques that monitor and decrease the collateral constraints and allow more individu-als, regardless of their initial wealth, to acquire capital and become self-employed and entrepreneurs. Thus, efficient financial sectors can decrease income inequality that is based on the unequal distribution of wealth by facilitating finance for enterprise, as also argued byAghion and Bolton (1997).
While Banerjee and Newman (1993) focus on the four categories of occupation, the Ga-lor and Zeira (1993) framework proposes that whether one becomes a skilled or an un-skilled worker is contingent on the degree of human capital one possesses, which is de-pendent on their income. Higher investments in human capital are associated with higher returns on employment, but the only way to attain to a high level of human capi-tal is to be endowed with the means to acquire it. In the absence of wealth, individuals can borrow to invest in their human capital. However, this requires the development of financial markets that results in facilitated borrowing so that more people undertake human capital enhancing investments. In the absence of financial development, the economy will converge to two steady-states in the long run, with the rich and skilled in a high-income steady state and the poor-unskilled in a low-income one. Thus financial sector development can help to create an environment characterised by a more equal in-come distribution and increased economic performance by facilitating investments in human capital.
2.2
Financial Development and Inequality: The African Story
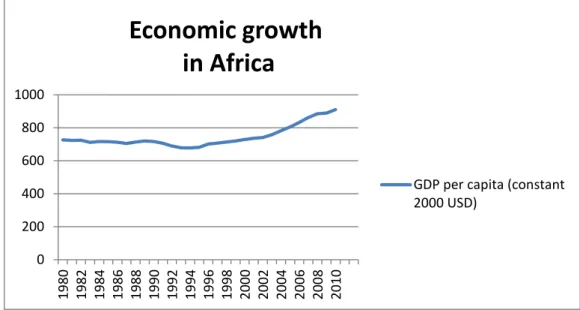
According to the World Bank’s Africa Development Indicators (ADI, 2012), the Afri-can continent is home to roughly a third of the world’s poor, with 47.5% of the popula-tion living on $1.25 daily. Although incomes have been steadily increasing as depicted in Figure 2.2, the highest poverty rate in the world is ascribed to the continent.Figure 2.2 The trend of GDP per capita over time
Data Source: World Bank African Development Indicators (ADI, 2012) 0 200 400 600 800 1000 1980 1982 1984 1986 1988 1990 1992 1994 1996 1998 2000 2002 2004 2006 2008 2010
Economic growth
in Africa
GDP per capita (constant 2000 USD)
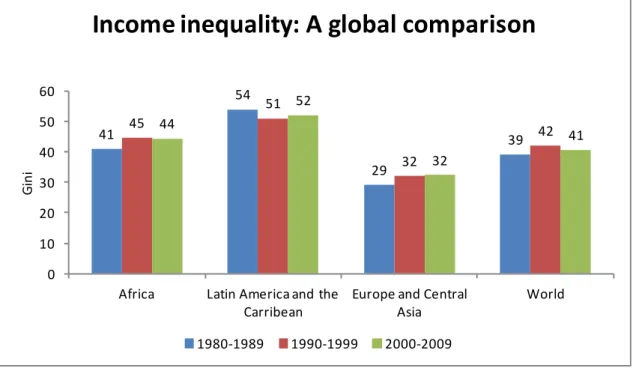
In addition Africa also suffers from high and persistent income inequality, highlighting that although growth is on the rise, it is far from inclusive. This can be seen in Figure 2.3, where the continent’s Gini indices for the three decades between 1990 and 2009 range from 41 to 45. The Gini index is a measure of the degree to which income distri-bution among individuals or households in an economy deviates from a perfectly equal distribution. This is based on a plot of the cumulative percentages of total income against the cumulative number of recepients starting from the poorest to the wealthiest, known as the Lorenz curve. The Gini is then the ratio of the area between the Lorenz curve and a hypothetical 45 degree line of absolute equality to the area made up of this line and the axes. An index of 0 represents perfect equality while perfect inequality is represented by an index of 100 (World Bank Development Indicators, 2012).
It is also evident from Figure 2.3 that the Gini is a slow moving variable exhibiting mi-nor changes over time in all the regions. In addition, Europe and Central Asia show the lowest Gini indices, meaning that this region is where income is most equally distrib-uted compared to the other regions. In fact, the region even has Gini indices that are lower than the global values. However, with Gini indices ranging between 41 and 54, the opposite is true for Latin America and the Caribbean and Africa.
41 54 29 39 45 51 32 42 44 52 32 41 0 10 20 30 40 50 60
Africa Latin America and the
Carribean
Europe and Central Asia
World
G
in
i
Income inequality: A global comparison
1980-1989 1990-1999 2000-2009
Figure 2.3 The Gini coefficient for the different regions over time Data Source: World Bank, World Development Indicators, 2012
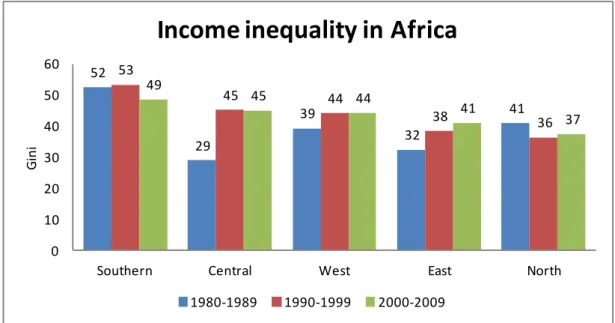
Since this broad picture does not reveal the different experiences of the heterogeneous economies included in the regions, a further assessment of the African case is done in Figure 2.4 to investigate income disparities at a subregional level. It becomes clear that Southern Africa is the region that contributes the most to the high levels of income ine-quality, with Gini indices ranging from 49 to 52. Furthermore Central, West and East Africa have had a clearly increasing uneven distribution of income whereas Southern and North Africa (the most equitable area) have experienced fluctuations resulting in lower Ginis for the decade 2000-2009 compared to 1980-1989.
52 29 39 32 41 53 45 44 38 36 49 45 44 41 37 0 10 20 30 40 50 60
Southern Central West East North
G
in
i
Income inequality in Africa
1980-1989 1990-1999 2000-2009
Figure 2.4 The Gini coefficient for the different African regions over time Data Source: World Bank, World Development Indicators, 2012
In regards to financial development, both banks and equity markets are vital compo-nents of the financial sector. According to Beck and Maimbo (2013), the continent’s fi-nancial landscape is dominated by the banking sector with a capital market in its in-fancy, thus characterised by lack of depth and liquidity. However the number of coun-tries with a stock exchange has increased from five to seventeen since 1989. The most prominent and developed of these is South Africa’s Johannesburg Stock Exchange. In-terestingly, even with one of the continent’s most sophisticated financial market (Odhiambo, 2009) South Africa still exhibits one of the highest Gini coefficients on the continent (63.1 in 2009 according to ADI, 2012), indicating that financial development, captured by the aggregate size of the financial sector, does not always translate into fi-nancial breadth (increased reach) as argued by Claessens and Perotti (2007). Thus, de-spite the size of the financial sector and the proceeding enhancement of economic growth, if this growth only falls to a specific segment of firms and households, the end result is increased income disparities in the economy.
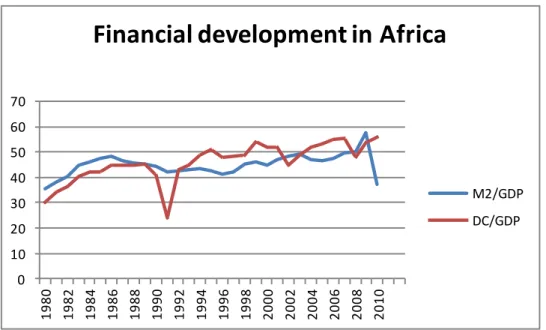
A look at the development of the African financial sector as represented by the ratios of domestic credit (DC) and broad money (M2) respectively to GDP in Figure 2.5 shows that both have fluctuated since 1980. In addition, the late 1980s and early 1990s saw a score of African countries experience systemic banking crises which have been attrib-uted to poor governance, poor banking practices, and an unstable macroeconomic envi-ronment among others (Beck and Maimbo, 2013). As a result, financial sector size as measured by the ratio of credit to GDP declined significantly in the early 1990s, as can be seen by the most conspicuous fluctuation in Figure 2.5. Since then, many of these countries have undertaken financial sector reform, particularly efforts to strengthen the judicial and legal institutions in hopes of broadening and improving the activities and reach of financial intermediaries. This highlights the importants of the institutional framework in the pursuit of healthy financial development as also suggested by La Porta et al. (1997), Levine, Loayza and Beck (2000) and Bittencourt (2010).
0 10 20 30 40 50 60 70 1980 1982 1984 1986 1988 1990 1992 1994 1996 1998 2000 2002 2004 2006 2008 2010
Financial development in Africa
M2/GDP DC/GDP
Figure 2.5 The trends of financial development in Africa since 1980 Data source: World Bank African Development Indicators (ADI), 2012
Table 2.1 puts the African financial sector development in a global context by compar-ing the lowest and highest values of both measures of financial development (measured as a percentage of the GDP) across different regions between 1980 and 2010. For Af-rica, domestic credit has ranged from 24.1% to 55.9% while broad money has taken values between 35.4% and 57.5%. Although these levels are on par with those of the Latin American and Caribbean region, they are substantially lower than the European and Central Asia and world counterparts indicating that there is room for growth in the financial development of most of the developing world.
Region Domestic Credit Broad Money
Lowest Highest Lowest Highest
Africa 24.1 55.9 35.4 57.5
Latin America and the
Carib-bean 23.7 29.0 23.6 64.0 Europe and Central Asia 65.0 126.0 73.3 141.6 World 72.0 129.5 64.3 125.7
Table 2.1 A comparison of the financial sector in different regions 1980-2005 Data source: World Bank, World Development Indicators, 2012
The challenge to make financial and economic gains accessible to a greater share of the African population has led to solutions outside the formal sector. One such is repre-sented by the use of technological innovations such as mobile telephone payment sys-tems, which is proving an important tool in reaching the poorest with financial services.
According to Demirgüc-Kunt and Klapper (2013) the M-Pesa system most popular in Kenya and Tanzania, is a leading example impacting households’ economic circum-stances by reducing costs and time lags of transfers. This service offered by the mobile service provider Safaricom has enabled millions of unbanked and under-banked indi-viduals to store and send money through their mobile phones since 2007. A more popu-lar service, M-Shwari, has been offered together with the Commercial Bank of Africa since 2008 enabling customers to save and obtain loans as well (Commercial Bank of Africa, 2013). The Zimbabwean equivalent, EcoCash delivered by Econet has also opened an avenue through which its customers can obtain debit MasterCards as a way of enhancing convenience in their financial inclusion objectives (Econet, 2013). South Africa’s WIZZIT has taken a step further by offering financial training for entrepreneurs (WIZZIT, 2012). Thus, in addition to offering financial services that are targeted at those normally excluded from the formal banking sector, the financial agent is also em-powering individuals with knowledge on how to start and run their owns businesses, further contributing to growth. Although promising, the future will tell how these solu-tions will contribute in increasing financial development and creating more equitable income distribution on the continent.
2.3
The empirical findings on finance and inequality
Given the existence of varied theoretical predictions on the finance-inequality interac-tions, it is not surprising that the studies that have investigated the empirical validity of these have also yielded different results and conclusions. The majority however seem to identify a linear negative relationship between financial development and income ine-quality, (as suggested by Galor and Zeira, 1993; Barnejee and Newman, 1993) as op-posed to the Greenwood-Jovanovic hypothesis of an inverted U-curve.
The seminal study by Beck et al. (2007) uncovered the income-equalising effect of fi-nancial development confirming the theoretical predictions of Barnejee and Newman (1993). Assessing the interaction of the variables for about 60 countries over different periods of time, the work provides strong evidence for increased efficiency in financial markets resulting in the economic empowerment of the poor, arguing that about 40% of the income increase of the poorest 20% could be attributed to a tighter distribution of income, with the corresponding value for aggregate economic growth being 60%. These results prove robust to different estimation techniques and control variables, drawing the attention of policy makers and researchers.
The latter have since then employed different samples and estimation methods to assert whether this in fact holds in different cases. An example is Clarke, Xu and Zou (2013) who use a panel of 91 developed and developing countries with the period 1960-95 to assess the relationship between various proxies of financial sector development and in-come inequality as measured by the level of the Gini coefficient. Their results conclude that there is a negative linear relationship between the two, dismissing the U-shape curve. Moreover, the study also highlights that the strength of the interaction between the two macroeconomic variables is contingent on the sectoral structure of the economy. All else equal, countries with bigger modern sectors experience smaller declines in the Gini coefficient on average.
and endogenous effects at play. By adopting a multivariate panel data approach for a panel including both developed and developing countries for the period 1962-2006, he finds robust evidence for the inverted U-curve suggested by Greenwood and Jovanovic (1990), based on the discussed two measures of financial sector development.
Although these studies give the general picture of financial development and income inequality, they overlook the fact that the heterogeneity in conditions such as institu-tions, political regimes and economic systems in the developed and developing world may induce different results for respective region. In an attempt to take this into consid-eration, Kappel (2010) examines the financial development-income inequality interac-tions by estimating the relainterac-tionship for low-income countries separate from the one for high income countries based on cross-country and panel data estimations based on 78 developing and developed economies for the period 1960-2006. The results show that financial deepening reduces income disparities as well as poverty, but that this effect is weaker for developing countries than for high-income countries. In addition, govern-ment spending is significantly associated with tighter income distribution only in high income countries while ethnic diversity enforces income inequality. This is attributed to the fact that the prevalence of different ethnic groups makes public goods provision dif-ficult, as there are many ethnic groups to take into consideration. Taking into account that financial development may be endogenous; the study employs legal origin and the absolute value of the latitude of each country as instruments in a Two Stage Least Squares (2SLS) analysis, which confirms the overall findings.
Exclusive to developing countries, Jeanneney and Kpodar (2011) employ the system generalised method of moments (GMM) estimator to address heterogeneity and en-dogeneity issues in their discussion on financial development and inequality based on a sample of developing countries for the period 1966 to 2000. In addition to following the traditional approach of using the ratio of private sector credit over GDP as a proxy for financial development, they also use indicators of liquidity (M3/GDP; currency plus demand and interest-bearing liabilities of banks and non-banks)to see which of the two, increased credit or money holdings, shows the greater effect of improved financial in-termediation on the poor. Their results confirm the McKinnon conduit effect that pre-dicts that even though financial intermediaries in developing countries may not be so developed that they cater to credit needs, they can still provide financial services in transactions and saving, providing money balances with which the poor self-finance their investment projects. Thus they conclude this is the channel through which finan-cial sector development benefits the poor in the developing world.
With regard to country-specific cases, Shahbaz and Islam (2011) employ the autoregres-sive distributed lag approach (ARDL) and error correction method (ECM) to assess the long-run and short-run interactions between financial development and income inequal-ity respectively in Pakistan in the period 1971-2005. Their results yield no support for the Greenwood-Jovanovic hypothesis, but clearly highlight the income-equality enhanc-ing effect (which is shown to be stronger over time than in short periods) of financial development as well as the detrimental effect of financial instability. Following the same econometric approach, the Chinese (for the period 1978-2006) and Indian cases (1951-2004) as examined by Jalil and Feridun (2011) and Ang (2010) respectively offer similar results and reject the Greenwood-Jovanovic hypothesis. Similarly, Brazil pro-vides evidence of financial development contributing to a more equal income distribu-tion in the period 1985-1994 as investigated by Bittencourt (2010). The results are
based on both a time-series and a panel estimation and point to the ability of increased access to credit to facilitate the poor’s engagement in more productive activities, as well as insulate themselves even in the presence of macroeconomic shocks, such as the high inflationary episodes in Brazil during the study period. These examples provide insight based on developing countries (albeit rapidly-growing) that have been characterised by a high degree of income inequality as well as undergone various market and financial reforms, making them more relatable to the African context.
From an African perspective, Odhiambo (2009) examines the finance-growth-poverty nexus in the continent’s most developed economy but also one of the most unequal in terms of income distribution, South Africa. The author concludes that the highly sophis-ticated and developed financial sector in the country has a significant poverty-alleviating effect both in the long and short run. In a panel setting of 29 African coun-tries for the period 1980-2002, Kai and Hamori (2009) investigate how globalisation and financial depth as measured by the two common indicators relate to income quality. With income inequality represented by the estimated household income ine-quality (EHII), their results find that financial development has a significant income-equalising effect. In addition, trade openness is found to have an inequality-enforcing effect, reflecting the increased demand for skilled labour (which fosters wage differ-ences) that accompanies the shift to more sophisticated economic activities that interna-tionalisation brings about.
In contrast, a study by Fofowe and Abidaye (2013) of the finance-inequality nexus in the African context represented by 27 countries for the period 1981-2005 seems to im-ply that both indicators of financial development are insignificant, although they bear the expected sign, in explaining growth in the Gini coefficient. The Gini coefficient used in the investigation is obtained from World Bank’s povcal, a tool designed to accu-rately calculate poverty and inequality measures.
Against these inconclusive empirical findings, the next section attempts to model a specification to investigate what the sample at hand reveals on nature of the relationship between financial development and income inequality.
3
Data and Estimation Methodology
3.1
Data and Model
Based on the theoretical and empirical exposition offered in the previous section, this study investigates the relationship between financial development and income inequal-ity based on observations from a sample of 20 African countries1 for the period 1990-2005. The countries in the sample are chosen on the basis of data availability, while the period is selected to capture the period after which most countries in the sample had im-plemented financial liberalisation policies (expected to enhance financial development and ultimately economic performance).
The World Bank’s African Development Indicators (ADI, 2012) provides data for fi-nancial development indicators and control variables, while the data on the variable ac-counting for ethno-linguistic fractionalisation is obtained from Alesina et al. (2003), on an index ranging from 0 to 1 where the more fragmented societies have values closer to one. Gini index data is obtained from Solt’s (2013) Standardised World Income Ine-quality Database (SWIID) v.4.0. This index is employed due to the fact that it standard-ises data from various inequality indices including the UNU-WIDER World Income Inequality Database (WIID) and the World Bank’s PovcalNet. Although these two are often the most common ones, the standardised nature of the SWIID makes it more com-parable across countries and time. In addition, it also provides the widest coverage for African countries.
Using data from these sources, the impact of financial development on income inequal-ity is captured by the following estimation:
(1)
where each of the variables are defined below.
The dependent variable, Gini captures inequality in broad terms, measuring to what ex-tent income dispersion in an economy deviates from a perfectly equal distribution. It is measured by the Gini coefficient which is based on the Lorenz curve as discussed in the previous section. A Gini coefficient of 0 represents perfect equality while 100 indicates perfect inequality. Thus, the higher the coefficient, the greater the level of income ine-quality.
In regards to the main explanatory variable, financial development, lnfindev is estimated using two alternative measures. Ideally the measures should capture the quality of fi-nancial intermediation rather than the size, but such measures are near-impossible to find. The first of the two measures used is lndc, the log of domestic private credit/GDP, which is the most common proxy for financial development, capturing the volume of fi-nancial resources obtained by the private sector (and public sector in some cases) via in-struments such as loans and non-equity securities as defined by the World Bank. As noted earlier, the African financial market, as in many other developing regions, is
1 Algeria, Botswana, Cameroon, Cape Verde, Egypt, Ethiopia, Ghana, Ivory Coast, Kenya, Lesotho,
dominated by banks as the stock market is largely underdeveloped. Thus the ratio of private credit to GDP serves as a sufficient indicator for direct financial access, since fi-nancial markets are less sophisticated in the region.
The second measure, lnm2, the log of M2/GDP, is used to capture the effect on inequal-ity of currency circulating outside banks, demand deposits, as well as domestic savings and foreign currency deposits excluding those of the central government. According to Jeanneney and Kpodar (2011), more liquid financial assets are a more appropriate measure for developing countries as large shares of the population rely more on deposits than credit to undertake investments.
As for control variables, infl captures the effect of inflation and thereby macroeconomic instability and is measured by growth rates in the GDP deflator. Based on Easterly and Fischer (2001), Jeanneney and Kpodar (2011) suggest that this variable is more likely to hurt the poorer segments of the society than the richer as the latter are more insulated from macroeconomic shocks given that they have better access to financial instruments. The coefficient for inflation is therefore expected to be positive.
ge denotes government spending/GDP which captures the size and macroeconomic poli-cies of the government and can either have a positive or negative effect on income ine-quality. In the presence of powerful rich households that can influence the government to put into place tax policies that benefit the rich at the expense of the poor, income dis-parities are furthered and the positive effect prevails. The opposite is true in the pres-ence of a mechanism that allocates tax revenues and transfers more towards low-income groups, thus achieving a tighter income distribution. As it has been observed that devel-oping countries often lack such a mechanism (Clarke, et al.; 2013 and Kappel; 2010), the coefficient for this variable is therefore expected to be positive.
elf represents the level of ethno-linguistic fractionalisation. Theory suggests that higher
levels of disparities in language and ethnicity are associated with greater inequality. This is particularly evident in conjunction with provision of public goods as taking into consideration the varied preferences of different ethnic and/or language groups often re-sults in difficulties in providing for example good public schools. This in turn perpetu-ates inequality, as argued by Kappel (2010). For the African context where populations are highly fragmented by ethnicity and language, this variable is thus expected to have a positive coefficient.
Taking into consideration that economic performance can affect income inequality,
lngdppc is also included. This variable represents the natural log of real GDP per capita
and according to Kuznets (1955), it can be either positive or negative depending on an economy’s stage of development. The positive effect is observed in the initial stages, as economic growth enforces income inequality as a result of wage differences between the agricultural and modern sectors. However as an economy matures, citizens in lower-income strata experience increased wages, resulting in a more equal distribution of in-come. Thus economic performance exerts a negative effect on income inequality in the latter stages of development. As most of the countries in the sample can be considered to be in the early stages of development, the coefficient estimate of lngdppc is expected to be positive.
3.2
Estimation Technique
In accordance with Beck et al. (2007) and Kappel (2010) an ordinary least squares (OLS) cross-section estimation based on data averaged over the entire sample period is deemed an appropriate way of modelling the nature of the relationship between finan-cial development and income inequality in the African context. The argument for using averaged data is that neither of these variables changes rapidly over time, and also that short-run fluctuations in the rest of the variables might produce misleading results. However dealing with interactions between financial development and income inequal-ity based on a sample of varied countries poses a number of econometric issues. First is the possibility of unobserved heterogeneity, given the fact that these economies under observation, although similar in some aspects, have different structures and characteris-tics. Secondly, the possible existence of reverse causality between financial develop-ment and economic performance has been observed in the finance-growth-inequality lit-erature, providing reason to expect a similar interaction in the current study.Thus since income inequality itself might influence financial development outcomes, we cannot guarantee that the regressor estimating financial development is uncorrelated with the error term. Together with errors of measurement in the data and variables that have been omitted from the model (especially in the case where we are dealing with heterogeneous countries), OLS estimates become biased and inconsistent if endogeneity is not consid-ered.
Unsurprisingly, it is becoming increasingly popular to employ the generalised methods of moments (GMM) in panels analysing the interactions between financial develop-ment, economic growth and inequality, as the method addresses issues of endogeneity and unobserved heterogeneity (see for instance Beck et al., 2007; Clarke et al., 2013; Nikoloski, 2013). However, given the small sample size in this study, other methods such as the special case of GMM represented by the two-stage least squares (2SLS) ad-justed to small samples is considered more appropriate and is therefore applied in addi-tion to the OLS estimaaddi-tion.
A second step of the estimations therefore introduces instrumental variables in a 2SLS estimation. These are variables that are correlated with the proxies for financial devel-opment but not with error term or inequality, to reflect the exogenous impact of finan-cial development on income inequality, i.e, the effect independent of the feedback influ-ence that inequality might exert on financial development. Following La Porta et al. (1999), a large number of researchers have employed legal origin as an instrument vari-able in this context. It is believed that British common law is more conducive to finan-cial deepening than French, German and Scandinavian civil law. Additionally, the abso-lute latitude of former colonies is also believed to have played a part in contributing to the nature of institutional framework present today. Countries with more favourable climates and large reserves of natural resources were seen as places to settle, which made the establishment of property rights and constructive institutions imperative. Con-versely, in countries that were less endowed, the governing framework was more extrac-tive in nature (Acemoglu et al., 2001). As a result, these patterns are believed to have an impact on the subsequent development of the financial sector in former colonies.
Lastly, apart from using two different measures of financial development, additional control variables are used as a control for robustness. The results of the estimations are presented in the subsequent section.
4
Estimation Results and Discussion
4.1
Summary statistics
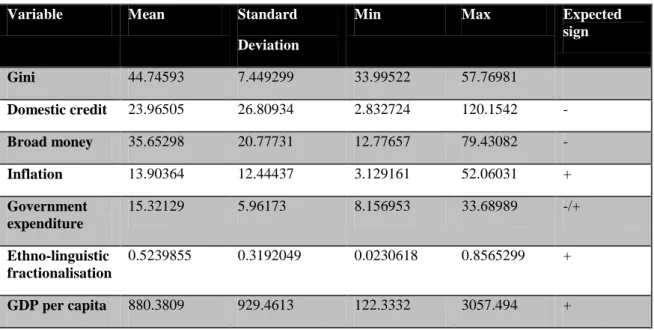
This section offers a presentation and a discussion of the results obtained from the model estimation. An inspection of the data, as depicted in Table 4.1, reveals the preva-lence of wide disparities in the sample. For instance, the average Gini coefficient2 for Algeria is the lowest (about 34.0%), while Botswana exhibits the highest (approxi-mately 57.8%). The corresponding values for the two measures of financial develop-ment range from a meagre 2.83% of the GDP to 120% (for domestic credit) and 12.8 % to 79.4 % (for broad money). The picture given by the rest of the variables is no differ-ent, emphasising the great differences that exist in the African countries under observa-tion, confirming the discussion in Section 2. The number of observations in each case is 20.
Table 4.1 Descriptive Statistics
Variable Mean Standard Deviation
Min Max Expected
sign Gini 44.74593 7.449299 33.99522 57.76981 Domestic credit 23.96505 26.80934 2.832724 120.1542 - Broad money 35.65298 20.77731 12.77657 79.43082 - Inflation 13.90364 12.44437 3.129161 52.06031 + Government expenditure 15.32129 5.96173 8.156953 33.68989 -/+ Ethno-linguistic fractionalisation 0.5239855 0.3192049 0.0230618 0.8565299 + GDP per capita 880.3809 929.4613 122.3332 3057.494 +
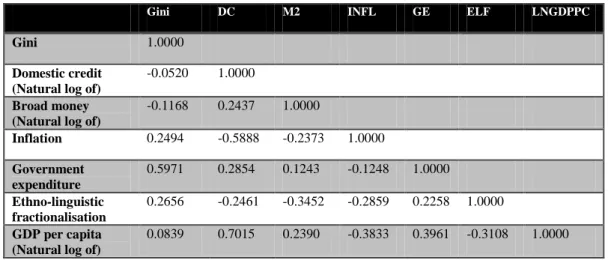
To investigate how these variables relate to each other, a correlation matrix is obtained. Table 4.2 presents the results and indicates that none of the variables are highly corre-lated with each other, implying that they all potentially contain unique information in explaining income inequality. In terms of signs, inflation (INFL), government consump-tion (GE), ethno-linguistic fracconsump-tionalisaconsump-tion (ELF) and the modern sector (GDPPC), ex-hibit the expected signs. This is also true for both measures of financial development as they seem negatively associated albeit weakly, with the Gini coefficient. This suggests that they could be income-equalising, in line with predictions from theory (as the scatter plots in Appendix 6.2 also confirm). However, an investigation of the partial correla-tions between the alternative measures of financial development and the Gini coefficient shows that although negative, neither is significantly correlated with income inequality. (These results are presented in Appendix 6.3). Since this initial inspection only shows
correlations and does not actually measure the strength of these relationships, estimating the regressions is in order before drawing any conclusions.
Table 4.2 Correlation Matrix of the Main Variables
Gini DC M2 INFL GE ELF LNGDPPC
Gini 1.0000
Domestic credit (Natural log of)
-0.0520 1.0000
Broad money (Natural log of)
-0.1168 0.2437 1.0000 Inflation 0.2494 -0.5888 -0.2373 1.0000 Government expenditure 0.5971 0.2854 0.1243 -0.1248 1.0000 Ethno-linguistic fractionalisation 0.2656 -0.2461 -0.3452 -0.2859 0.2258 1.0000 GDP per capita (Natural log of)
0.0839 0.7015 0.2390 -0.3833 0.3961 -0.3108 1.0000
4.2
Regression Results
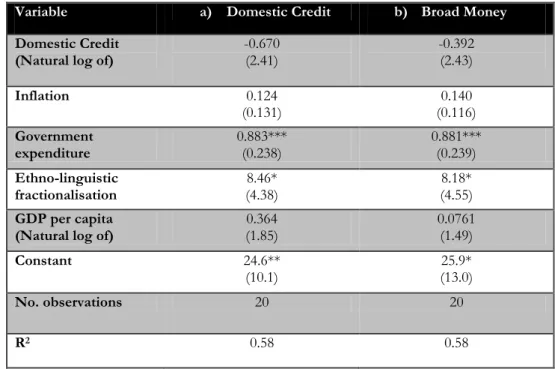
Performing regression analyses based on the estimation summarized in equation 1 yields interesting results. Table 4.3a presents the results based on the first variable of in-terest, the log of the domestic credit share of the GDP. Although this coefficient esti-mate bears a negative sign, which is in line with the theoretical predictions of a negative linear relationship as suggested by Barnejee and Newman (1993), it is statistically in-significant at all levels. If it had been in-significant, the coefficient estimate of -0.670 would imply that a 1% increase in domestic credit would lead to a drop in the Gini by 1.50% at the sample mean. Nevertheless, the lack of significance hinders from making any definite interpretations.
The coefficient estimates of the remaining explanatory variables turn out positive, but with only government spending and ethno-linguistic fractionalisation being significant. Although insignificant, the seemingly positive association between inflation and income would attest to the fact that the poor suffer more from increases in the price levels in the economy as they are less equipped to insulate themselves from the ensuing economic shocks.
In regards to government spending the coefficient of 0.883 suggests that, all else equal, a 1 unit increase in public spending and would be associated with an increase in the Gini coefficient of 0.883 units. Similarly, a one unit increase in the level of diversity measured by ethnic groups and languages, would be associated with an 8.46 unit in-crease in the Gini coefficient. Thus, on average, countries whose governments spend more and are more diverse are likely to have more skewed distributions of income than those who spend less and are characterised by more uniform populations.
Lastly, controlling for economic development results in a positive sign for the coeffi-cient estimate, reflecting how the early stages of development are characterised by greater income inequality (Kuznets, 1955). Once again however, the estimate lacks sig-nificance in explaining income inequality.
Table 4.3 Regression results: Financial Development and Income Inequality
Variable a) Domestic Credit b) Broad Money
Domestic Credit
(Natural log of) -0.670 (2.41) -0.392 (2.43)
Inflation 0.124 (0.131) (0.116) 0.140 Government expenditure 0.883*** (0.238) 0.881*** (0.239) Ethno-linguistic fractionalisation (4.38) 8.46* (4.55) 8.18* GDP per capita
(Natural log of) (1.85) 0.364 0.0761 (1.49)
Constant 24.6**
(10.1) (13.0) 25.9*
No. observations 20 20
R2 0.58 0.58
Standard errors are reported in parenthesis. *, ** and *** denote significance at 10%, 5% and 1% respec-tively.
Table 4.3b shows the results of coefficient estimates based on the alternative measure of financial development represented by the log of the ratio of broad money to GDP. As in the former case, even though this variable has a negative coefficient estimate, entailing an income-equalising effect, it is not statistically significant. The rest of the results are very similar to those based on domestic credit and thereby have similar interpretations.
4.3
Additional tests
In an attempt to minimise the possibility of model misspecification and to investigate the predicted existence of an inverted relationship between financial development and income inequality (Greenwood and Jovanovic, 1990), additional models including squared terms of per capita GDP, and of the financial development indicators are esti-mated. To avoid multicollinearity in these estimations, orthogonalised variables are used. However, these provide no evidence of the postulated inverted U-curve, but rather the opposite of what would be expected in regards to signs. In addition, the coefficient estimates of the variables of interest are not significant. Thus, these results add very lit-tle to the discussion and are only therefore reported in Appendix 6.4.
Given that the finance and growth discourse has highlighted the endogenous nature of financial development indicators as a potential issue, the above models are also esti-mated taking into account possible endogeneity. Based on the wide usage of legal origin and absolute latitude as instruments in finance-growth studies, these two are included in the two-stage-least-squares (2SLS) estimations. However the Wu-Hausmann tests pro-vide no epro-vidence of endogeneity, which is why only the OLS estimates are reported. To ascertain that the OLS assumptions are not violated, tests for heteroskedasticity and
for heteroskedasticity (Appendix 6.4), the models are robust to the homoskedastic-error assumption. In addition, none of the variance inflation factor (VIF) values exceeds 5, indicating that the regressors are not characterised as having too high multicollinearity. In order to test for the robustness of the results, variables capturing the size of the mod-ern sector and trade openness are added to the model. Introducing these variable changes neither the signs nor the significance of the original variables. Modern sector is the sum of industry and service output as a share of the GDP and its inclusion is based on Kuznets’ (1955) prediction that a larger modern sector allows for greater inequality given wage differences that arise between workers here and in the agricultural sector. Thus, the coefficient estimate for modern is expected to be positive and the results con-firm this. Trade openness, as measured by the sum of exports and imports as a share of the GDP enters negatively. This implies the possible existence of an enhancement of opportunities for welfare and equality in the distribution of resources provided by the internationalisation of the economy as predicted by international trade theory. However neither this effect nor the former is statistically significant.
4.4
Discussion
Putting these results in the context of previous research, some of the outcomes are sur-prising while others are not. With respect to the financial development variables, the two studies that have an African focus, Kai and Hamori (2009) and Fofowe and Abi-doye (2013) show contradicting results. The outcome of this study is more similar to the latter than the former. The former, which only uses the ratio of M2 to GDP as a proxy for financial development finds it to have a significant income-equalising effect. The latter however finds that both coefficients of the measures of financial deepening show a negative sign, but are statistically insignificant in explaining income inequality. This is also evident in the study by Kappel (2010), whose results for the developing-country sub-sample show that the effect of financial development is not as pronounced as in the industrialised world since the measures are either insignificant or in some cases even change signs, implying that financial development could have an inequality-enhancing effect. This highlights that the effect of financial development on inequality might be dependent on country-specific structures, which would speak in favour of in-dividual case studies such as Odhiambo (2009) on South Africa, Ang (2010) on India, Bittencourt (2010) on Brazil, Jalil and Feridun (2011) on China, and Shahbaz and Islam (2011) on Pakistan. These deal with developing/emerging economies that share similari-ties with the several African countries and they all ascertain that financial development narrows differences in income. Although these assessments are based on longer time pe-riods than in this study, Bittencourt (2010) bases his conclusions on the ten-year period of 1985-1994. These examples also show that more insightful analyses might be ob-tained by conducting country-specific and/or subregional studies in which the effect of financial development on income inequality is more easily discernible, indicating the importance of the level of aggregation in finance-inequality studies. Unfortunately, the number of observations in this study is only 20, making it difficult to conduct meaning-ful subsample analyses based on subregions.
With regard to control variables, they all show the expected signs with the positive ef-fect of government expenditure found to be more pronounced than the negative which would imply an income-equality enhancing effect. Although this contradicts the
find-ings of Clarke et al. (2013) and Nikoloski (2013) who do not take into consideration dif-ferences between developing and developed countries, Kappel (2010) finds evidence of the positive effect for developing countries. This illustrates that the redistributive mechanisms in low-income countries and thus for the sample at hand benefit the rich more than the poor, resulting in wider income gaps. This effect is also observed by Od-edokun and Round (2004) for the African case.
In addition the ethno-linguistic variable is also found to be positively significant, as it is for Clarke et al. (2013) and Kappel (2010). Both argue that ethnic diversity enforces in-come inequality as the prevalence of different ethnic groups makes public provision dif-ficult. Seeing that such great ethnic diversities exist in Africa, it is not surprising that high Gini coefficients are prevalent on the continent. Milanovic (2003) even goes to ar-gue that the one of the main factors why the predictions of Kuznets (low level of devel-opment being associated with greater equality) fails to hold for Africa is due to ethnic fractionalisation. This highlights the importance of this variable in explaining income inequality on the continent.
Inflation and GDP per capita are both found to have positive but non-significant coeffi-cient estimates in this study. However Kai and Hamori (2009) and Fowowe and Abi-doye (2013) reach different conclusions based on their results. The former finds infla-tion positive and insignificant, while the latter contends there is strong evidence for its income-inequality increasing effect predicted by theory. For economic development Kai and Hamori (2009) ascertain that inequality increases as African countries grow richer, while this study and Fofowe and Abidoye (2013) cannot conclude that for sure due to the coefficient being insignificant.
To summarize, the present results find government spending and ethno-linguistic frac-tionalisation to be positively and significantly associated with income inequality. More important to the purpose, the results provide very weak evidence of the income-equalising effect of financial development. Evidently the relationship between the two in the African context is not clear-cut as attested to by the contradictory findings of Kai and Hamori (2009) and Fowowe and Abidoye (2013). In fact other authors like Ander-sen et al. (2012) and Harris (2012) go so far as to question the applicability of the entire finance-contributing-to-growth thesis (from which the finance-inequality hypothesis is derived) on the African context, arguing that the existing theoretical and empirical foundations are too unstable to build any robust conclusions on. This underlines the fact that there is much to uncover before we can confidently assert that financial deepening contributes to a more even distribution of income.
5
Conclusion
The discourse on the relationship between financial development and economic out-comes has been ongoing for centuries. Recently the interaction with income inequality has captured the interest of many economists and policy makers in attempt to create a more equal distribution of resources and thereby achieve inclusive growth globally. A growing body of studies attests to the income-equalising effect of deeper financial sectors, which has enforced the optimism driving financial reforms. With this in mind, this study investigates the effect of financial development as measured by domestic credit and broad money alternatively, as shares of GDP, on the level of income inequal-ity represented by the Gini coefficient in the African context. The context is a special one given that almost two decades after massive financial reforms, it is still generally characterised by low levels of financial development coupled with high and persistent income inequality.
To add to the scant research examining the interaction between these two macroeco-nomic variables for this region, this paper uses an OLS approach to estimate a cross-sectional model based on averages in the 16-year period from 1990-2005. The results provides very little evidence for financial development leading to a more equal income distribution. Although the coefficients for both financial development indicators bear the expected signs, they turn out insignificant, providing insufficient grounds to confirm the predicted negative linear relationship. Furthermore, the outcome also refutes the ex-istence of the inverted U-shaped association between the variables of interest predicted by Greenwood and Jovanovic (1990).
However, the impact of government spending and ethno-linguistic fractionalisation is very evident. The use of tax revenues and highly fractionalised nature of many African economies is associated with greater disparities in income distribution. The former ef-fect has been observed in the literature for developing economies and is argued to be a result of the lack of tax redistributive systems that create a more even distribution of in-come. This is further exacerbated by the fact that it is difficult to reconcile the prefer-ences of different ethnic groups in the provision of public goods (Kappel, 2010; Clarke et al., 2013).
Although the results of the main variables provide a sobering effect on the optimism surrounding the potential benefits of financial sector development, it is important to keep in mind that the measures used to proxy financial development might not be the most appropriate. This is because they do not necessarily capture how wide financial services reach, which would reveal how well financial sector caters to various segments on the income distribution, as argued by Claessens and Perotti (2007). This is particu-larly true in the African case where the informal financial sector holds an increasingly important role in achieving greater financial inclusion, which is not usually captured in data.
With improved and more accurate data, such as the Global Financial Inclusion Index es-tablished in 2011, future research stands to benefit from measures that may reflect fi-nancial sector development more accurately. In addition, although this cross-sectional study provides a general picture of the relationship between income inequality and fi-nancial development, it ignores the unique characteristics of individual countries. A more appropriate basis for conclusive remarks and policy implications could be gained
by studying specific countries, or groups of countries with similar structures as the stud-ies on individual countrstud-ies such as Brazil, China, India and South Africa highlighted in the paper show.
In conclusion, there remains a lot to discover on the finance-inequality mechanism and this knowledge stands to increase with time as data is enhanced both in quality and quantity. In addition, allowing for time to pass will also add new dimensions in the as-sessment of these slow-moving variables.
List of references
List of references
Acemoglu, D., Johnson, S., & Robinson, J. A. (2001). The colonial origins of comparative development: An empirical investigation. American Economic Review, 91, 1369-1401.
Africa Development Indicators, 2012. The World Bank Africa Development Indicators. (2013,
Sep-tember). Retrieved from http://data.worldbank.org/data-catalog/africa-development-indicators
Aghion, P., & Bolton, P. (1997). A theory of trickle-down growth and development. Review
of Economic Studies 64(2), 151-72.
Alesina, A., Devleeschauwer, A., Easterly, W., Kurlat, S., & Wacziarg, R. (2003). Fractional-ization. Journal of Economic Growth, 8, 155-194.
Andersen T. B., Sam, J., & Tarp, F. (2012). The finance-growth thesis: A sceptical assess-ment. Journal of African Economies, 21, AERC Supplement 1, i57-i88.
Ang, J. B. (2010). Finance and inequality: The case of India. Southern Economic Journal, 76, 738-761.
Bagehot, W. (1873). Lombard street: A description of the money market. Homewood, IL: Richard D. Irwin.
Banerjee, A., & Newman, A. (1993). Occupational choice and the process of development.
Journal of Political Economy, 101, 274-298.
Beck, T., Demirgüc-Kunt, A., & Levine, R. (2007). Finance, inequality and the poor. Journal
of Economic Growth, 12(1), 27-49.
Beck T., and Maimbo, S. M., eds., 2013. Financial sector development in Africa opportuni-ties and challenges. Washington DC: World Bank.
Bittencourt, M. (2010). Financial development and inequality: Brazil 1985-1994. Economic
Change and Restructuring, 43, 113-130.
Claessens, S., & Perotti, E. (2007). Finance and inequality: Channels and evidence. Journal of
Comparative Economics, 35, 748-773.
Clarke, G., Xu, L.C., & Zou, H. (2013). Finance and income inequality: Test of alternative theories. Annals of Economics and Finance 14-2(A), 493-510.
Commercial Bank of Africa. M-Shwari. (2014, April). Retrieved from http://cbagroup.com/m-shwari/
Demirgüc-Kunt, A. and Klapper, L., 2013 Financial inclusion in Africa: A snapshot. In Triki, T., and Faye, I. eds. (2013). Financial Inclusion in Africa. (43-57) Tunis: African Devel-opment Bank.
Easterly, W. & Fischer, S. (2001). Inflation and the poor. Journal of Money, Credit and Banking, 33(2), 160-178.
List of references
Econet: Ecocash. (2014, April). Retrieved from www.econet.co.zw
Fowowe, B., & Abidoye, B. (2013). The effect of financial development on poverty and in-equality in African countries. The Manchester School, 81(4), 562-585.
Galor, O., & Zeira, J. (1993). Income distribution and macroeconomics. Review of Economic
Studies, 60, 35-52.
Greenwood, J., & Jovanovic, B. (1990). Financial development, growth, and the distribu-tion of income. Journal of Political Economy, 98, 1076–1107.
Goldsmith, R. W. (1969). Financial structure and development. New York: Yale University Press. Harris, L. (2012). From Financial Development to Economic Growth and Vice Versa: A Review of International Experience and Policy Lessons for Africa. Journal of African
Econo-mies, 21, AERC Supplement 1, i89-i106.
Jalil, A., & Feridun, M. (2011). Long-run relationship between income inequality and finan-cial development in China. Journal of the Asia Pacific Economy, 16(2), 202-214.
Jeanneney, S. G., & Kpodar, K. (2011). Financial development and poverty reduction: Can there be a benefit without a cost? The Journal of Development Studies, 47(1), 143-163.
Kai, H., & Hamori, S. (2009). Globalization, financial depth, and inequality in Sub-Saharan Africa. Economics Bulletin, 29(3), 2025-2037.
Kappel, V. (2010). The effects of financial development on income inequality and poverty, Center of Economic Research at ETH Zurich, Working Paper 10/127.
Kuznets, S. (1955). Economic growth and income inequality. American Economic Review 45(1), 1-28.
La Porta, R., Lopez-de-Silanes, F., Shleifer, A., & Vishny, R. (1999). The quality of gov-ernment. Journal of Law, Economics and Organization 15(1), 222-279.
Levine, R. (1997). Financial development and economic growth: Views and agenda. Journal
of Economic Literature, XXXV, 688–726.
Levine, R., Loayza, N., & Beck, T. (2000). Finance and sources of growth. Journal of
Finan-cial Economics, 58, 261–310.
Lucas, R. E. (1988). On the mechanics of economic development. Journal of Monetary
Eco-nomics, 22, 3–42.
McKinnon, R. I., 1973. Money and capital in economic development. Washington, DC: Brookings Institution.
Milanovic, B. (2003). Is inequality in Africa really different? World Bank Policy Research Working Papers Series 3169.
Nikoloski, Z. (2013). Financial sector development and inequality: Is there a financial Kuz-nets curve? Journal of International Development, 25, 897-911.