Norstrat
Nordic power road map 2050:
Strategic choices towards carbon neutrality
D4.2.R Policy and Institutional Review Electric Vehicles (EV)Author(s)
Martin Albrecht (KTH)1 , Måns Nilsson (SEI2/KTH), Jonas Åkerman (KTH)
KTH Royal Institute of Technology
Division of Environmental Strategies Research Drottning Kristianas väg 30, 3tr SE-100 44 Stockholm Sweden Phone: +46-8-790 86 21 martin.albrecht@abe.kth.se http://www.kth.se/en/abe/om-skolan/organisation/inst/som/avdelningar/fms 1 Corresponding author
Abstract
This report examines policy drivers of electric vehicles (EVs), and what potential role policy can play in enhancing the innovation and market development of EVs. We start with a policy review of key targets in the Nordic countries and the EU, up to 2030, and discuss to what extent they are consistent with industry, government and expert estimates of how the EV innovation systems can grow. On the basis of this, the second part examines what policy drivers might be needed to enable a
breakthrough scenario, using a technological innovation systems (TIS) perspective to describe the needed processes, drivers and developments in policy and technology. Keywords: Technological Innovation System (TIS), electric vehicles (EV),
1.
Contents
1. Introduction ... 1
2. Policy drivers, policies and targets ... 2
Finland ... 6
Sweden ... 7
Denmark... 9
Norway ... 10
Nordic comparison ... 11
3. Future policy drivers for an BEV&PHEV breakthrough ... 14
Entrepreneurial activities ... 16
Knowledge development & knowledge diffusion ... 17
Positive external effects ... 17
Resource mobilisation ... 18
Guidance ... 18
Market creation ... 19
Creation of legitimacy... 22
Materialisation ... 23
4. Results and conclusion ... 23
5. References ... 25
List of Tables Table 1 EV policy frameworks across the Nordic countries ... 12
List of Figures Figure 1 Passenger car’s share of total emissions in the Nordic countries ... 2
Figure 2 Passenger car’s share of total road transport emissions in the Nordic countries ... 3
Figure 3 Total passenger cars emissions per capita ... 4
Figure 4 Average carbon dioxide emissions per km from new passenger cars ... 5
List of Abbreviations
BEV Battery electric vehicle
CO2 Carbon dioxide
EU European Union
EV Electric vehicle
GHG Greenhouse gas emissions
HEV Hybrid electric vehicle
ICE Internal combustion engine
OEM Original equipment manufacturer
PHEV Plug in hybrid electric vehicle
R&D Research and development
REV Range extended electric vehicle
Page 1 of 42
1. Introduction3
Over the last ten years, the interest for low-carbon vehicle technologies has surged among both governments and automotive manufacturers across and beyond the European Union. Great hopes have been put, first, on biofuel vehicles and more recently (as the enthusiasm for biofuels cooled off) on electric and hybrid electric vehicles as key technologies to mitigate climate change, enhance energy security and nurture new industry branches within the automotive sector. In particular in the Nordic region, where electricity production has a relatively minor fossil input on average, electrification of transport has been seen as a key strategy to reduce CO2
emissions from the transport sector.
However, while the market penetration for biofuel vehicles has been relatively high in some countries, the corresponding increases in electrification of vehicles have not materialized so far. An important reason for this is that vehicle prices remain
considerably higher for electric vehicles (EVs) and hybrid electric vehicles (HEVs) compared with internal combustion engine (ICE) based vehicles mostly due to high lithium-ion battery prices. Also, the shape of the learning curve and associated future costs remain uncertain and predictions vary strongly (Kampman, Essen, et al., 2011; Kampman, Braat, Essen, & Gopalakrishnan, 2011; Yabe, Shinoda, Seki, Tanaka, & Akisawa, 2012). Lack of experience with battery durability under different climatic and driving conditions poses a significant risk for early adopters investing in a new EV car. Additionally, BEVs, and in some cases also PHEVs or REVs, require new infrastructure (for charging and to some extent for the upgrade of the local power grid) and different driving behaviour. As a result, there are major uncertainties in a) future forecasts about BEV/PHEV/REV market penetration, b) what policy frameworks are needed to facilitate the market uptake of these vehicles, and c) what are ultimately the climate implications of these forecasts. We do know that over the coming years, BEV/PHEV technology will require public governance measures of different types, both to induce innovation and market uptake, and to control and mitigate possible environmental and social consequences.
This report addresses these uncertainties in the context of the Nordic region (Denmark, Finland, Norway and Sweden) and focuses on the following questions:
How do policies, goals and targets within and across the Nordic countries compare against industry, government and expert forecasts about market uptake?
What policy or broader governance initiatives are likely needed to have a plausible chance of reaching a breakthrough scenario?
This report unfolds as follows. In section 2, we present a review of policies and key targets in the Nordic countries and the EU, and discuss to what extent they align with or deviate from industry, government and expert estimates of how the systems
3
The report is based on (forthcoming) : Albrecht, M., Nilsson, M., & Åkerman, J. (2013). Electrification of vehicles – policy drivers and impacts in two scenarios. Grid Integration of Electric Vehicles in Open Electricity Markets. Wiley.
Page 2 of 42 can grow. On the basis of this section 3 examines what policy drivers might be needed to enable a breakthrough scenario, using a technological innovation systems (TIS) perspective to describe the needed processes, drivers and developments in policy and technology. Section 4 summarizes our results and conclusions.
2. Policy drivers, policies and targets
Across the EU and globally, policy makers’ interest in the electrification of vehicles have surged. Most EU countries have presented national development plans and targets for EVs. The interest is related to at least three political priorities.
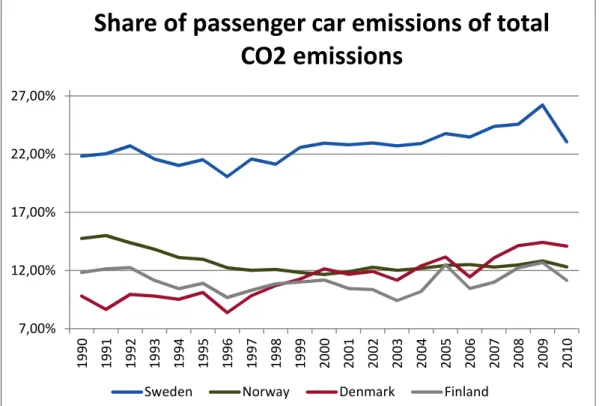
The first concerns climate change mitigation. In the Nordic countries total passenger car emissions in 2010 accounted for 14.10% of total emissions in Denmark, 11.15% in Finland, 12.31% in Norway and 23.05% in Sweden (see Figure 1) (EEA, 2010; SSB, 2012; Statistics Finland, 2011; Trafikverket, 2011; Winther, 2012; VTT, 2012). It is worth noting that this makes Sweden the second worst in the EU27 when just looking at the percentage. This is partly a result of Sweden having relatively lower emissions percentages in other sectors. However, it still indicates that it is especially in this sector Sweden still has much to gain from mitigation measures.
Figure 1 Passenger car’s share of total emissions in the Nordic countries (EEA, 2010; SSB, 2012; Statistics Finland, 2011; Trafikverket, 2011; Winther, 2012; VTT, 2012)
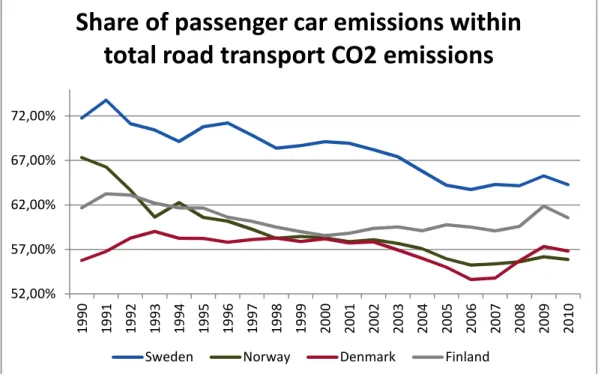
The emission share of passenger cars within road transport is decreasing in most Nordic countries while emissions from light and heavy trucks are increasing (see also Figure 2) (EEA, 2010; SSB, 2012; Statistics Finland, 2011; Trafikverket, 2011;
Winther, 2012; VTT, 2012). The numbers are however overshadowed by the financial and economic crisis which reduced economic activity in the other road transport modes. Overall the long term trend indicates that some of the transport
7,00% 12,00% 17,00% 22,00% 27,00% 1 9 9 0 1 9 9 1 1 9 9 2 1 9 9 3 1 9 9 4 1 9 9 5 1 9 9 6 1 9 9 7 1 9 9 8 1 9 9 9 2 0 0 0 2 0 0 1 2 0 0 2 2 0 0 3 2 0 0 4 2 0 0 5 2 0 0 6 2 0 0 7 2 0 0 8 2 0 0 9 2 0 1 0
Share of passenger car emissions of total
CO2 emissions
Page 3 of 42 work is shifted in between road transport modes but also that the environmental performance of passenger cars is improving more quickly.
Figure 2 Passenger car’s share of total road transport emissions in the Nordic countries (EEA, 2010; SSB, 2012; Statistics Finland, 2011; Trafikverket, 2011; Winther, 2012; VTT, 2012)
In absolute terms CO2 emissions from passenger cars stayed on a relatively high but stable level for Sweden and there are signs of a downward trend. The other Nordic countries are still growing in absolute CO2 emissions from passenger cars although from a much lower base. If one looks at the passenger car emissions per capita numbers, the Swedish downward trend becomes more obvious (EEA, 2010; Eurostat, 2012a; SSB, 2012; Statistics Finland, 2011; Trafikverket, 2011; Winther, 2012; VTT, 2012). Norway has been able to stabilise its emissions while Denmark has almost succeeded in doing so. Before the financial and economic crisis Finland was on a clear upward trend (see also Figure 3).
52,00% 57,00% 62,00% 67,00% 72,00% 1 9 9 0 1 9 9 1 1 9 9 2 1 9 9 3 1 9 9 4 1 9 9 5 1 9 9 6 1 9 9 7 1 9 9 8 1 9 9 9 2 0 0 0 2 0 0 1 2 0 0 2 2 0 0 3 2 0 0 4 2 0 0 5 2 0 0 6 2 0 0 7 2 0 0 8 2 0 0 9 2 0 1 0
Share of passenger car emissions within
total road transport CO2 emissions
Page 4 of 42
Figure 3 Total passenger cars emissions per capita (EEA, 2010; Eurostat, 2012a; SSB, 2012; Statistics Finland, 2011; Trafikverket, 2011; Winther, 2012; VTT, 2012)
Generally, rapid action is required to reduce passenger car emissions in line with ratified climate change goals. Otherwise, extrapolating the current function of environmental performance of the average passenger car in the fleet, we will not see a carbon neutral road transport sector within the next couple of decades. The data also suggests that even though passenger cars are the most important challenge right now we will also have to tackle light and heavy trucks in the near future if one wants to counter given growth trends (see Figure 2).
The second political priority concerns energy security. Overall transport accounts for around one-third of energy consumption and with its heavy reliance on fossil fuels, the sector is vulnerable to oil supply and connected price changes. The electrification of vehicles is a prime strategy to decrease the reliance on imported fossil fuels. The third concerns innovation, job creation and economic growth (Lerner, 2010, p. 257).
Competition globally in the automotive sector is fierce and it is commonly held that manufacturers need to be ”ahead of the curve” in terms of technology development in order to stand their ground against emerging low-cost competition from in particular Asia. In the EU this concern can be framed politically in the broader Lisbon strategy of 2006, which set out the EU of becoming a ”dynamic and competitive knowledge-based economy” (European Commission, 2007). The European automotive sector is an important sector representing 2.3 million directly employed (7% of all manufacturing employment in the EU27) and indirectly supporting more than 12 million European jobs (taking into account connected services etc.) (ACEA, 2008).
On EU level important policies include the renewable energy directive which has the goal of achieving 10 % renewable energy in the transport sector by 2020. Through the fuel
quality directive a reduction of CO2 intensity of fuels by 6 % by 2020 has to be
achieved. With the clean vehicle directive starting December 2012 public procurement of 0,95 1,05 1,15 1,25 1,35 1,45 1,55 1 9 9 0 1 9 9 1 1 9 9 2 1 9 9 3 1 9 9 4 1 9 9 5 1 9 9 6 1 9 9 7 1 9 9 8 1 9 9 9 2 0 0 0 2 0 0 1 2 0 0 2 2 0 0 3 2 0 0 4 2 0 0 5 2 0 0 6 2 0 0 7 2 0 0 8 2 0 0 9 2 0 1 0
tCO2 emissions from passenger cars per
capita
Page 5 of 42 vehicles needs to take into account the energy consumption as well as CO2
emissions of the vehicles. In 2011, the EU adopted a roadmap for the next decade to reduce its dependence on imported oil and to cut carbon emissions in transport by 60% by 2050 (European Commission, 2011). Furthermore, EU vehicle emissions regulations stipulate that by 2015 130g CO2/km (phased in starting 2012) and by 2020 95g CO2/km very likely have to be fulfilled (Creutzig, McGlynn, Minx, & Edenhofer, 2011, pp. 2399–2400; Lewis, 2012; Nemry et al., 2009, p. 18).
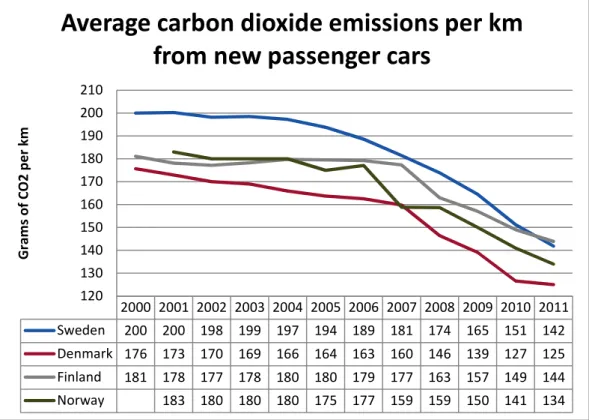
Furthermore the European parliament has mentioned the possibility of setting a 75g CO2/km target for 2025 (Kågesson, 2010, p. 124). To set those numbers into context, the current g CO2/km data for the average new passenger cars in the Nordic countries can be seen in Figure 4 (EEA, 2012a, 2012b; Eurostat, 2012b). The graph shows that Sweden and Finland are clearly lacking behind Norway and
Denmark. In fact, Denmark already is below the 2015 EU emission target.
Figure 4 Average carbon dioxide emissions per km from new passenger cars. (EEA, 2012a, 2012b; Eurostat, 2012b)
Globally as well as in the EU, the economic crisis since 2008 pressed for stimulus spending in the automotive sector. Governments have provided subsidies, loans and R&D support, the latter typically oriented towards environmentally friendly cars. Piloting and demonstration projects have often been implemented in cooperation with the private sector and in cooperation between universities, public institutions, power industry and the automotive industry both on national level or European level.
Tax incentives such as CO2-differentiated vehicle taxes and car rebates have been introduced in many countries in the EU. However, the tax level can be very different from country to country taking into account the full set of measures. Kley et al (2012) found that as of 2010, the EU countries could be grouped into three
2000 2001 2002 2003 2004 2005 2006 2007 2008 2009 2010 2011 Sweden 200 200 198 199 197 194 189 181 174 165 151 142 Denmark 176 173 170 169 166 164 163 160 146 139 127 125 Finland 181 178 177 178 180 180 179 177 163 157 149 144 Norway 183 180 180 180 175 177 159 159 150 141 134 120 130 140 150 160 170 180 190 200 210 G ra m s o f C O 2 p e r k m
Average carbon dioxide emissions per km
from new passenger cars
Page 6 of 42 categories with respect to the total incentives provided when it comes to mid-sized cars (Kley, Wietschel, & Dallinger, 2010, 2012):
• the leaders (incentive from 10,000 to 28,000 euros: Denmark, Norway, Belgium),
• the followers (incentive from 4,000 to 9,000 euros: Netherlands, Spain, UK, France, Switzerland, Austria),
• the laggards (with amounts +/- 3,000 euros: Ireland, Greece, Italy, Germany, Sweden, Poland, and Finland).
Among the Nordic countries, only Sweden has a significant automotive industry (Eurostat, 2012c). The sector directly employs roughly 72,000 people in Sweden representing 10.7% of total manufacturing jobs (2009), 6331 in Denmark
representing 1.6% of total manufacturing jobs (2008), 7509 in Finland representing 1.9% of total manufacturing jobs (2009) and 3300 in Norway representing 1.4% of total manufacturing jobs (2009). Despite their relatively small automotive industry Norway and Denmark have taken a strong interest in advancing electric vehicle technologies and innovation systems.
In terms of market introduction of EVs, Norway currently has the lead. At the end of October 2012 9212 EVs were on Norway’s roads which makes it one of the most successful countries in terms of EVs per capita (Grønn Bil, 2012a). By comparison, as of the end of September 2012 there were 1320 BEVs registered in Denmark, 1067 BEVs & PHEVs as of the end of October 2012 in Sweden and about 60 BEVs in Finland as of June 2012 (Dansk Elbil Alliance, 2012a, p. 5; easycharge, 2012; Godske, 2012; hbl.fi, 2012; Helsingborg stad, 2012; Nordgren, 2012). These numbers are, however, somewhat unreliable as some sources include direct private imports while others don’t. Also, some sources take into account four wheel drives that are not classified as passenger cars and some take into consideration PHEVs/REVs while others don’t.
Below, we describe in more detail the policies and targets for our four Nordic countries. Through that we get a better understanding of the policies that exist and how they compare to the policy drivers presented above.
Finland
Goals: Finland has so far not established a specific national goal for the introduction
of electric vehicles. However, the government has presented a climate and energy strategy where two goals are to reduce GHG emissions from traffic and transport by 15% and to increase the energy efficiency of the transport sector by 9% from 2005 to 2020 (Finnish Transport Agency, 2011, p. 10). The government has also developed a vision for 2050 in which the direct specific emission of cars are supposed to reach 80g-90g CO2 per km by 2030, 50-60g CO2 per km by 2040 and 20-30g CO2 per km by 2050 (Finish Government, 2009, p. 106; 156).
Policy instruments: A vehicles tax reform began in 2008 which eventually is supposed to
give consumers more choice on the level of tax when they buy new or used cars (Finansministeriet, 2011a, 2011b). Today the registration tax as well as the annual
Page 7 of 42 vehicle tax is based on CO2 emissions. The new registration tax was introduced in 2008 and the new annual vehicle tax in 2010 (Kosk, 2010). In 2012 the lowest registration tax level, for cars with 0 g/km CO2, was reduced from 12,2% to 5% (Finansministeriet, 2011a, 2011b, 2012; Lindén, 2011). The highest tax level was raised from 48,8 to 50%. Overall the message is that cars with less than 110 g/km CO2 will get a lower registration tax compared to the tax regime before. For new BEVs that means that the previous registration tax is being reduced from 3660 Euros to 1500 Euros for a BEV that costs 30000 Euros. The base tax within the annual vehicle tax is also based on CO2 emissions and after the 1st of April 2012 can vary between 43 and 606 Euros per year (Finansministeriet, 2011a).
The Finnish government has also identified the electric vehicle as a Finnish export opportunity (FMEE, 2009). Subsequently, in 2011 TEKES (the Finnish Funding Agency for Technology and Innovation) introduced a 5 year program for the development of concepts for the EV and connected infrastructure (Lindén, 2011; Tekes, 2011b). The programme is called EVE – Electric Vehicle Systems programme and also hopes to create a strong community around EVs in Finland (Tekes, 2012). The largest project in the portfolio is the Electric Traffic Helsinki Test Bed project which among other targets has the aim to establish around 850 charging spots in the capital region and enable the driving of 400 EVs during a period of four years (electrictraffic.fi, 2012; Kvisle, 2012; yle Nyheter, 2012). Other significant projects include EVELINA (National Test Environment for Electric Vehicles)
(www.evelina.fi, 2012), Eco Urban Living (eco-urbanliving.com, 2012), SIMBe ((Smart Infrastructures for Electric Mobility in Built Environments) which started in January 2010 and is funded by TEKES Sustainable community programme) (Tekes, 2011a), and the battery research programme SINi (Aalto University, 2012).
Industry position: Finland has a major and experienced EV manufacturing facility
through the company Valmet Automotive who mainly builds EVs for other brands e.g. the REV sports car Fisker Karma (Mellgren, 2010). Furthermore, before its recent bankruptcy, the Think car has been produced in Finland at the same factory (Karlberg, 2010). Another Finish EV manufacturer is the company AMC Motors with their model Sanifer (Kronqvist, 2011). Finland is also home to a larger battery manufacturer called European Batteries (Hållén, 2010). Fortum as the major Finish utility is part of several pilot projects across the Nordic countries and is foremost driving developments in the smart as well as fast charging area (Albrecht, 2011b; Infrastrukturnyheter, 2011).
Sweden
Goals: The Swedish government has established the vision of a “fossil fuel
independent” transport sector by 2030, but has no target for PHEV/BEV penetration. Industry groups have put forward a vision for 600,000 PHEVs and BEVs on Swedish roads by 2020 (Elforsk, TSS, & Power Circle, 2010, p. 17; Hatt, 2012a; Power Circle, ElForsk, & Test Site Sweden, 2009). The 2030 government vision is currently not backed up by concrete road maps, even though the
government recently decided to develop such a road map (Hatt, 2012a). At the same time different industry organisations have established scenarios (Sköldberg et al., 2010; Svensk Energi, 2011). There is significant scepticism and uncertainty about those targets, and even government officials think that only a modest 20,000 to
Page 8 of 42 85,000 PHEVs and BEVs by 2020 is actually achievable under current institutional conditions (Elforsk et al., 2010, p. 17; Energimyndigheten, 2009, p. 8; Lewald, 2011).
Policy instruments: Sweden has implemented a number of separate policy measures that
are targeted at environmental friendly cars in a seemingly technology neutral way. A major part of Sweden’s policy package, and the debate around it, centres on the green car definition. Confusingly, different definitions persist, emanating from different institutional homes; the road transport law, the income tax law, and from several municipalities developing their own definitions (Miljofordon, 2012). The road transport law primarily eliminates the yearly vehicle tax for private persons and professional organisations for a period of 5 years for all green cars introduced after the 1st of June 2009 (currently the green car definition translates into 120g/km CO2
(or cars driven by alternative fuels with fuel consumption per 100km of 9,2 L
gasoline equivalents, 9,2 cubic meters of gas or 37 kWh electricity)). A new green car definition is scheduled to be implemented at the beginning of 2013.
For the income year 2012 and 2013 the income tax law foresees that the tax on the private benefit stemming from an employee driven but company owned BEV, PHEV or biogas car to be 40% less compared to a comparable average model. The reduction takes place after the tax level has already been reduced to the average model but all in all the total reduction can’t be higher than 16000 SEK (Skatteverket, 2012). Ethanol cars, HEVs, and a variety of other biofuels are only reduced to the tax level of a comparable average model but are not reduced further. In 2012, the government introduced a new 40,000 SEK subsidy for the purchase of “super green” cars (less than 50 g/km CO2). The budget will be sufficient to support the equivalent of about 5,000 EVs (Swedish Government, 2011a, 2011b). At the end of September 2012 the maximum budget for 2012 which was 20 million SEK had been reached (SvD, 2012).
Additionally, Swedish government efforts are connected to research funding usually for larger industry players (e.g. Volvo, Saab) as well as several pilot projects across Sweden (e.g. Malmö, Gothenburg, Stockholm, Östersund, Sundsvall, Helsingborg) (Lundgren, 2011; Malmö City, 2009a, 2009b; Stockholm City, 2009; Sunnerstedt, 2011; Östermark, 2011). Those measures are co-financed with a 25-50 % stake by the Strategic Vehicle Research and Innovation program (FFI - a Vinnova funded
research program) or the Swedish Energy Agency (SEA) (Lewald, 2011). Other significant incentives include the national procurement plan initiated by the city of Stockholm and Vattenfall and partly financed by SEA (Elbilsupphandling.se, 2011). The purpose of the procurement is to allow the coordinated procurement of 6,000 EVs for companies and public agencies.
Regulatory changes are made to enable EV introductions. Since February 2011 municipalities can reserve parking spots in public spaces for EVs (Lewald, 2011; Swedish Transport Agency, 2011). However, it is not allowed to discriminate different types of vehicles when it comes to parking fees (Sunnerstedt, 2011). As a way to accelerate charging infrastructure deployment there no longer is a need to pay grid concession fees to the local grid company for connecting outside charging infrastructure (e.g. in malls) (Alpman, 2010; Energimarknadsinspektionen, 2010a, 2010b, 2011; Hatt, 2012b).
Page 9 of 42 Industry position: In Sweden industry is primarily concerned with research and
development of or related to electric powertrains. However, Volvo is on the verge of commercialising two cars, namely a BEV and a PHEV, the latter co-financed by Vattenfall. Similar to Volvo, Saab has also developed a BEV but the future of this project due to the company’s recent bankruptcy remains uncertain. The new owner expects that they will sell a Saab EV by 2014 (Wade, 2012) . The company EV Adapt is converting conventional cars to BEVs and there is also a company called Hybricon that will be selling electric buses. Otherwise there are also a number of companies that are active in the charging infrastructure business (e.g. Park&Charge,
ChargeStorm, Easycharge etc.). Moreover Sweden has and has had a number of demonstration programs in which e.g. utilities have been major partners (Albrecht, 2011a, 2011b).
Denmark
Goals: In 2009 the Danish parliament agreed on a common policy for a greener
transport system (TRM, 2009). The new Danish government recently adopted the goal to phase out all of the country’s oil, coal and natural gas until 2050 and to provide 50% of the country’s electricity by wind energy already by 2020 (Ritzau, 2012a, 2012b).
Policy instruments: The major EV instrument is the relief from registration fees until
2015 (Dansk Elbil Alliance, 2012b; ENS, 2012; TRM, 2011). The registration fee on passenger cars in Denmark in 2011 is 105% of the value until 79.000DKK and 180% of the value above (DMT, 2012), making such a tax relief a very strong incentive. Also the annual taxation of cars has been reformed: the tax was previously calculated on basis of car weight, but is now based on fuel economy.
In line with government goals, the Danish Transport Agency has been assigned to administrate a fund for research activities and demonstration projects on energy efficient transport. The largest single grant of first round was given to the project ‘Test-an-EV’ where 300 electric vehicles are tested for daily use by 2400 families during certain time periods (testenelbil.dk, 2012). The partner company for the project is Clever and the test is expected to reveal driving and charging patterns as well as user experiences with electric vehicles. Another large scale project is named EDISON (Electric vehicles in a Distributed and Integrated market using Sustainable Energy and Open Networks). The project uses the island of Bornholm as a full scale laboratory to investigate market solutions, electricity network configurations and interaction between energy technologies for EVs (Edison, 2012). The citizens of Bornholm also participate in the smart-grid project ‘EcoGrid EU’ and results are exchanged between the two projects (EcoGrid, 2012). Apart from the island of Bornholm also Copenhagen municipality should be put forward as a major actor since it is like Bornholm part of several EU research and demonstration projects. Essential to all those projects is also the cooperation with Danish universities like DTU that are part of multiple projects.
Industry position: Denmark is one of the countries where new business models with
regards to electric mobility are being implemented. Such companies dedicated to deployment, service systems and infrastructure for electric vehicles are by some
Page 10 of 42 addressed as Electric Mobility Operators (EMOs). Central EMOs in Denmark are for example Better Place Denmark (owned by Better Place Global with Dong Energy as minority stakeholder), ChoosEV which is now also called Clever (owned by the energy companies SE, SAES-NVE and the car rental company SIXT), CleanCharge and Clear Drive (Borking, 2012; CleanCharge, 2012; Clever, 2012; Møller, 2012). Especially Better Place has received worldwide attention for their business model that among other features relies on battery switching stations to overcome the range problem connected to EVs. Clever has also received attention due to the largest BEV trial within the EU in which so far 1600 Danish families participated within a period of three years (ChoosEV, 2012; CSR, 2012). Clever is building up a national charging network and among slow charging stations wants to reach 350 fast charging stations by 2015. An important network is the Danish Electric Vehicle Alliance which is a trade association for the electric vehicle industry in Denmark, formed in 2009 by the Danish Energy Association. The Alliance has initiated projects on standardization and roaming within the charging infrastructure and has recently as prepared a long term electric vehicle strategy (Dansk Elbil Alliance, 2012a). Members range from electric distribution and utility companies over the automotive industry to research institutes and smaller projects on electric vehicle technology.
Norway
Goals: The electric vehicle network elbil.no has a target of reaching 100,000 EVs by
2020. An even more ambitious industry vision is raised by Energi Norge to reach 200,000 BEVs and PHEVs by 2020. The government regularly releases its ten year plan for development in the transport sector. The latest plan spanning from 2010 to 2019 emphasizes the environmental impact of the transport sector and goals for limiting greenhouse gas emissions. The goal is to limit emissions from transport by 2,5 – 4,0 Mio tons of CO2 equivalents in 2020 according to continuation of the current development in the sector (NMTC, 2009). The country has also set the target to achieve an average emission level of 85 g CO2 per km in terms of total new vehicle sales by 2020 (Norwegian Government, 2012, p. 120).
Policy instruments: In order to reach its goals, the Norwegian government encourages
the purchase of electric vehicles in various ways. Noteworthy here is that BEVs currently are relieved from the registration tax (also sometimes called onetime tax or import tax) as well as the valued added tax (VAT) and have a much lower annual tax (10 – 20% that of ICE propelled vehicles) (Seljeseth, 2011). These measures are guaranteed until 2017 as long as no more than 50,000 such cars are on the roads (Grønn Bil, 2012b). The current government has even preliminary plans to continue them at least until 2020 (Johansen, 2012). BEVs are further relieved from parking fees at public parking lots, road pricing or congestion charges, charges on ferries (but the driver has to pay) and are often allowed to drive in bus-lanes that are otherwise reserved for public transport (Norwegian Government, 2012). Also in Oslo and other areas most public charging spots are free to use for owners of BEVs. Another actor to mention here is the public funding program Transnova that is currently among other initiatives funding fast charging stations across the country. The agency also funds various other projects aiming at reducing greenhouse gas emissions from the transport sector e.g. trial or pilot programs. The Norwegian Research Council runs a funding program called RENERGI with the objective of
Page 11 of 42 ensuring environmentally friendly and economic development of the energy
infrastructure, including transport solutions.
Industry position: Norway is or has been home to several EV related start-up
companies, among them the car manufacturers Think and Reva as well as the car sharing company MoveAbout. Unfortunately Think has not yet been able to restart production after its latest bankruptcy in 2011. Furthermore Norway has active industry associations around electric vehicles that strongly support further developments.
Nordic comparison
Looking at the overall Nordic perspective it becomes apparent that there are large differences in how the countries try to support the deployment of electric
powertrains. Especially striking is the significant policy gap that exists in Sweden where the government set the goal of achieving a fossil fuel free independent transport sector by 2030 as well as an industry vision of 600,000 BEVs and PHEVs by 2020, but few policies suggest such a development. Instead of deployment
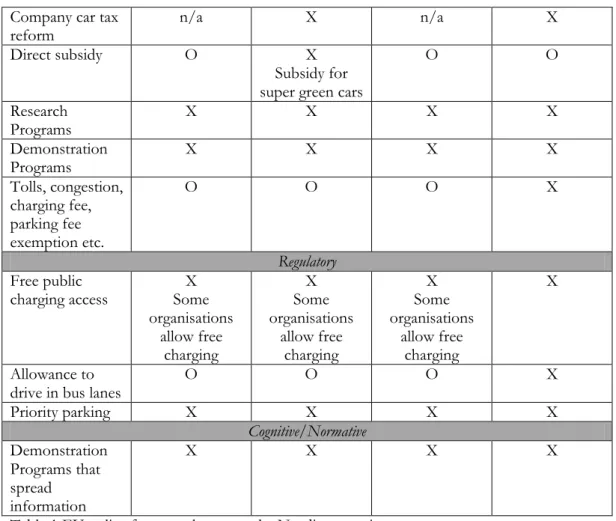
Sweden and to a lower extent also Finland have focussed on R&D, annual vehicle tax definition reform and demonstration projects but have not yet made the link to actual deployment of electric vehicles. Norway and Denmark however have had a more entrepreneurial policy approach, through actively supporting new start-ups while at the same time giving generous tax exemptions to customers for market uptake. However, taking into account the slow renewal rate of vehicle fleets one can argue that in all countries the number of EVs on the street still lack behind the ambitious goals set forward. The table below summarises existing policy frameworks across the four countries in terms of economic, regulatory and cognitive/normative governance mechanisms (Nilsson, Hillman, & Magnusson, 2012).
Finland Sweden Denmark Norway
EV Targets (Gov. or Ind.) O No specific EV target X Industry: 600,000 O No specific EV target X Ind.: 100,000 - 200,000 by 2020 Currently registered BEVs and PHEVs
ca. 60 ca. 1000 ca. 1300 ca. 9200
Economic
VAT exemption O O O X
Norway exempts BEVs from the valued
added tax. Registration tax X The registration tax is adjusted according to CO2 emissions. O A registration
tax does not exist in Sweden. X BEVs are exempted from registration taxes. X BEVs are exempted from registration taxes. Annual vehicle tax reform X X X X
Page 12 of 42
Company car tax reform
n/a X n/a X
Direct subsidy O X
Subsidy for super green cars
O O Research Programs X X X X Demonstration Programs X X X X Tolls, congestion, charging fee, parking fee exemption etc. O O O X Regulatory Free public charging access X Some organisations allow free charging X Some organisations allow free charging X Some organisations allow free charging X Allowance to drive in bus lanes
O O O X Priority parking X X X X Cognitive/Normative Demonstration Programs that spread information X X X X
Table 1 EV policy frameworks across the Nordic countries
The range of policy measures result in different price tags across the Nordic
countries, which is exemplified here in Figure 5 Initial price comparison taking into account existing governance regimesby using the BEV Nissan Leaf and the fuel efficient diesel driven Golf BlueMotion 1.6 TDI (based on exchange rates from June 2012). The figure solely focuses on initial prices at the point of purchase and hence does not include operational costs or benefits. The price information is gathered from the OEMs websites and then combined with the policies that exist in the Nordic countries at the point of sale. It can be clearly seen that BEVs will have a hard time to compete in Finland and Sweden given current governance regimes. Even though the BEV is likely favourable in terms of operational costs it will be difficult to close the existing cost gap within a reasonable investment time frame.
Page 13 of 42
Page 14 of 42
3. Future policy drivers for an BEV&PHEV breakthrough
On the basis of existing EV policy targets and the related goal of the NORSTRAT project of investigating a carbon neutral power and transmission sector until 2050, this section will elaborate a general breakthrough scenario for strong EV uptake. With this we hope to contribute to an understanding of what an ambitious EV policy goal would actually mean in terms of policy instruments. While doing so we have gathered existing literature on policy instrument research in the transport sector or more specifically on hybrids or electric vehicles when available.
First, when analysing technology development and technology shifts it can be
valuable to adapt an evolutionary perspective of technical change. From such a point of view technology develops in technology cycles which can be started by a new “technological discontinuity” that challenges the old technology (Anderson & Tushman, 1990, p. 606). The period in which a new technology challenges the old technology can also be called an “era of ferment” in which different design options and reactions are triggered around the new technology (Anderson & Tushman, 1990, pp. 610–611; Pohl & Yarime, 2012, p. 3; Tushman & Anderson, 1986, p. 440). These options are also referred to as different “technology trajectories”. Eventually the era of ferment might end with a new dominant design which becomes the new industry standard since it is the only one that survives the competition for resources
(Anderson & Tushman, 1990, p. 613; Tushman & Anderson, 1986, pp. 441, 462). However, new technologies can also fail or have setbacks and it has to be kept in mind that the development of new technology does not necessarily take place in short time frames but rather necessitates a long term policy perspective (Wilson, 2012). This can be demonstrated by the fact that electric vehicles were first introduced around the end of the 19th century (Hoyer, 2008). Also, a new
technological discontinuity usually is not alone in challenging an old technology, but itself has many competitors. At the same time the old technology can react with a strong “sailing ship effect” in the sense that it improves while it is being challenged (Pohl & Yarime, 2012, p. 3). Overall the technology cycle cannot just be seen from the technology perspective as such but also has to take into account the overall sociotechnical perspective. The reason for this is that the eventual definition of a new dominant design or technology regime is at least as much shaped by technological, market, legal, social factors as well as normative and cognitive frames (Anderson & Tushman, 1990, p. 617; Arentsen, Kemp, & Luiten, 2002, p. 61; Hughes, 1993; Tushman & Anderson, 1986, pp. 444, 462–463; G. Unruh & del Río, 2012, p. 233). The evolutionary point of view also stresses that technology usually develops incrementally over time since the development builds on past achievements, ideas and cumulative knowledge (Arentsen et al., 2002, p. 61). As such technology is developing along paths which are typically directed at system optimisation with reference to the current system logic (Arentsen et al., 2002, pp. 65, 67). Trying to change or influence this direction can be met with a lot of reluctance and prove rather difficult due to sunk investments in existing assets which are part of path dependencies (Arentsen et al., 2002, p. 65; G. C. Unruh, 2000). This again can be demonstrated how much resistance the Californian Zero Emissions Vehicle policy faced in the early 90s. Changing the system logic would be a system innovation
Page 15 of 42 which would satisfy a societal function in a way that is different from the current sociotechnical system (Arentsen et al., 2002, p. 65). More precisely it requires the use of new technology, new markets, new knowledge, new linkages, different rules and roles and major organisational change through e.g. new business models (Albrecht, 2011b; Arentsen et al., 2002, pp. 65, 67).
System innovation can be analytically divided into four different diffusion phases along the S-Curve introduced by Rogers, namely pre-development, take-off, acceleration and stabilization (Arentsen et al., 2002, p. 69; Rogers, 2003). Those different phases have important policy implications when one takes a look at the technology maturity level (Anna Bergek, Jacobsson, Carlsson, Lindmark, & Rickne, 2008, p. 407; Suurs, Hekkert, & Smits, 2009, p. 9640; van Alphen, Hekkert, & Turkenburg, 2010, p. 397).
One important debate in technology and innovation policy is also the question whether policies should be technology specific or general (Sandén & Azar, 2005). Much of that is related to the evolutionary perspective of nurturing both variation and selection (Arentsen et al., 2002, p. 74). From the selection point of view one can argue that technologies need specific policies which directly interfere into the
dynamics of technical change and try to make one path more attractive than others. This is especially necessary if one tries to achieve change on the scale of system innovation in a relatively short time frame. However these need to be embedded in generic or “technology neutral” policies, which develop a variety of technology options to be able to select from (Arentsen et al., 2002, p. 76). Both types of policies have its pros and cons and each will differ according to the technology at hand and the technology’s maturity level (Arentsen et al., 2002, p. 74; Anna Bergek &
Jacobsson, 2010). What is more important however is to give a long term and clear perspective as a meaningful context for industry and other actor’s investment decisions (Arentsen et al., 2002, p. 75).
To incorporate the mentioned multidimensional aspects, a technological innovation system (TIS) framework is being adopted which has its strengths in seeing innovation from a systems perspective surrounding the technology. The TIS framework has been adopted by major institutions such as the OECD, the European commission, UNIDO as well as different Nordic institutions such as the Nordic Council and the Swedish agency Vinnova (Anna Bergek et al., 2008, p. 407). In the literature a TIS is being defined as “[…] a network or networks of agents interacting in a specific technology area under a particular institutional infrastructure [e.g. norms and regulation] to generate, diffuse, and utilise technology.” (Carlsson & Stankiewicz, 1991, pp. 94, 111; Hekkert & Negro, 2009, p. 586; Jacobsson & Bergek, 2004, p. 817; van Alphen, Hekkert, & Turkenburg, 2010, p. 397). The TIS at its heart has a system structure which consists of actors, networks, institutions and artefacts (Anna Bergek et al., 2008, pp. 408, 413; Jacobsson & Bergek, 2004, p. 817; Jacobsson & Johnson, 2000, pp. 629–630). Apart from that several crucial system processes have been identified and modified over the past years (Hekkert & Negro, 2009, pp. 586–587; Jacobsson & Bergek, 2004, p. 818; van Alphen et al., 2010, p. 397). One recent version is namely consisting of entrepreneurial activities, knowledge development & knowledge
diffusion, positive external effects, resource mobilisation, guidance, market creation, creation of legitimacy and materialisation. Some of these interactive processes need to be addressed
Page 16 of 42 by e.g. policy makers at the same time in order to allow reinforcement, feedback mechanisms or complementary action. Also, these processes cannot be seen disconnected from the system structure and the spatial location of the TIS even if many supply chains are global today. Apart from that, these processes depend heavily on the stage of technology development according to the stages in the “S-Curve”. Looking at our selection of countries it is quite possible that e.g. Norway and Denmark are at a different phase of development for their national EV TIS and that e.g. in Sweden and Finland the TIS is still very much facing resistance from the incumbent TIS based around the ICE. After having set up those analytical categories the following paragraph will show policy options that have been identified as
potentially supporting an EV TIS. The main focus in the following paragraph will be on the mentioned system processes.
Entrepreneurial activities
Both Norway and Denmark have several companies that have been offering EVs as OEMs or offering EVs in a business model in the form of mobility services. In the case of automobile OEMs some new EV manufacturers like “Think” have had mixed results which at least partly is due to the high entry barriers in the automotive industry (Pohl & Yarime, 2012, p. 5). Other start-up companies like Better Place, Clever and MoveAbout are slowly starting to become more economically viable. All in all it is essential to make resources (not just monetary) and knowledge (venturing process, lawyers, marketing etc.) available for entrepreneurs (Berggren & Silver, 2010, p. 241; Lerner & Tåg, 2012, p. 5). This will help to mitigate the real or perceived risks involved of being an entrepreneur and perhaps leaving a secure job (Wüstenhagen & Menichetti, 2012, p. 3). Hence it is necessary to not design innovation policy
instruments only with the known and established actors in mind but also to account for actors that don’t yet exist or for those that are too small to organise their interests (Albrecht, 2011a, pp. 13–14; 17).
In a breakthrough scenario it is vital to overcome path dependencies often inherent when dealing with established actors and technologies (G. Unruh & del Río, 2012; Wüstenhagen & Menichetti, 2012, p. 5). This makes entrepreneurs that challenge existing technology trajectories a key stepping stone and there needs to be a good balance between policies supporting entrepreneurs and incumbents (as e.g. in R&D support) (Wüstenhagen & Menichetti, 2012, p. 6). Also in an early stage of
technological development, as is the case with electric cars and lithium ion batteries, start-ups and entrepreneurs are essential for experimenting around the new
technology options and probing ways to commercialise new knowledge (Audretsch, Heblich, Falck, & Lederer, 2011; Anna Bergek, 2012, p. 212; Lerner, 2010, p. 258). Without commercialisation and finding functioning business models new
technologies will not have any value (Teece, 1986, 2006, 2010). This function should receive special attention in countries with “big business” bias like it has been in parts historically found in e.g. Sweden (Eliasson, 2009; Hockerts & Wüstenhagen, 2010, p. 490; Jakobsson, 2011). Building up an entrepreneurial environment is essentially also a long term process that requires patience – much in the same way as it can take
Page 17 of 42 several years to find a working business model (Jakobsson, 2011; Lerner, 2010, p. 262). Some breakthrough recommendations for this system process hence include:
• Inclusion of entrepreneurial firms in existing government funded R&D, pilot and demonstration programs.
• Matching funds and loans for new business ventures.
• Incubator parks, shared office space, shared testing facilities (like e.g. Innovatum or TSS in Sweden) should be more directly supported and increased where reasonable (Anna Bergek & Norrman, 2008).
• Legal and business developing support is perhaps even more important than monetary support for some entrepreneurs as they might lack the necessary business skills and network capital.
• A venture capital fund that is initially matched by government funds could be an interesting instrument if there is a lack of start-up finance in the EV sector (Lerner, 2010, pp. 259–264). This has been successfully practised in countries like Israel and New Zealand to get investors interest and reduce some of the risk connected to high tech start-ups.
• Effective evaluation of supported entrepreneurs much in a similar way that is practised by venture capitalists.
Knowledge development & knowledge diffusion
Universities, research networks, pilot projects and demonstration projects are essential to build up the knowledge base in the early stage TIS. On a global level public funded research, development and demonstration spending on EVs and PHEVs increased from USD 265 million in 2003 to USD 1.6 billion in 2010 (Fulton, 2011). There have been several European wide programs of that kind financed by e.g. the European Investment Bank (EIB) and the EU’s Seventh Research
Framework Programme (FP7) as well as several Interreg programs between countries (Kampman, Essen, et al., 2011, pp. 83–84). Also in the Nordic national context several public-private pilot and demonstration projects have been and are still on going. Due to the fact that there are still important research efforts to be made when it comes to e.g. battery development or business models there is a need to keep up such programs at least in the coming 5-10 years (Fulton, 2011).
Also, networks created through research and demonstration programs can help to build up a national or Nordic knowledge base (Lewald, 2011). This in turn helps creating RD&D partnerships, industrial partner investments and good practice exchange.
Positive external effects
Through developing a knowledge base and knowledge networks, supporting
entrepreneurs and similar measures, opportunities are created that lead to knowledge spill overs in and between industries (A. Bergek, Jacobsson, & Sandén, 2008; Lerner & Tåg, 2012, p. 4). These opportunities can be seized by entrepreneurs that can combine this knowledge in a new way. This in turn nurtures positive feedback cycles and helps the industry and the economy to grow. Also those feedbacks will force incumbents to reconsider their own strategic position in the industry and its value
Page 18 of 42 chain (Hockerts & Wüstenhagen, 2010). Creating positive externalities that cannot entirely covered by patents is also an argument for the government giving matching funds and subsidies for start-ups and demonstration projects.
Resource mobilisation
Developing EV drivetrains and infrastructure has usually been helped by
governments with R&D support. Having public research programmes that sponsor 25-50 % of research efforts made by companies in this area actively encourages OEMs to invest in drivetrain or battery development (Kampman, Braat, et al., 2011, p. 20). Similar efforts have been and can be done to provide matching funds for other pilot and demonstration projects.
It is also interesting that in the case of Sweden industrial partnerships have been established to push and commercialise the PHEV technology (Albrecht, 2011b). In this case Volvo and Vattenfall together financed the development, making Vattenfall one of the few utilities that directly invested in EV technology (Frieser, 2011). An interesting option is to more strongly support venture capital funds in general or start new funds where public funds would only be used in the beginning to attract further investors to the fund. This could be especially important in light of the on-going consequences of the financial crisis and due the heavy reliance of regional SMEs on traditional bank loans (Berggren & Silver, 2010, pp. 236, 239). In Sweden it has been shown that it is a general problem to generate spin offs from university research in more regional areas, particularly in the case of knowledge intensive SMEs (Berggren & Silver, 2010, p. 241).
Guidance
Across the globe several national development plans and road maps for EVs do exist. If all of those would be achieved 1.5 million PHEVs/EVs would be sold by 2015 and 7 million by 2020 (IEA, 2011, p. 17). OEMs have so far not the same level of production capacity that would be necessary to reach those targets (IEA, 2011, p. 22). Overall there is a need for national and supranational roadmaps and
coordination that specifies goals in the national or e.g. Nordic context. Regional and local authorities need to translate those national goals into concrete local goals. Apart from national roadmaps an important issue with new technology is
standardisation. This on the other hand limits the extent to which entrepreneurs can experiment with the new technology and it could also represent an entry barrier. However common plug and charging standards are also a crucial element for a further breakthrough of EVs as different standards create disincentives (Brown, Pyke, & Steenhof, 2010). A European wide standard is expected for 2012 but globally not before 2017 (Kampman, Essen, et al., 2011, pp. 80–81). In this area perhaps a common Nordic standard would be a good start for further market uptake. In a similar vein it is necessary to reform current fuel standards in the European Union since the increasing availability of alternative fuels misguides customers. Hence harmonized accounting and assessment methodologies are needed to understand the well-to-wheel emissions of EVs compared to other technologies
Page 19 of 42 (Kampman, Essen, et al., 2011, p. 63). Similarly common efficiency or energy
consumption standards could be used. Harder regulations on average fleet
performance will force car manufacturers to get EVs onto the market, perhaps by having conventional vehicles subsidise new ones. Using such standards in common labelling schemes hence would be the next step to not only improve information on CO2 per km but also costs per km (Kågesson, 2010, p. 122; Wüstenhagen &
Sammer, 2007). What is of utmost importance when dealing with new technologies is also to create a long term policy environment that reduces risks and manages
expectations for companies and investors (Albrecht, 2011a, p. 18; Kågesson, 2010, pp. 91–92; Wüstenhagen & Menichetti, 2012, p. 5).
Market creation
As we have seen in Figure 5, a mid-sized EV’s initial investment is still substantially larger than the average mid-sized ICE. The higher initial investment cost of EV technologies as compared with conventional ICEs suggests that currently market creation is still a key barrier in the technological innovation system, and that a policy framework must include an arsenal of long term and short term economic incentives to bring down the initial cost.
Recent studies focussing on total cost of ownership and learning curves have shown that without strong policy support it can take several years and possibly decades until PHEVs and BEVs will break even with HEVs or ICEs (Ernst et al., 2011, pp. 5880– 5881; Karplus, Paltsev, & Reilly, 2010, p. 640; Pasaoglu, Honselaar, & Thiel, 2012, pp. 418–419; Thiel, Perujo, & Mercier, 2010; van Vliet, Brouwer, Kuramochi, van den Broek, & Faaij, 2011, p. 2308; Weiss et al., 2012, p. 11). Those studies however have mostly been conducted in countries like Germany, the Netherlands, USA, and Japan or have taken the EU average, which results in lower initial tax levels when it comes to general car ownership as compared to countries with high registration taxes like Norway or Denmark. Also such studies have some inherent uncertainties when it comes to battery price development, battery densities, the choice of battery
technologies as well as the future electricity and oil prices. Furthermore, in such studies, the operational cost advantages of an EV like e.g. lower fuel costs, lower maintenance costs and lower insurance costs are more difficult to capture and hence an important aspect of EV ownership is being missed (Kampman, Braat, et al., 2011, p. 11). In that context one major problem is that customers are reluctant to take into account the total cost of ownership over a longer time frame and typically expect a payback within 3-5 years (IEA, 2011; Kampman, Braat, et al., 2011, p. 25; Kågesson, 2010, p. 35).
In theory the needed economic incentives can be given before, during or after purchase, they can be designed as a one time or recurring payment and they can be technology neutral or technology specific (Kley et al., 2010, pp. 5–6). Recently several economic incentives have been applied throughout Europe, among them tax
reduction on sales price, tax reduction after purchase, pure subsidy, scrapping
scheme, feebate system, reduction of annual vehicle tax, reduction of registration tax, increased fossil fuel tax, differentiated congestion charges and parking fees, joint or public procurement, subsidies for installing charging infrastructure, quotas for OEMs
Page 20 of 42 or CO2 certificates (Kampman, Essen, et al., 2011, pp. 72–75; Kampman, Braat, et al., 2011, p. 18; Kley et al., 2010, p. 2).
Among those incentives, the literature suggests that direct tax reductions are effective, more practical and more appreciated than other instruments by the customer if they are applied at the time of purchase and if directed at the customers instead of subsidizing car dealers (de Haan, Peters, & Scholz, 2007, pp. 1083–1084; Diamond, 2009, p. 982; Kley et al., 2010, p. 6; Nemry et al., 2009, p. xi–xii; 21). These would be e.g. a reduction of the registration taxes and/or VAT taxes as is e.g. applied in Norway and partly in Denmark. Similarly, direct subsidies instead of tax reductions are also valued by the customers but the practicality depends a lot on the system that is used. Feebate or bonus malus systems are also accepted by the customers but here success depends a lot upon how the system is set up (Nemry et al., 2009, p. 71; Wüstenhagen & Sammer, 2007). For example if the feebate system is set up stepwise instead of a gradual linear system, important improvement
possibilities will be missed (Kågesson, 2010, pp. 87, 92–93). Likewise, the pivot point of the feebate system should be sufficiently low. The overall problem however is that these sort of incentives also potentially favour high income groups in society which can or could have bought more expensive environmentally friendly cars anyway (Chandra, Gulati, & Kandlikar, 2010, p. 93; Diamond, 2009, p. 982; Schweinfurth, 2009, p. 5). However, if for climate reasons, increasing market share rapidly is the primary goal asked for the free rider potential might be a necessary risk.
Tax rebates after the purchase for deduction in income tax or the reduction of the yearly vehicle tax have been found to be less effective or less practical for customers (Kley et al., 2010). One of the reasons for this is again that consumers are taking operational costs less into account and that the yearly vehicle tax is relatively low in most countries. However it has been shown that the gas price which is connected to the level of fuel taxes had a large impact on e.g. hybrid sales in the USA (Diamond, 2009, p. 982). Through modelling higher fuel taxes it has also been shown that this increases shares of HEVs and BEVs as well as reducing or at least stabilizing total car fleet size (Kloess & Müller, 2011, pp. 5059–5060). CO2 based fuel and yearly vehicle taxes have also some published successes (Rogan, Dennehy, Daly, Howley, & Ó Gallachóir, 2011, p. 597).
Having exemptions or reductions for congestion charges, road and ferry tolls, road pricing and parking fees has also proved to be a useful economic instrument in e.g. London, Stockholm and in major municipalities in Norway (Börjesson, Eliasson, Hugosson, & Brundell-Freij, 2012; Kampman, Essen, et al., 2011, p. 85).
In line with tough climate goals a one-time scrapping scheme could also be considered in order to accelerate the replacement of the current vehicle fleet (“scrappage for replacement”) (Kågesson, 2010, p. 101; Nemry et al., 2009, p. xii– xiii). This could be necessary since e.g. in Sweden almost 50% of the vehicle fleet’s emission are caused by cars that are ten years and older (Nemry et al., 2009, p. 22; SCB, 2012). A recent review of scrapping schemes showed that overall old cars were traded in with smaller more fuel efficient vehicles (Schweinfurth, 2009, pp. 4–5). However one has to keep in mind the emissions during other life stages of a car (Nemry et al., 2009, p. 34). It is thus necessary to make sure that one of the primary
Page 21 of 42 conditions for scrapping schemes is that only highly environmentally cars are being used as the substitute (e.g. in line with the super green car definition in Sweden). In general it is important to realise that transport related economic instruments interact with each other and can be very dynamic when combined and in turn have significant impact on the willingness to pay of consumers (Mandell, 2009). For example an increased fuel tax combined with an annual vehicle tax based on CO2 has a larger effect on willingness to buy than implemented each on their own. Also instruments will differ in terms of their short term and long term effectiveness. The economic instruments applied must be adaptable or reviewed according to learning curves when it comes to e.g. battery development. Policy makers need to closely monitor costs and technology developments and adapt policy schemes accordingly as economics of scale kick in (Kampman, Essen, et al., 2011, p. 56; Kampman, Braat, et al., 2011, p. 21). It should be argued that the instruments are phased out after EVs have reached a certain market share or when battery prices have reached a certain policy target. Also, subsidies can create rebound effects where total passenger transport increases which however could be, as mentioned before, regulated through road pricing and similar instruments (Kampman, Essen, et al., 2011, p. 74). It has also been shown that the rebound effect, at least within the transport sector, is not so significant as often suggested and is also limited by e.g. time constraints (Kågesson, 2010, pp. 112–114).
In all the four simplified stages of technology development government policies should consider taking into account the potential markets of such vehicles. This will ask the question of which specific market a policy is created for - much in the same way that companies differentiate their business model according to customers or markets (Dewald & Truffer, 2011; Wüstenhagen & Menichetti, 2012, p. 4). Examples for EVs here are different markets for private customers, public entities,
organisations with fleets and car pools and companies that typically lease cars. This differentiation is especially important in countries like e.g. Sweden where company cars make up more than 50% of new yearly car sales. Hence another important component in creating a market for EVs is different public or joint procurement initiatives. Here the procurement program by Stockholm City can be mentioned as an example which organised a joint procurement initiative for 6,000 EVs
(Elbilsupphandling.se, 2011).
Based on the information gathered we conclude that a breakthrough scenario which tries to achieve very ambitious goals, the following arsenal of instruments can be applied:
• In line with other environmentally friendly cars PHEVs and BEVs could benefit from a reduced or exempted VAT. This would put technologies that are still at an early market stage near established technology in terms of initial price. A reduction or exemption of VAT has been found an effective instrument for the introduction of new automotive technologies.
• Instead of a VAT exemption a feebate (or bonus malus) system with an ambitious pivot point like e.g. 95 g CO2 per km that gradually moves towards e.g. 50 g CO2 per km during a 5-10 year time frame is an effective option (Nemry et al.,
Page 22 of 42 2009, p. xi, 54). The argument to use this policy is that it is a “cheaper” option for the government since it is potentially revenue neutral. Furthermore it is also technology neutral and provides a long term investment environment.
• Scrapping scheme for cars that are older than 10 years in order to accelerate the replacement of the existing car fleet. The new car should at least manage 50 g CO2 per km (which is in line with the current super green car rebate in Sweden) or a similar threshold according to a well to wheel calculation. In order to avoid free riders a number of preconditions should be established. The incentive should not be major monetary wise, but rather a complement to e.g. an existing feebate system (the ad hoc programmes after the financial crisis were around 3000 Euro) (Schweinfurth, 2009). The scrapping scheme could also be used to support other CO2 low transport modes through vouchers for cycling, train travel or collective transport. This would also help to reduce total vehicle fleet size. Similarly it has to be evaluated if upgrading old vehicles with new
technology would be possible. EVAdapt in Sweden is a company that offers such services.
• Even though it is less accepted politically, increasing the fuel tax and annual vehicle tax (based on CO2 content of the fuel) has been found effective. This could also include a minimum price tag so that entrepreneurs can count on a minimum gasoline price for their business models. Such an increase in prices should be phased in gradually.
• The introduction of congestion charges in major cities that also reflect CO2 emissions in the cars lifecycle will be an effective mechanism to improve local environmental conditions in cities, but also provides the option of mitigating rebound effects.
• A compulsory labelling scheme that shows cost per km as well as CO2 per km based on e.g. a well to wheel lifecycle could be an improvement to existing labelling schemes. A study focussing on hybrid sales in Switzerland has shown that labels affect automotive purchase decisions (Wüstenhagen & Sammer, 2007).
• If higher fuel taxes and other mentioned incentives are implemented, lower taxes for low income groups (e.g. income tax) should be implemented to not
disproportionately harm vulnerable groups in society.
Creation of legitimacy
Arguably public acceptance and legitimacy is still a huge problem when it comes to this technology trajectory since misunderstanding and misinformation is common both in terms of what EVs can achieve and what they cannot achieve given current technology performance. This requires more information campaigns and possibilities to come into contact with the new technology in e.g. trial programs.
A general problem in this regard is also the fact that most customers don’t consider total cost of ownership when they are purchasing a vehicle (Kampman, Braat, et al., 2011, pp. 25, 29). Hence governments should guide customers by introducing clear labels that take into account the total cost of ownership.
Also the electrification of transport is highly dependent on decarbonisation strategies in the power sector (R. T. Doucette & McCulloch, 2011; Reed T. Doucette &
McCulloch, 2011). Only this will give it the legitimacy and acceptance the electric vehicle needs in the long term.
Page 23 of 42 Supporting a breakthrough in PHEV and BEV technology can only be one of several measures needed in the transport sector to reach the climate targets. An important factor is also the support of other transport alternatives and modes as well as behavioural changes (Anable, Brand, Tran, & Eyre, 2012; Cuenot, Fulton, & Staub, 2012).
Materialisation
Materialisation addresses the development of the physical products, factories and infrastructure (A. Bergek et al., 2008, p. 578; Hellsmark & Jacobsson, 2008). Here crucial elements also are demonstration projects, pilot projects and R&D programs that provide matching funds for developing the physical infrastructure that is needed. Institutional alignment is also needed to facilitate the charging infrastructure for PHEVs and BEVs.
4. Results and conclusion
Looking at the current policy measures and ambitions in the Nordic countries it is interesting to acknowledge that it has not been Sweden as the country with the largest automotive industry and the goal of a fossil fuel free transport that engaged most aggressively with the BEV/PHEV technology. Instead countries like Norway and Denmark are leading policy developments and have also been home to some of the most innovative business models in the area. This seems to strengthen the idea of path dependencies inherent in the arena of policy, industry and other parts of socio-technical systems (Hughes, 1993; G. C. Unruh, 2000; G. Unruh & del Río, 2012). Industry in Sweden while in-house engaging with electrified powertrains has been cautious about the right moment to commercialise the technology (Konnberg, 2011). This is partly explained by the fact that it requires considerable investment to create new vehicle platforms while at the same time receiving ambivalent policy signals about long term support mechanisms and having sunk investments in existing vehicle platforms.
What is also apparent is that the most successful country in terms of EV deployment, Norway, is the country that uses the full arsenal of governance mechanisms
(economic, regulatory and cognitive/normative) and has guaranteed this policy framework at least until 2017 (Nilsson et al., 2012). The difference becomes more apparent between Denmark and Norway which both have very strong economic incentives when it comes to initial investment as can be seen in Figure 5. However Norway facilitates day to day EV usage much more through operational economic incentives and regulatory measures that are in place. This saves time and money in operation on top of the favourable initial investment incentives. Denmark might not yet have the high EV sales that were originally anticipated, but it has done important groundwork, especially when it comes to charging infrastructure, cognitive
prerequisites (largest EV trial programme in Europe) and initial investment
incentives. Finland, at this stage, has not yet prioritised EV deployment even though it does have the necessary industrial base that participates in EV technological innovation systems in other countries, including other Nordic countries.
Page 24 of 42 Although electric vehicles may give a significant contribution to emission reductions of up to 15% until 2030, it is clear that many other changes will also be needed to reach sustainable urban transport systems (Åkerman, 2012). For instance, an increased share for cycling and (electrified) public transport will be needed in cities. These modes of transport have even lower energy use than electric cars and are more space efficient.
To reach the existing ambitious climate goals in the transport sector a number of general breakthrough policy recommendations for BEVs/PHEVs have been given in this report. To implement those policies some of the Nordic governments have to shift from path dependent, incremental change type of policies towards
entrepreneurial policies. This includes both support to start-ups, incumbents on the OEM side but also a clear long term as well as short term policy arsenal to take into account the different development phases of a TIS according to the S-Curve. In this regard it seems prudent to also differentiate between governance mechanisms that interfere at the initial purchase decision and mechanisms that focus on day to day operational usage of an EV.
To accelerate developments it seems timely, effective and economic for governments to implement a feebate system. That system could have a pivot point of 95 g CO2 per km that gradually moves towards 50g CO2 per km until 2020 at the latest. On top of that a scrappage scheme is an interesting option that would accelerate vehicle fleet renewal. This should be done upon ambitious g CO2/km requirements like e.g. 50g CO2/km which is in line with the Swedish super green car incentive. Instead of trading the old car for a new car the scheme could also be used to obtain a voucher for collective transport usage, train travel, technology upgrade of the old car, or the purchase of bicycles. While the feebate system would be the long term, and
technology neutral policy signal it is very likely that electric vehicle power trains will also need a short to midterm dedicated policy incentive like e.g. a direct subsidy. To supplement the economic instruments and raising awareness of the total cost of ownership of a car, labelling schemes should be compulsory (with information on CO2 emissions as well as estimated cost per km).