Syria-EU Bilateral Trade Relation
An empirical analysis of the changes in export demand between 2006
and 2009
Bachelor’s thesis within Economics
Author: Ahmad Mahmoud 830728-0993 Tutor: Professor Börje Johansson
Bachelor Thesis in Economics
Title: Syria-EU Bilateral Trade Relation-An empirical analysis on the changes in export demand between 2006-2009
Author: Ahmad Mahmoud
Tutor: Professor Börje Johansson and PH.D. Candidate Özge Öner
Date: May 2012
Subject terms: Gravity model, Syria bilateral trade, EU-27, Oil, Economic down- turn
Abstract
This study explores the impact of economic downturn in the EU-27 on Syrian trade and the sensitivity of oil and petroleum products to this downturn. This is carried out using a derivation of the gravity model to determine the export demand. Syrian export with its top 30 trading partners as well as the EU-27 are taken into consideration along with various other trade determinants when measuring the changes in total export volume. The study finds that EU-27 is an important source of demand for Syria, but a downturn in the EU economy will not necessarily have a detrimental effect on Syrian economy. On the other hand, oil plays a far more important role on the country’s exports and its demand is less sensitive to economic fluctuations.
Acknowledgements
Firstly, I would like to thank my tutors Professor Börje Johansson and Ph.D. Candidate Özge Öner for their assistance throughout the writing process.
Secondly, I would also like to thank my lovely wife Lujain Aboud for supporting and encouraging me at all good and bad times. Finally to my parents in Syria, they were always supporting me with their best wishes.
Table of Contents
1 Introduction ... 1
1.1 Purpose ... 2
1.2 Historical Background ... 3
1.3 Financial Crises and the role of oil... 4
2 Theoretical Background ... 5
2.1 Trade Theory ... 5
2.2 The Gravity Model ... 6
2.4 Trade Affinities... 7
3 Empirical Analysis ... 9
3.1 Variable selection: ... 9 3.2 Hypotheses... 11 3.3 Empirical Models ... 11 3.4 Descriptive Statistics... 12 3.5 Regression Results... 13 3.6 Analysis ... 144 Conclusion ... 18
List of references ... 19
Data sources: ... 21
Figures
Figure 1-1: Syria trade as percent of GDP………...1 Figure 2.1: A sequence of transaction barriers over various distance…….8
Tables
Table 3.1: Descriptive Statistics 2006-2009……….…..12 Table 3.2: Regressiones results Syrian export all commodities included oil and Non-oil………13
Appendix
Appendix 1: Test for Multicollinearity...21 Appendix 2: Test for Heteroscedasticity……….22 Appendix 3: Test for Normalisation……….22 Appendix 4: List of EU-27 Countries and Syria 30’S main trading part-ners...23 Appendix 5: Commodity groups in SITC 1-digit...25
Tables in Appendix
Table A1: collinearity statistics ……….………..….21 Table A2: White`s Test for Heteroscedasticity….……….……….……22 Table A5: Commodity groups in SITC 1-digit ………24
1 Introduction
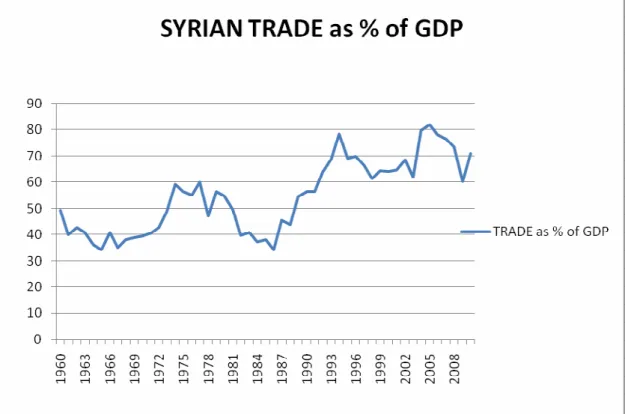
Income from trade accounts for about 70% of Syrian GDP (World Development Indica-tors, 2010) making the country highly dependent on trade with the rest of the world. For decades, well over a quarter of Syria’s trade flow (both imports and exports) has been with the European Union. About 22.5% of Syria's exports is channeled to the EU-27 and consists mostly of petrochemicals, agricultural goods and textiles1. About 30% of the country's imports come from the EU, consisting of transport technology, machinery, etc (EU Commission 2012). Thus, the EU is by far Syria’s largest trading partner, mak-ing the country’s economy mostly dependent on the EU-Syrian trade relations. This means, any fluctuations in the European economy could have a direct and immediate ef-fect on trade with Syria.
Figure 1.1 Source: World Development Indicators, 2012
Thanks to its strategic location, Syria has historically been a bridge between East and West. Thus trade with the outside world has always been an important attribute of the country’s wealth. Since its independence from France in 1947, Syria experienced severe fluctuations in its economy because of changes in its economic structure from planned economy and major trade barriers to now a much freer market economy and trade
alisation (Lucke and Bernd, 2001). The positive impacts of trade liberalisation as re-flected by the rapid GDP growth ever since highlights the important role of trade. Given the current world economic recession, the Euro crisis and the political disputes between Syria and the West, it is a crucial and an interesting time to carry out an em-pirical investigation for the changes in the trade patterns between Syria and the EU. The most important Syria-EU trade component is the trade of petroleum and petroleum-products. For instance, in 2006 29.1% of Syria’s total exports went to EU-27. Out of this, 88.5% were petroleum and petroleum products. The figures were similarly high for the year 2009, even though the EU-27 was in the midst of a recession that year. There-fore, the trade of petroleum products appear to be less sensitive to economic fluctua-tions.
The total export volume in the crisis year of 2009 was a little over 12 percent lower than that of 2006. With that in mind, this paper uses the gravity model (export demand equa-tion) to test the changes in export between Syria to EU-27 for the years 2006 and 2009, compared to export between Syria and its other top 30 trading partners, with the aim to investigate the susceptibility of Syrian trade to economic fluctuations in the EU-27. The paper also tests whether the importance and sensitivity of petroleum and petroleum products on Syrian trade with the EU-27 are significantly different than the situation with other commodities. That is, if the trade of petroleum products are not significantly affected by a downturn in the EU-27 economy, the Syrian export flow to the EU will not be adversely affected as long as petroleum products continue to have the largest share of Syrian export to the EU-27. And since EU is Syria’s largest trade partner, this would imply that economic fluctuations in the EU-27 would not necessarily have a sig-nificant impact on Syrian export.
The model includes GDP for EU-27 and its other trading partners as well as the distance between them. Additionally, petroleum and its products will be used as a dummy vari-able to test its significance on total export. The impact of GDP on the bilateral trade flow is expected to be positive. Distance is expected to be a resistance factor with a negative influence on trade flows because as distance increases so do transport costs. Due to the above mentioned arguments regarding the role of petroleum and petroleum products, its influence on trade flows is expected to be positive.
The findings of this paper suggest that although EU-27 is an important export market for Syria, its fluctuations did not severely impact the Syrian economy. Moreover, oil, as predicted is a very important export commodity and its trade is less sensitive to ecnomic fluctuations.
1.1 Purpose
The aim of this study is threefolds. First, it explores the impact of economic downturn in the EU-27 on Syrian export. Second, it tests the sensitivity of oil and petroleum prod-ucts to this downturn. Finally, it investigates the impact of other trade affinities on ex-ports.
1.2 Historical Background
The current economic situation in Syria cannot be well understood without a glance at its history. As previously pointed out, the country was a French colony until 1947, thus its trade patterns until that time were related to the coloniser’s policies. After independ-ence, Syria experienced political instability, which inevitably meant that its economy performed below its potential. After several military coups, political and economic sta-bility was finally brought to Syria when the former president Hafez al-Assad came to power. Despite stability, the economy suffered under Assad’s regime that implemented an inefficient planned economy and political disputes with the region and the west, which continuously placed sanctions on Syria, which hurt its trade (Hinnebusch 2007). However, in 2001, after Bashar al-Assad was appointed the new president, the economy slowly took a positive turn. This was because of introducing various economic reforms among which were shifting to market economy, trade liberalisation and a gradual im-provement of political relations. This was the picture until the political upheaval against president Bashar al-Assad that began early 2011 and continues until the present day, thus the country once again faces political social and economic instability. It is also important to note that Syria is highly dependent on oil exports as a source of income. As depicted in the descriptive statistics part of this study, vast majority of Syria’s exports to the EU (about 90 per cent) consist of some sort of oil products. The remaining produc-tions (and exports) are composed of agricultural and other primary goods. Addiotnally, the country is highly dependent on imports and most of their import from the EU-27 is machinery and other capital- intensive goods. Syria trades heavily with Iraq, Lebanon, and other neighbours, as well as with Russia and now increasingly with China.
There are many studies done on trade flow patterns that apply the gravity model. A per-tinent study by Martinez-Zarzoso and Nowak Lehmann (2001) applies an augmented gravity model to find the important determinants of trade patterns and what forecasts trade potential between EU and the South American trade bloc Mercosur and Chile. The study finds that as expected and exporter-importer income has a positive effect on trade potential. Moreover, importer population also shows a significant positive relation to trade flow, whereas exporter population size has a significantly negative effect implying absorption effects. Finally, the authors also test the level of infrastructure on trade flow and find that only infrastructure of the exporting countries (i.e. Mercosur and Chile) has a positive correlation to trade flow. One of the aims of this thesis is to see if EU GDP also plays a positive role on trade relations with Syria. Although the thesis does not make infrastructure and population the center of focus, it is important to point out that studies about the EU have shown that it can play an important role and may be a limita-tion of the study.
One possible explanation for why the bilateral trade between Syria and EU-27 is so large is that intra-Arab trade (Syria’s neighboring trade partners or potential partners) is below its potential. An IMF study by Al-Atrash and Yousef (2000) gives evidence to-wards this using the gravity model. They find that Some reasons the authors offer as to why intra-Arab trade volumes are low include policy related barriers such as high tariff rates, political disputes, and other irreversible causes such as the lack of product com-plementarity (Al-Atrash and Yousef, 2000). The authors suggest that further trade
liber-alisation as well as increased regional integration is some solutions to boost intra-Arab trade. One can then argue that this would be highly welfare improving for Syria.
1.3 Financial Crises and the role of oil
Economic crisis is the point on the business cycle characterised by contracting eco-nomic activity at all levels including lowered levels of demand, employment, prices, in-vestment and trade. A crisis can be triggered for many reasons, among the most com-mon causes is the financial sector, which has become more frequent with the develop-ment and increased importance and global integration of the sector. If this is the case, it is referred to as a financial crisis, where financial assets and institutions experience rapid drops in their values. Investors tend to withdraw or sell assets in the fear that fur-ther losses in value are due. This usually exacerbates the crisis. Financial crises come about due to irresponsible investor behaviour such as overvaluing certain assets or com-panies and making decisions based on predictions. In an ever more globalised world where nations are heavily linked by trade, it is common that a crisis in one place will be carried to another, especially if the suffering country is a major export market of an-other. Naude (2009) for instance, argues that developing countries trading with those economies of the West experiencing a crisis will experience downturns in their econo-mies. For this reason, it is important to test for the impacts of the financial crisis experi-enced by the EU in 2008/9 on Syria. One way of measuring this impact is by testing its influence on the trade export, since as previously mentioned, EU-27 is Syria’s largest trade partner.
The extent to which a country or region is affected by a global crisis depends on the de-gree of its integration in the global capital market and its dependence for imports and exports on aboard. In a recent study on the impacts the current financial crisis (The Great Recession) on the Arab world, Brach and Loewe (2010) find that oil exporting countries experienced the highest drop in their GDP during 2008-2009 when the oil prices plummeted. Therefore they show that there is a positive correlation between vol-ume of oil exported and dependence on the fluctuation of the importer. The study shows that Syria, albeit a net exporter of energy commodities, imports and exports almost equal amounts of oil. During the Great Recession, Syria did not face as large a loss as other Arab countries partly because of the small oil dependence, but also because it does not hold significant amounts of foreign assets (IMF, 2009c, 2009d). In the case of Syria, the drop in GDP during the financial crisis was also due to drop in remittance payments from abroad, development assistance and FDI (Brach and Loewe, 2010).
In the remainder of the paper, section two will give a theoretical background to the topic. In section three, the methodology is presented and the results and the analysis are displayed. Section four provides the concluding remarks.
2 Theoretical Background
2.1 Trade Theory
Economists purport that countries are better off partaking in trade than attempting at self-sufficiency and there is substantial amount of economic theories regarding the im-portance of trade between countries and regions. Adam Smith was the first known economist to argue in his infamous ’Wealth of Nations’ that countries should produce goods which they can produce most efficiently than other countries – i.e. they should specialise in producing all goods for which they have an absolute advantage – and trade with others for all other goods (Dobb, 1975).
The shortcoming of Smith’s theory is that those countries with no absolute advantage are unaccounted for. David Ricardo built on Smith’s theory by introducing the concept of comparative advantage. He claimed that rather than producing what they are best at, welfare maximising nations should specialise in goods for which they have the lowest opportunity costs – i.e. they should specialise due to comparative advantage. In these theories, there are assumed to be two countries, two goods and one factor of production: labour. World output is maximised as long as both nations produce at the limits of their production possibility frontiers. World welfare is maximised because these nations will then trade with one another (Feenstra, 2004). Arguably, Syria has a comparative advan-tage in oil production since its oil resources that are relatively higher than other re-sources. Thus it can produce and export oil products cheaply relative to other goods. However, the world is a more complex system than what Smith and Recardo describe and thus there are more factors to consider, for instance, there are more production fac-tors involved than just labour. This is when Eli Heckscher and Bertil Ohlin’s break-through work comes in: the factor endowment trade model. Here they take the Ricardian trade model one step further to address the issue of multiple production factors by add-ing capital into the equation. The Heckscher-Ohlin model consists therefore of two goods, two countries, and two factors of production. The conclusions are similar to those of Ricardo and Smith, the main difference being that countries specialise in pro-duction depending on their resource endowments. The capital rich country will produce the capital-intensive good and export some of it to the country rich in labour producing the labour-intensive well. The capital rich country then imports the labour intensive good. (Leamer, 1995)
All these theories above assume, among other things, perfect competition, constant re-turns to scale and zero transport costs. In discussing international trade, these assump-tions don’t always hold, particularly the one about the absence of transport costs. Krugman challenges these assumptions by arguing that although the neo-classical theo-ries state that counttheo-ries trade because they are different, in reality, most trade takes place between economies that are in fact very similar in their resource endowments and com-parative/absolute advantage. In early 1980’s Krugman built the new trade theory where positive transport costs and the role of market imperfections (increasing returns to scale, trade barriers, etc) are introduced (Krugman, 1987). The new trade theory thus models the intra-industry trade between nations as a result of specialisation due to initial condi-tions and market imperfeccondi-tions that allow countries to specialise in and trade various goods. Krugman and others’ further work in the field goes on to include the role of
ge-ography and industrial organisation in patterns of production, specialisation and trade (Brakman, Garretsen & van Marrewijk 2009).
2.2 The Gravity Model
Although the new trade theory as well as the neo-classical theories build the foundation for why countries trade, they are unable to empirically quantify the volume of that trade between countries/regions. The gravity model of trade accomplishes just that.
The gravity model of trade stems from the Newtonian physical gravity law stating that two bodies are attracted to one another in proportion to the product of their body mass (kg) divided by the square of distance between their centres of gravity (metres) (Bald-win & Taglioni 2006).
Tinbergen (1962) and Pöyhönen (1963) adopt this model to explain the trade patterns between countries. In its simplest form, the model predicts that the volume of bilateral trade between two economic units is directly proportional to their size (as measured by GDP) and inversely proportional to the distance between them. The sending country GDP reflect how much country can produce, for the importing country, it reflects the demand of the imported products. However, distance is representing the cost as a result of transportation between countries.
The result is the basic model and can be written as follows:
Xij = β0Yiβ1 Yjβ2Dijβ3 (2.1)
Where:
β0 is a constant,
Xis the export between country i and country j
Yi and Yj are the GDP of countries i and j respectively,
Dij is the distance between the economic centres of country i and j, The model can be expressed linearly as:
Ln(Tin) = lnβ0+ β1ln(Yi) + β2ln(Yj) + β3ln(Dij) (2.2)
This basic model of gravity gives a good explanation of trade flow between countries, but most estimates of the model include additional dummy variables to examine their effects on trade, for instance sharing a common border and common language (Baier & Bergstrand, 2005).
The gravity model has been used extensively by economists to explain patterns of trade flows between regions and/or countries. Due to its many applications, the gravity model comes in many forms though the most important features as indicated in the above basic gravity equation are the same. That is to say, bilateral trade between two economies is always the dependent variable in question. Moreover, the size of the economy as meas-ured by GDP or GNP is always used and is said to have a positive correlation with trade (many empirical studies with the gravity show that larger economies tend to trade much
more in volume than smaller ones), while distance is the resistance factor that affects the trade volume negatively (Deardorff , 1998).
Despite its widespread use, the gravity approach has been criticized for various reasons. One main source of criticism is that it lacks solid theoretical backing (Anderson, 1979; Anderson & van Wincoop, 2003). This criticism has caused many economists not only to attempt to found new theories to explain it, but also attempt to apply the gravity model to existing theories, such as the above mentioned trade theories. Deardorff (1998) for instance, proves that the gravity model can result from the Hecksher Ohlin model of trade. Perhaps the most well known critic of the gravity model is the econo-mist Bergstrand (1985), who claims that the gravity model not only does not properly explain the trade patterns, but also that the approach is misspecified to begin with as it does not take into account the price variable, which plays a vital role in trade relations. Another – and perhaps the first – economist to provide theoretical backing to the gravity model is Linneman (1966). He links the foundations of the gravity model to the supply and demand of the exported goods. That is, he argues that the flow of trade between two economies can be explained by factors that indicate the total supply of the exporting country, the total potential demand of the importing country (both with positive impacts on trade) and distance, which is the resistence factor (Linnemann, 1966).
Note that bilateral trade flow can be measured using total trade, imports or exports de-pending on the line of study. Because the main purpose of this paper is to examine the changes in partner economic fluctuations on trade flow, it is most suitable here to use export values. This is because the amount exported depends on the size of demand from the trading partner, determined by the partner’s income level as measured by GDP. Changes in the business cycle lead to fluctuations in the income level that in turn reflect demand for imports from abroad. The same can apply when measuring the impact of specific goods such as oil on trade flow.
2.4 Trade Affinities
Trade affinities predict that countries that have similar characteristics are likely to have more economic relations with each other than with countries that are different, all else equal. These similarities include common language, culture, border, colonial ties, and infrastructure. Similar cultures are associated with more trust as well as demand for the same types of goods (Lazear 1997). Thus, the more similar countries or regions are, the more we expect their trade volumes to be. Historical or colonial ties also play a role in increasing trade. Eichengreen and Irwin (1998) argue that historical events such as trade between two countries due to colonialism can have a permanent impact on trade rela-tions that are unaltered by current economic shocks in the financial system. This is be-cause trade networks created are strengthened overtime and can be costly to establish anew.
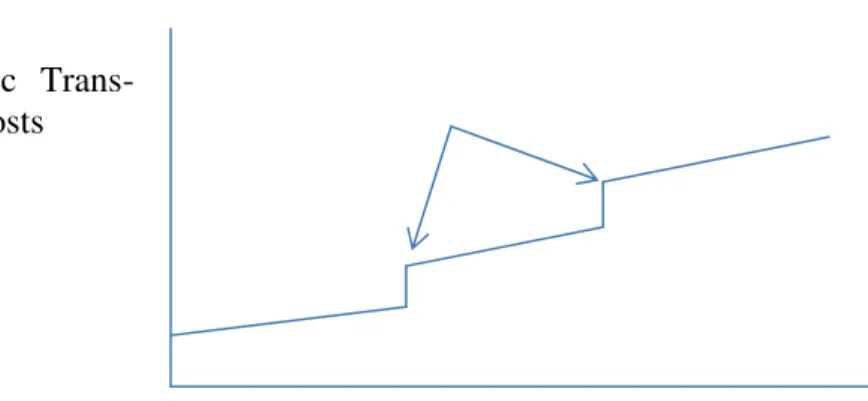
Finally, it is predicted that trade affinity is higher between countries that are neighbours. An aspect of trade affinities is transaction costs that include costs other than transport costs of goods traded. These are extra costs due to differences in culture, language and legal systems, that are incurred when trading, say when enforcing contracts (Hacker and Johansson, 2001).
Figure 2.1 shows that transaction costs do not increase evenly with distance, but can rise sharply at certain points, indicating the existence of factors other than distance that are a barrier to trade. Hacker and Johansson (2001) purport that transaction costs across two different borders of a country (roughly the same physical distance) can be very differ-ent. They attribute these to language, taxes, laws, and others. In this thesis we represent the role of affinity in trade volumes in the form of dummy variables and add it to the gravity model to be regressed. We expect that the higher the affinity between countries, the lower the transaction cost therefore the higher the volume of trade, cetris paribus.
Figure 2.1: A sequence of transaction barriers over various distances Source:Hacker and Johansson, 2001
Geographic Trans-paction Costs
Distance Transaktion barriers
3 Empirical Analysis
In this paper, we use cross sectional data to investigate the effects of economic crisis on Syrian export to EU-27 as well as trade with Syria’s 30 other top trading partners. We take 2008 as the year when the Great Recession hit the much of world including the EU-27. It is predicted that a decrease in the EU GDP due to economic crisis will reduce the Syria export to EU-27, as it is one of the main components of the gravity model that has a positive relationship with trade volume.
To test for the impact of trade, we run two regressions for each year, 2006 to see the ex-port patterns before the crisis and the same for year 2009 to test for any changes as a re-sult of the economic crisis in the EU-27. The first regression uses oil and petroleum products as a dummy in addition to all other commodities and variables (for both years). The second regression excludes oil and petroleum commodities, but categorises all other commodities to low, medium, and high value goods.
To better understand the importance of export to the EU-27 for Syria, also included in the gravity model were the following dummies whose roles will be explained in the next sections: oil trade, trade with EU-27, colonial ties, common border and common lan-guage.
3.1 Variable selection:
Export is the dependent variable. The data is collected from UN Comtrade, the export values from Syria to the 57 trading partners included in this study are measured in bil-lions of current US dollars.
The independent variables are:
Gross Domestic Product, GDP measures the total value of all goods and services pro-duced in an economy over a given time period. It is used as the main indicator of eco-nomic activity and a representation of income and purchasing power. Therefore, it is expected that GDP will have a positive impact on trade flow (Dornbusch, et al, 2008). GDP for country j will be used and the data is collected from World Development Indi-cators and it is measured in billions of current US dollars.
Distance is another main component of the model. It consists of both physical distance as represented by transportation costs and other trade impediments known as transaction costs (Brakman, et al). Distance is affinity factor meaning that the closer together trad-ing partners are, the more they are expected to trade. The distance is measured between the economic centres (usually the prime cities) of the trading partners. In the case of this thesis, it will be the distance between Damascus and the economic centres of each of the EU-27 countries (for instance, Paris in the case of France and Frankfurt in the case of Germany) as well as the economic centres of the 30 other major trading partners. Data for distance, as measured in thousands of kilometers is collected from CEPII2.
lan-Syria’s export to the EU-27, Syria to EU represents the export of Syria to all countries within EU-27. Although in 2006, the EU had only 25 members (excluding Bulgaria and Romania), the data for this thesis takes them into account for both years. This was done to ensure that they comparison of the trade between the two years would remain compa-rable.
The dummy variable will equal to 1 if the trading partner is one of EU-27, 0 otherwise. Oil is one of the main components of Syria’s exports (EU Commission, 2011); therefore the presence of the commodity is expected to have a positive impact on trade flows. The variable equals 1 when oil is traded and 0 otherwise.
Colonial ties are another dummy variable and an affinity factor. It is expected that trad-ing partners with colonial ties will trade more than those without it, all else equal. In this paper, the dummy variable will equal 1 if the country is France and 0 otherwise. This is because Syria was a French colony, thus it is expected that Syria should have higher trade relations with France than with other EU-27 countries and 30 major trading partner (Eichengreen and Irwin, 1998).Data is collected from CEPII.
Common Border This dummy variable equals to 1 if the trading partner shares a border with Syria and 0 otherwise. Because transport costs are expected to be lower when trad-ing with a bordertrad-ing country (due to close proximity), this factor is predicted to have a positive impact on trade flows (Hacker and Johansson, 2011). Data on common borders were obtained from CEPII.
Common Language is also a dummy a variable with a positive impact on trade flows. This is because having the same language reduces the costs of acquiring and retrieving information, making contracts, creating business contacts and other transaction costs as-sociated with language issues (Lazear, 1997). The variable equals to 1 if the trading partner shares the same language with Syria and 0 otherwise. Data about this dummy was obtained from CEPII.
Commodity Values These dummies categories all commodities exported into high, me-dium, and low values depending on their price per unit (e.g. $/kg). The commodities ranked in order of kilo-price. They are then divided into three groups by taking the 30th and 70th percentiles equal the low medium high value goods.
However, two dummies, low value and high value goods were created and the medium value was base line and not used as a dummy to avoid the dummy trap.
The purpose of these dummies is to simplify the categorisation of all goods that were exported, when attempting to understand their impacts on exports
Low value will equal 1 if the commodities are low and 0 otherwise, high value will equal one if the commodities are high and 0 otherwise.
3.2 Hypotheses
Hypothesis 1: Fluctuations in the EU-27 economy directly affect Syrian trade flow. That is, an economic downturn in the EU will have a significant, adverse effect Syrian export volumes.
Hypothesis 2: Oil is Syria’s most important export commodity and thus has a significant impact on the country’s total exports. Moreover, it is less sensitive to economic fluctua-tions, therefore, a downturn in the EU economy will not adversely affect its trade
3.3 Empirical Models
In this section, two log-linear regressions of export volume between Syria and EU-27 and its other top 30 trading partners against the above mentioned predictor variables were run. The regression 3.1, 3.2 look as follows:
Ln (Xij)= α+β1ln(GDPj) + β2ln(Dij) + β3(Syria to EU-27)+ β4(P)+ β5(Colij) + β6(Bij) +
β7(Lij) +εij (3.1).
Ln(Xij)= α+β1ln(GDPj) + β2ln(Dij) + β3(Syria to EU-27)+ β4(Colij) + β5(Bij) + β6(Lij) +
β7(low) + β8(high) + εij (3.2).
Where:
Xij export value from the exporter i Syria to importer j
α is a constant.
β is a measure of the elasticity of the dependent with respect to the independent vari-ables.
Gapis the level of gross domestic product for country j GDP. Dij is the distance between the economic centers of countries i and j.
Syria to EU-27 is a dummy variable assuming the value 1 if the partner j is one of the EU-27 and 0 otherwise.
P is a dummy variable assuming the value 1 if the commodity is petroleum and 0 oth-erwise.
Lij is a dummy variable that equal 1 if j and I share a common language and 0
other-wise.
Bij is a dummy variable assuming the value 1 if i and j share a common border and 0
C is a dummy variable assuming the value 1 if the country j has colonial ties with coun-try i and 0 otherwise.
Low value is a dummy variable assuming the value of 1 if the commodities are low value and 0 otherwise
High value is a dummy variable assuming the value of 1 if the commodities are high value and 0 otherwise
εij is an error term.
3.4 Descriptive Statistics
Table 3.1 below gives a first look at the dataset. The table provides some descriptive statistics of the selected regressors.
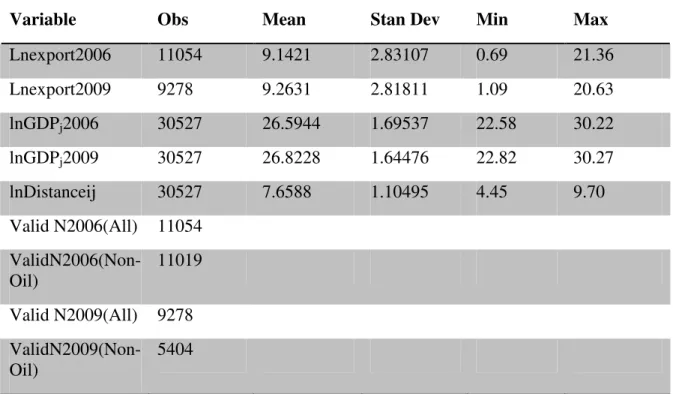
Table 3.1 Descriptive Statistics 2006-2009
Variable Obs Mean Stan Dev Min Max Lnexport2006 11054 9.1421 2.83107 0.69 21.36 Lnexport2009 9278 9.2631 2.81811 1.09 20.63 lnGDPj2006 30527 26.5944 1.69537 22.58 30.22 lnGDPj2009 30527 26.8228 1.64476 22.82 30.27 lnDistanceij 30527 7.6588 1.10495 4.45 9.70 Valid N2006(All) 11054 ValidN2006(Non-Oil) 11019 Valid N2009(All) 9278 ValidN2009(Non-Oil) 5404
As the Table 3.1 indicates, the mean values vary for the different regressors, but the standard deviations are very low, close to zero. The logged minima and maxima repre-sent the extreme values of the variables. For instance the the minimum value of 4.45 in-dicates the logged distance value between Damascus and Beirut, the capital city of Lebanon (Syria’s most nearby trading partner), while maximum value of 9.70 represents the logged distance between Damascus and Wellington, the capital of New Zealand, Syria’s most distant trading partner. By the same token, minimum and maximum GDP values represent Syria’s largest and smallest partner economies in 2006 and in 2009. For example, 22.82 and 30.27 represent the logged GDP of Jordan and the United States in 2009. The logged export values from Syria to its partners ranged from 0.69 to 21.36 in 2006 and from 1.09 to 20.63 in 2009. Note that the maximum export value from Syria to abroad fell between the two years.
3.5 Regression Results
This section presents the results obtained from the regressions 3.1 and 3.2 to determine whether or not the downturn of the EU-27 economy has a measurable impact on Syrian trade patterns. This is done by displaying the findings on the coefficients of the explana-tory variables mentioned above as well as presenting the various tests run on the data to verify their accuracy and significance. To ensure the accuracy of the regressions, vari-ous tests were performed on the models the results of which are indicated appendices 1, 2 and 3. There was no problem of multicollinearity. However, using the White test, het-eroscedasticity was detected. Moreover, there was the problem of normality. Appendi-ces 2 and 3 describe how these problems were remedied.
Finally, note that as indicated by table A5 in appendix 5, there were ten different cate-gories of commodities obtained from Comtrade. However, due to statistical purposes, trade flows disaggregated data were used. These were disaggregated to the five-digit level of Standard International Trade Classification (SITC) system.
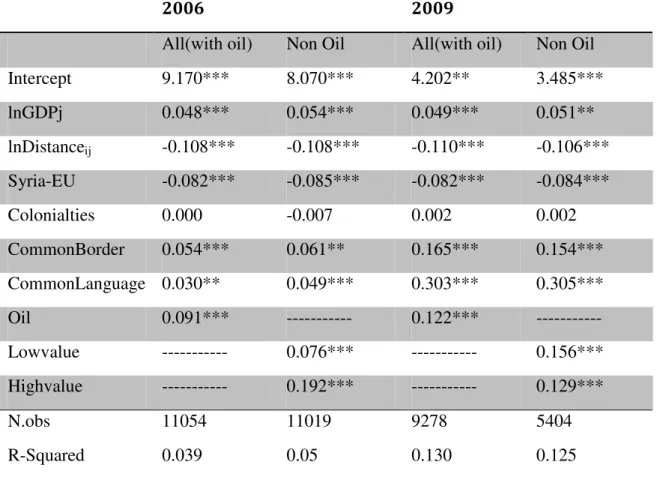
Table 3.2 Regressiones results Syrian export all commodities included oil and Non-oil
2006 2009
All(with oil) Non Oil All(with oil) Non Oil
Intercept 9.170*** 8.070*** 4.202** 3.485*** lnGDPj 0.048*** 0.054*** 0.049*** 0.051** lnDistanceij -0.108*** -0.108*** -0.110*** -0.106*** Syria-EU -0.082*** -0.085*** -0.082*** -0.084*** Colonialties 0.000 -0.007 0.002 0.002 CommonBorder 0.054*** 0.061** 0.165*** 0.154*** CommonLanguage 0.030** 0.049*** 0.303*** 0.305*** Oil 0.091*** --- 0.122*** --- Lowvalue --- 0.076*** --- 0.156*** Highvalue --- 0.192*** --- 0.129*** N.obs 11054 11019 9278 5404 R-Squared 0.039 0.05 0.130 0.125
*** Signifigant at 1%, **significant at 5%, *significant at 10%. Dependent variable: lnExport.
As shown on table 3.1, GDP of partner country j has a positive and significant coeffi-cient for both years 2006 and 2009. In 2006, the coefficoeffi-cient of GDP on total exports was 0.048 percent in the regression with oil and 0.054 percent when using high and low value commodity dummies instead. The results have not changed much for 2009, with the same coefficient having values of 0.049 percent and 0.059 percent for the two re-gressions respectively. This means that overall, a one percent higher partner GDP is as-sociated with roughly five percent higher demand for Syrian goods.
The coefficient for distance between Syria and the trading countries is negative and sig-nificant in all cases: -0.108 for 2006 and -0.110 for 2009 (the numbers are almost iden-tical for all regressions). As expected, the role of distance remains almost constant over the two periods.
The oil dummy too shows expected results. In both years the coefficient was positive and statistically significant: in 2006, a one percent higher oil trade accounted for 9,1 percent increased total exports, while 2009 this figure was at 12.2 percent. The increase in the impact of oil on total exports from 2006 to 2009 gives an indication that oil is less sensitive to economic downturn since as export volume fell, the proportion of oil on trade between Syria and the EU-27 became higher.
The alternative category to oil dummy was the division of all commodities to low-value goods and high-value goods. The results here are quite telling: in 2006, the coefficient of the low-value commodities was 0.076, but it doubled to 0.156 in 2009. On the con-trary, the high-value coefficient decreased from 0.192 in 2006 to 0.129 in 2009. This implies that low-value goods made up more of Syrian exports during 2009 than during 2006.
The dummy that represents Syria’s exports only to the EU-27 countries shows interest-ing results. Against expectations of a positive correlation, we see negative, significant dummy coefficient in all four regressions of about -8.5 percent. This means that export to the EU-27, as opposed to exports with the 30 non-EU partners is about 8.5 percent lower. Note that these goods exclude petroleum and oil products.
The various affinity factors such as common language and common border had small but positive effects on export in 2006 and these coefficients increased about threefold in 2009, playing a more important role in explaining export patterns. On the other hand co-lonial ties were statistically insignificant.
The F statistics are highly significant in all four cases implying that non of the inde-pendent variables is equal to zero. R squared is rather low in both years and for each re-gression (around 5 percent in 2006 and around 13 percent in 2009). This is not surpris-ing since we are ussurpris-ing a cross sectional data, where there are small variations in the data as opposed to time series, which measured values over many years (naturally providing more variation).
3.6 Analysis
The results shown in the previous section indicate that most of the independent vari-ables have statistically significant impacts on Syrian exports. As forecast, GDP has the positive effect of around 5 percent on export. Distance, again as expected, had a nega-tive impact on trade and its impact seems relanega-tively important. Petroleum and oil
prod-ucts also play an integral part in trade and their impact became significantly more im-portant during the crisis year of 2009. The various affinity factors such as common bor-der and language also influenced trade flow positively as predicted by theory. However, colonial ties with France had no significant influence. Surprisingly, the results challenge the hypothesis that EU-27 has a crucial role in Syrian export volumes by indicating that the variable is in fact negative. The remainder of this section goes deeper into the cau-sality behind these results.
The two main variables of interest in this research are the impact of trading with the EU-27 as well as the impact of petroleum and oil products on Syria’s total exports. The expectation is that the economic downturn of 2009 should adversely affect Syria’s total export volume since EU-27 is among Syria’s most important trading partners. As shown by the regression results, however, this is not the case, since exports to the EU-27 were significant, but lower compared other top trading partners both before and during the crisis.
This does not imply, however, that the downturn of the EU-27 economy did not ad-versely affect the Syrian one. The EU-Syrian trade has been growing over the recent years, especially between 2006 and 2008, but as crisis hit the EU in 2009, the volume of trade, especially the value of exports fell dramatically and only a year later did it pick up again. Thus, Syria experienced large losses from dropped exports to the EU. In that sense, fluctuations in the EU economy do affect Syrian trade, particularly the export market. However, accordingly to the model prediction, these losses were not as momen-tous when put in context with Syria’s other top 30 partners. The coefficient of EU-27 on total exports indicates that relative to its other main export partners, Syria trades less with the EU given its GDP and other characteristics, meaning that fluctuations in the EU-27 economy will not severely damage the Syrian export market and its economy as measured by GDP. Syria can export the same goods (about 90 percent oil products) to other top partners. One recent development to note is that Syria’s trade relations with China have been growing rapidly in the past decade. Therefore, future reductions on EU demand for Syrian exports will likely have even less effects on GDP than today. Note, however, that Syria depends more on the EU-27 for its imports than for exports, there was less fall in imports from the EU when the region was in crisis. This makes intuitive sense, since during an economic downturn, a country or region may demand less goods, but will continue to supply and attempt to increase its exports.
The petroleum commodities are important determinants of trade as expected. Not only is the variable positive and significant both in both years, its impact on exports becomes more significant during the crisis year of 2009. Moreover, petroleum products account for the majority of Syria’s exports (as well as its imports). Therefore, it is reasonable to assume that the volume and flow of the country’s total exports is positively and highly correlated with the changes in the trade of these commodities. All this implies that oil demand for oil and petroleum products did not fall in spite of an economic downturn. That is, oil is less sensitive to economic fluctuations because it is a necessity good with a comparatively inelastic demand.
The findings regarding the impact of GDP on exports are coherent with the theory of gravity model, which asserts that trade rises with the size of the economy. Large economies have more output meaning they have high trade flows due to exports. More-over, the income generated from these exports raises their purchasing power, thus
creat-the role of GDP remains roughly creat-the same both in 2006 when Syria’s trading partners were not experiencing a downturn and during the recession of 2009 (the coefficients were about 5 percent throughout).
This role of distance is also in line with the theory. As shown, it has a negative and sig-nificant impact on exports. Despite the slight variations over the two periods and the different models, in general, a one unit rise in distance reduces exports by about 10 per-cent in all cases.
Despite the falling impact of distance, common border played a more positive, signifi-cant role in explaining trade flow between the two years. This means that although the role of distance did not change during a crisis year, still Syria traded much more with its immediate neighbours in 2009 (the coefficient was about 5 percent in 2006 and dra-matically rose to around 15 percent in 2009). As explained by the theories, having common border implies lower transport costs, thus when there is a negative fluctuation on the world economy, both Syria and its neighbours will reduce cost of imported goods by buying from nearby neighbours than those far away. Moreover, common border lowers other transaction costs since it is associated with close cultural ties and shared values that make business operations and thus trade easier between countries. This is indeed the case for Syria, which shares very similar culture with its bordering countries (Lebanon, Turkey, Jordan, and Iraq). Another important aspect to note is that bordering countries are very likely to have favorable trade agreements with one another, which further enhances trade flows. Syria and Turkey for instance, have free trade agreements and constantly improve their commercial legal framework directed specifically at boost-ing their bilateral trade (Republic of Turkey, Ministry of Foreign Affairs, 2012). When viewed under this light, the coefficient of common border is below is rather low, mean-ing the trade volume between Syria and its neighbors are well below their potential. This conclusion is in line with Al-Atrash and Yousef’s (2000) study arguing that intra-Arab (i.e. Syria and its neighbours) trade too little.
Similarly, common language is another affinity factor that initially had a low influence of a few percent in 2006, which during the crisis year of 2009 rose to over 30 percent. The sudden jump in its coefficient signifies that compared to 2006, in 2009 Syria traded much more with Arab countries. This positive correlation is expected since a common language can largely reduce business transactions costs associated with contract and network formation as well as building trust and acquiring and retrieving information re-garding business and trading partners.
An unforeseen outcome, however, is the insignificance of the influence of colonial ties as opposed to the expected significant and positive impacts. One would expect positive relation between colonial ties and trade since colonies and colonisers have cultural bonds, shared values, and similar ways of conducting business due to historical link-ages. A possible reason why in the case of Syria and its colonizer, France, the impact of colonial ties on trade is not significant is due to the political disputes between the two countries at the time that lowered exports to France.
Finally, results of the low- and high- value commodity dummy variables indicate that during the economic downturn, the demand for higher value exports from Syria fell relative to that of lower value goods such as agricultural products. Because this change was statistically significant, we can deduce that low-value exports are less sensitive to crisis relative to more expensive goods. One reason behind the higher sensitivity of
high-value goods could be the higher transactions costs they are associated with, which reduces their demands in times of economic downturn.
4 Conclusion
This paper investigated the role of various factors on Syria’s exports, with a special fo-cus on the impact of oil and petroleum commodities on total exports as well as the strength of EU-27 as a source of export demand. The outcome of the gravity model re-gressions showed that all influencing factors such as gross domestic product, distance, and various other trade affinities have their expected impacts on trade volumes for the years tested. Interestingly, the role of EU-27 is not critical when weighed against Syria’s other main export markets. On the other hand, Syria is highly dependent on oil exports and small fluctuations in oil exports also cause fluctuations in total exports. The implications of these are as follows. As Syria’s trade relations with other partners such as China, Russia, and USA as well as with its immediate neighbours continue to rise, the country’s dependence on export to the EU will become ever smaller. This means that downturns in the EU economy can hurt the Syrian market, but as indicated, EU’s demand for oil and petroleum products, which make up over 90 percent of EU’s imports from Syria, are less sensitive to such changes. Therefore, as long as oil remains the key component of export to the bloc, economic fluctuations will not significantly af-fect the Syrian export flow or the Syrian economy. However, since a large amount of Syria’s high-value imports such as machinery and high-tech goods come from the EU, the bloc will likely continue to play a role in Syria’s economy in the medium long term. However, in the long run, this role may be taken over by China and Syria’s other main trading partners as they become more important. An important policy suggestion then is that Syria must enhance trade with its neighbours – both Arab and non-Arab as well as with its larger partners further away.
The vital role of oil is a cause of concern to Syrian trade in the long run. Due to this re-liance on oil, the country’s economy, as other oil-dependent countries, is highly suscep-tible to oil price volatility. Fall in oil prices have historically hurt the country’s economy and unless other export sectors are developed in the long run, this will continue to be the case.
Although this study gives some insights into the Syrian export situation, it is not without limitations. A deeper examination of all export components (Full gravity model) would give a better picture of the situation. Moreover, using another regression with data on imports and using panel data will better explain the dependence of Syrian economy on trade and specific trading partners, as well as its reliance on certain goods aside from oil.
List of references
Al-Atrash, H & Yousef, T. (2000). Intra-Arab Trade: Is it too little. International Moetary Fund, Midlle Eastern Departmant.
Anderson, J. E. (1979). A Theoretical Foundation for the Gravity Equation. The Ameri-can Economic Review, 69 (1), 106-116.
Anderson, J. E., & van Wincoop, E. (2003). Gravity with Gravitas: A Solution to the Border Puzzle. The American Economic Review, 93 (1), 170-192.
Brakman, S., Garretsen, H., & Marrevijk van, C. (2006). Introduction to geographice-conomics.Cambridge: Cambridge University Press.
Baldwin, R & Taglioni, D. (2006). Gravity for dummies and dummies for gravity equa-tions. National Bureau of Economic Research, Working Paper 12516.
Bergstrand, J.H. (1985). The Gravity Equation in International Trade: Some Microeco-nomic Foundations and Empirical Evidence. The Review of EcoMicroeco-nomics and Statistics, 67 (3), 474-481.
Baier, L. S., & Bergstrand, H. J. (2005). Do free trade agreements actually increase members’international trade?. Journal of International Economics, 7(1), 72-95. Brach, J & Loewe, M (2010): The Global Financial Crisis and the Arab
World: Impact, Reactions and Consequences, Mediterranean Politics, 15:1, 45-71 Deardorff, A. (1998). Determinants of Bilateral Trade: Does Gravity Work in a Neo-classi-cal World?. In Frankel, J.A. (Ed.), The regionalization of the world economy (p.7-32). University of Chicaco Press: Chicago
Dobb, M. (1975). Theories of value and distribution since Adam Smith : Ideology and Economic Theory. Cambridge University Press.
Dornbusch, R., Fischer, S. & Startz, R. (2008). Macroeconomics (11th edition) McGraw-Hill: Newyork.
Eichengreen, B., & D. A. Irwin. (1998). The role of History in Bilateral Trade Flows. In Frankel J.A. (Ed.)., The Regionalization of the World Economy. (p.33-62).Chicago: The University of Chicago Press.
Feenstra, R.C. (2004). Advanced International Trade: Theory and Evidence. Prince-ton University Press: PrincePrince-ton.
Gujarati, N.D (2003) Basic economtrics. 4th edition. Boston:McGraw Hill. Hinnebusch, R (2007). Modern Syrian Politics, University of St. Andrews
Costsand Trade Intesities. In J.Bröcker & Herrmann H. (Eds.)., Essays in Honour of Karin Peschel (p.75-85). Heidelberg : Physica-Verlag
Krugman, P. R., & Obstfeld, M. (2006). International economics - Theory & policy 7th ed. Boston:Pearson Addison-Weasley.
Krugman, P.R (1987). Is Free Trade Passe?. The Journal of Economic Perspectives, Vol. 1, No. 2 (Autumn, 1987), pp. 131-144.
Lazear, E. P. (1997). Culture and Language. Journal of Political Economy, 107(S6), 95-126.
Leamer. Edward E.(1995). The Hecksher-Ohlin Model in Theory and Practice. Printon Studies in International Finance, no.77.
Linnemann, H. (1966). An Econometric Study of International Trade Flows. Amster-dam: North Holland Publishing Company.
Lucke, Bernd. (2001). The Fiscal Impact of Trade Liberalization. A CGE Analysis for Syria. Institut de la Méditerranée, Marseille
Naudé, W. (2009). The Financial Crisis of 2008 and the Developing Countries Discussion Paper No. 2009/01.
Pöyhönen, P. (1963). A Tentative Model for the Volume of Trade Between Countries. Weltwirtschaftliches Archiv, 90 (1),93-99.
Srivastava, K. & Green, T. (1986). Determinants of Bilateral Trade Flows.
The Journal of Business, Vol. 59, No. 4, pp. 623-640 University of Chicaco Press: Chi-cago
Tinbergen, J. (1962). Shaping the World Economy – Suggestions for an International Economic Policy. New York: The Twentieth Century Fund
Data sources:
Comtrade. Retrieved 2012-04-20 from http://comtrade.un.org/db/default.aspx.
United Nations: New York.
European Commission trade. Retrieved 2012-04-20 from
http://ec.europa.eu/trade/creating-opportunities/bilateral-relations/countries/syria/
GeoDist. Retrieved 2012-04-20 from
http://www.cepii.fr/anglaisgraph/bdd/distances.htm Centre d`Etudes Prospectives et
d`Informations Internationales: Paris
World Bank Data. Retrieved 2012-04-20 from http://data.worldbank.org/data-catalog
Appendix
Appendix 1
VIF Test for Multicollinearity
Multicollinearity occurs when two or more of the explanatory variables in a regression model are linearly related to one another, indicating that a change in one regressor will have a significant impact on the values some other regressors. Multicollinearity occurs either when there is a problem with methods of data collection or when there are more explanatory variables than there are observations (Gujarati, 2003). The presence of mul-ticollinearity makes it difficult to assess the influence of individual predictor variables on the regressand. This is because, multicollinearity raises, or inflates, the variances and covariance.
A formal way of detecting multicollinearity in an OLS regression is by looking at the VIF test, which measures the extent to which the presence of multicollinearity raises or inflates the variances and covariance (Gujarati, 2003).
The VIF index gives an indication of the extent of multicollinearity in the regression. A VIF index of 10 and above signals that there is multicollinearity present. Since the pres-ence of multicollinearity raises the variance, it makes the R2 become very small. Thus, as R2 approaches 1, VIF index approaches infinity, meaning the extent of multicollin-earity rises. No significant multicolliniarity problems were found on this data when conducting the VIF test. Table 5.1 presents the results of this test. A VIF of up to 10 would indicate that there is no multicollinearity issue (Gujarati, 2003).
Table A1 collinearity statistics
2006 2009
Variable
All (with oil) Non oil All (with oil) Non oil
lnGDPj 2,538 2,541 2,450 2,451 lnDistance 4,650 4,654 4,516 4,520 Oil 1,000 --- 1,000 --- Syria to EU-27 1,947 1,949 1,950 1,952 Common Border 2,605 2,628 2,601 2,623 Colony 1,124 1,127 1,128 1,131 Common Language 2,871 2,890 2,922 2,940
Low value commodities
---
2,825
--- 2,824
Appendix
Appendix 2
White Test for Heteroscedasticity
In the presence of heteroscedasticity, the variances of the error terms in a regression model associated with the different predictor terms are unequal. One of the main as-sumptions of the OLS is that there is homoscedasticity, thus the existence of heterosce-dasticity in an OLS regression can lead to type II error. Testing for heterosceheterosce-dasticity is important in this paper for it is almost the rule, rather than the exception that it is pre-sent in cross-sectional data (since data over different periods are used). White’s General Heteroscedasticity Test can be performed on the data to detect for heteroscedasticity.
Table A2 White`s Test for Heteroscedasticity
Table A2 is the result of the White’s test. The observed R squared figures for both years are compared to the relevant figures of a chi squared distribution table. We find that since 124.342< 209,61 and 192,27 we reject the hypothesis that there is no heterosce-dasticity at 95 percent confidence level. Therefore, there was heterosceheterosce-dasticity present within the data.
White’s Heteroscedasticity - Consistent Standard Errors & Covariance remedial used to correct for heteroscedasticity
Appendix 3
Test for Normalisation
u
i~
N
(0,
σ
2)
Another fundamental assumption of the OLS regression under which the results are valid is the assumption that the disturbance terms are normally distributed with constant mean equal to 0 and constant variance equal to 1. If the regression gives the indication that the disturbance is not normally distributed (for instance using Jaque Bera test), Cook’s Distance can be used to detect the source of this disturbance – that is, which ob-servations cause the normality problems. Cook’s Distance is used to estimate the degree to which a data point influences the result, thus it can be used to detect outliers that are potentially invalid (due to mistakes in data collection for instance). The higher the value of Cook’s Distance, the bigger the problem of normality. To solve this problem the standardized residuals were estimated and raised to the power of two, any values of 9 or more are said to negatively influence the regression results, so such observations should be revisited or removed to give better, unbiased results.
2006 2009 F-statistic 7.046151 6.681416 Obs*R-squared 209.6147 192.2737 No. of Observation 21364 21169
Appendix
Appendix 4
Table A4: Selected Countries
30 top partner countries EU-27 countries
Algeria Austria
Argentina Belgium
Brazil Bulgaria
Canada Cyprus
China Czech Republic
Egypt, Arab Rep. Denmark
India Estonia
Indonesia Finland
Iran, Islamic Rep. France
Iraq Germany Japan Greece Jordan Hungary Kuwait Ireland Lebanon Italy Libya Latvia Malaysia Lithuania Morocco Luxembourg
New Zealand Malta
Nigeria Netherlands
Korea, Rep. Poland
Russian Federation Portugal
Sri Lanka Romania
Sudan Slovak Republic
Saudi Arabia Slovenia
Switzerland Spain
Thailand Sweden
Turkey United Kingdom
United Arab Emirates
Ukraine
United States
Appendix
Appendix 5
Table A5: Commodity groups in SITC 1-digit
Commodity groups SITC 1-digit code
Food and live animals 0
Beverages and tobacco 1
Crude materials, inedible, except fuels 2
Mineral fuels, lubricants and related 3
Animal and vegetable oils, fats and waxes 4
Chemicals and related products 5
Manufactured goods classified chiefly by material 6
Machinery and transport equipment 7
Miscellaneous manufactured articles 8
Commodities and transactions not classified elsewhere in the SITC
9