Linear correlation pattern between
Asset Management in European
Union Households and country’s
Degree of Development
MASTER THESIS WITHIN: General Management
NUMBER OF CREDITS:
15
PROGRAMME OF STUDY: Engineering Management
AUTHORS:
Ondrej Mitrenga
Hai Trieu Phan
SUPERVISOR:
Tommaso Minola
Management, Information and Production Engineering (DIGIP), and co-founder and Director of the Center for Young and Family Enterprise (CYFE) at the University of Bergamo, Mr. Tommaso Minola, Ph.D for his constant support and feedback, as well as for providing us with necessary information and direction of our Master Thesis and also for providing us with a fundamental analytical information that became a key stone of our Master Thesis.
Jönköping, May 2021
country degree of development and household asset management in European Union. Both of the variables are defined by relevant sub-variables where the relationships are being observed. There were used datasets gathered by respected European Statistical Agency Eurostat for 2019. Master Thesis focuses on European Union area and it aims on defining the crucial relationships between the variables in order to draw the conclusions that would help in pursuing the degree of development in different countries. In the Master Thesis we were using the quantitative research reflecting on the statistically expressed relationships using the correlation pattern. There were used 29 numbers for each of the variable representing the total number of European Union members in 2019 (28) plus the European Union average. There were found statistically significant relationships based on which we were able to define a proper generalisation together with the causation pattern for the European Union countries and households.
Abstract ... 3 Table of Contents ... 4 Table of Additions ... 6 1 Introduction ... 7 1.1 Research Purpose ... 8 1.2 Previous research... 8 1.3 Contribution ... 10 1.4 Keywords ... 11 1.5 Methodology ... 11
1.6 Assumptions and Hypotheses ... 13
1.7 Abbreviations ... 13
2 Degree of Development ... 14
2.1 Gross Domestic Product per capita ... 15
2.2 Labour cost ... 16
2.3 Median Net Income per capita ... 17
2.4 Digital Economy ... 18
2.5 Population by Education Attainment level... 19
2.6 Unemployment rate ... 20
3 EU Household Asset management ... 21
3.1 Currency and Deposits in EU Households ... 24
3.2 Debt Securities in EU Households ... 25
3.3 Loans in EU Households ... 26
3.4 Equity and Investment Fund Shares in EU Households ... 27
3.5 Insurance, Pensions and Standardised guarantees in EU Households ... 28
3.6 Financial Derivatives and Employee Stock Options ... 29
3.7 Other Accounts Receivable / Payable ... 30
4 Data Analysis ... 31
4.1 Research technique ... 31
4.2 Correlation and Pearson coefficient ... 31
4.3 Coefficient of Determination ... 33
5
5 Results ... 36
5.1 Statistically significant relationships ... 38
5.1.1 Relationships related to Currency and Deposits ... 38
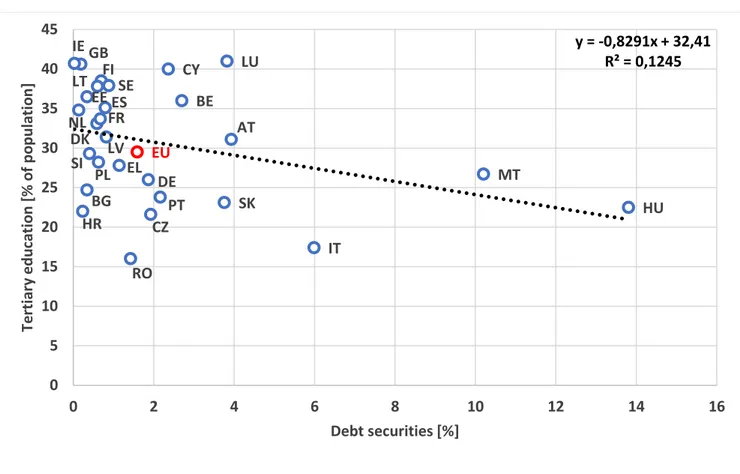
5.1.2 Relationships related to Debt securities ... 41
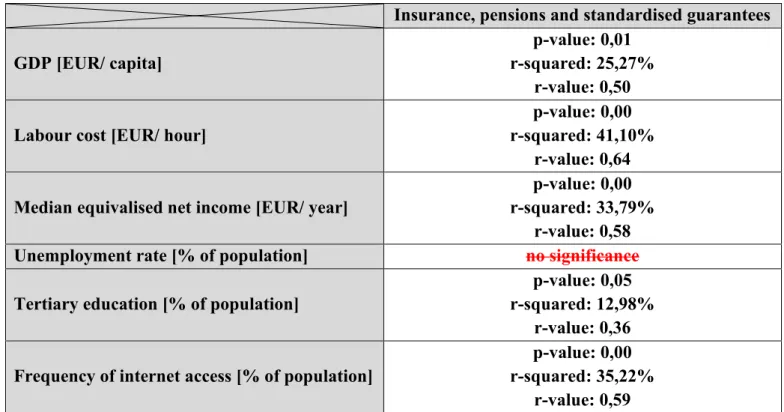
5.1.3 Relationships related to Insurance, pensions and standardised guarantees ... 42
5.1.4 Relationships related to Other accounts receivable/ payable ... 46
5.1.5 Others ... 50 6 Trustworthiness ... 51 6.1 Internal Validity ... 51 6.2 External Validity ... 51 6.3 Reliability ... 52 6.4 Objectivity ... 52 6.5 Research Ethics ... 52 7 Discussion ... 53
7.1 Research goals and positioning ... 53
7.2 Summary of Evidence ... 54
7.3 Contribution ... 54
7.4 Limitations and Future Research... 55
8 References ... 56
Table 2: Countries abbreviations ... 13
Chart 1: GDP at market prices [EUR/ capita] in 2019; (eurostat, 2021) ... 15
Chart 2: Labour cost compensation [EUR/ hour] in 2019; (eurostat, 2021) ... 16
Chart 3: Median equivalised net income [EUR/ year] in 2019; (eurostat, 2021) ... 17
Chart 4: Frequency of internet access [% of population] in 2019; (eurostat, 2021) ... 18
Chart 5: Tertiary education attainment level [% of population] in 2019; (eurostat, 2020) ... 19
Chart 6: Unemployment rate [% of population] in 2019; (eurostat, 2021) ... 20
Chart 7: EU Household Consolidated Financial balance sheets in 2019, (eurostat, 2021) ... 21
Chart 8: Maslow's Hierarchy of Needs (McLeod, 2020) ... 23
Chart 9: Currency and Deposits Holding (eurostat, 2021) ... 24
Chart 10: Debt Securities in European Union Households, (eurostat, 2021) ... 25
Chart 11: Loans in European Union Households (eurostat, 2021) ... 26
Chart 12: Equity and Investment Fund Shares in EU Households (eurostat, 2021) ... 27
Chart 13: Insurance, Pensions and Standardised guarantees, (eurostat, 2021) ... 28
Chart 14: Financial Derivatives and Employee Stock Options, (eurostat, 2021) ... 29
Chart 15: Other Accounts Receivable / Payable (eurostat, 2021) ... 30
Table 3: Strength of correlation (Mindrila & Balentyne, 2017), (Ratner, 2009) ... 31
Picture 1: Correlation illustration (Mindrila & Balentyne, 2017)... 32
Table 4: Pearson correlation coefficients ... 32
Table 5: Coefficients of Determination ... 33
Table 6: Statistical significance coefficients... 35
Table 7: Correlation matrix of variables ... 35
Table 8: Summary table of significantly related variables ... 36
Table 9: Correlation matrix of significantly related variables ... 37
Table 10: Currency and deposits significant relationships ... 40
Table 11: Debt securities significant relationships ... 41
Table 12: Insurance, pensions and standardised guarantees significant relationships... 45
Table 13: Other accounts receivable / payable significant relationships ... 49
Table 14: Insignificant linear relationships I ... 50
Table 15: Insignificant linear relationships II ... 50
7
1
Introduction
The European Union was formed in 1951 where Belgium, France, Italy, Luxemburg, Germany, and the Netherlands created the European Union as a means of economic cooperation. (Watts, 2008) In year 2019, there were 28 EU member countries including Great Britain, but currently in year 2021 after the Brexit deal was fulfilled, the European Union consists of 27 member states with a total population of about 446 million citizens. (EU, 2020) The European Union has pass through several historical landmarks, and it is now widely regarded as a stable point in the "Old Continent." With its developed financial systems, innovative industries, high degree of education and variety of cultural habits, different religions, and languages. The European Union also experiences significant differences in terms of living standard and income per capita, depending on location. These are the factors that are necessary to consider when comparing financial aspects in different countries in EU.
With the environment developing in an accelerated pace, the concept of asset management is evolving. Sectors like households and a country's development are dramatically changing. Most of the European households' capital was liquid or low yielding returning assets only a decade ago. When countries progress up the wealth and income scale, their institutional systems grow steadily richer in financial reserves, institutions, and market capitalization. (Gurley & Shaw, 1967)
Only 15% to 25% of households in countries such as Netherlands, Italy, Germany, and France own any type of stock. In contrary to these countries, for example in Sweden, about half of all households invest in the stock market. However, in many of these nations, the number of household participation in financial markets has risen dramatically, often more than doubling over the span of a decade. (Guiso, Haliassos, & Jappelli, 2003) There is enough space for households using some less known and more complicated financial instruments as a part of their asset management, these can be stocks, bonds, any kind of derivatives and new ways of thinking toward capitalism, private property, and reforms that have the potential to increase the valuation of businesses, liberalize labour markets and to improve the financial sector's functioning. (Guiso, Haliassos, & Jappelli, 2003)
With the unprecedented change in household asset management in European Union (EU) in the last decade, individual countries' economic development went through dramatic changes. According to Statista database (Commission, 2020), countries such as Ireland, Hungary, and Malta have recorded the fastest growing economy, which was around 5,5% to 4,4%. With the shift of households trying to preserve their wealth, the country's overall development increases the well-being of the country and its citizens. Economic development is often discussed in terms of capital, labour force participation, production, and wages. The actual or "goods" facets of growth have received the majority of economic literature coverage, with financial aspects receiving only little attention. However, growth is associated with the issuance of debt at certain economic system stages and the resulting accumulation of financial assets elsewhere. It is also accompanied by "institutionalization of saving and investments", which diversifies sources for the movement of loanable funds and multiplies the variety of financial claims. (Gurley & Shaw, 1955)
8
With all this in mind, the research would like to discuss how people think of their future in terms of their funds, whether they actively consider all the negative consequences that might affect their funds. As is known, differences in between individual European countries is visible not only in cultural side, but also in economical and development perspective. In general, there are countries that are consider as developed, and those that are seen rather as developing ones. (Watts, 2008) There are geopolitical, socioeconomical and cultural influences all around the Europe that scale the continent into 3 major parts, these are western part, central and eastern part.
The sectors of Household Asset Management and Degree of Development in this study will be divided into segments that are believed to play a significant role in finding the correlation pattern. This research is being carried out to see which segments overlap the most and how that correlation influences people's potential asset management attitude.
1.1 Research Purpose
The purpose of this research is to find a correlation in between the households’ asset management and country’s degree of development. Finding the answer would help to determine one of possibly many hypotheses of how to increase the degree of development globally. With that in mind, this research will be looking into the current situation in the European Union based on the rough data provided by respected European statistic institution. Due to a low retail investors engagement with capital markets, people are not able to keep up with the evolving opportunities that are occurring. (Delbecque, 2020) Also because of the old-fashion mindset, there are people who believe saving money and storing it in their bank accounts is the best way to manage their funds while making a little interest out of it. (Pinjisakikool, 2017) With that approach people tend to lose money because of the interest rates that are lower than the inflation and maintenance fees charged by banks. (ECB, 2020) This study aims on filling in the gaps in the importance of segment correlation between Household Asset Management and country Degree of Development. The goal is to categorize the importance of individual segments based on the dates to identify the critical factors that have been supporting a country's development and to present a possible solution that would have a potential to increase the degree of development in the countries.
1.2 Previous research
Topic of household engagement in financial markets is being popular among statisticians. There was recently a research done by European Fund and Asset Management Association (EFAMA) called Household Participation in Capital Markets Assessing the Current State and Measuring Future Progress (Delbecque, 2020). This report covers a comparison of all the European Union countries mainly based on data provided by European Central Bank (ECB, 2020), it also sums up the potential reasons for the low participation of households in capital markets and bringing up the proposal for a potential growth. This report however does not reflect on finding any relevant correlation relationship between the participation and a degree of development of these countries.
9
There were also presented researches focusing on habits within households, demonstrating that wealthy households are more likely to purchase stocks and spend wisely. (Calvert, Campbell, & Sodini, 2007) Earlier research conducted by (Hilgert, Hogarth, & Beverly, 2003) and also later on by (Lusardi & Mitchell, 2009) the existence of strong links between financial literacy and financial behaviour has been demonstrated.
Another study discusses the importance of financial education in order to reflect on current economic environment. People need to get familiar with skills necessary to make financial decisions for the long-term financial well-being of the family and community. (Tahira, 2012) Very often discussed topic is the behaviour of households on financial investments market also taking in consideration the fact of regional influence. (Bagautdinova, Nayda, Hayrullin, & Arzhantseva, 2014) Significant differences in the replication of intellectual capacity in EU member states can affect the overall poor relationships among the majority of EU-wide segment indicators for country growth to some degree. At the same time, tertiary education coverage influences labour efficiency, as measured by different approaches. (Bilan, Mishchuk, Roshchyk, & Kmecova, 2020) Regarding the coverage of the population with specific forms of education (ICT, management, technological, researcher training), it is evident that it is preferable to promote the accumulation of intellectual talent of the highest level of professionals such as R&D staff, including researchers. University education has undeniable personal benefits that lead to human development, increase a society's capacity to use human capital in the labour market, and have a positive impact on macroeconomic performance. Another argument that can be made is that equalizing the use of all economic resources, including the development of technological skills that do not normally develop over the course of formal tertiary education, has a significant impact on social productivity and a population's standard of living. (Bilan, Mishchuk, Roshchyk, & Kmecova, 2020)
In order to preserve the European economy's global competitiveness, the methods, and analytical techniques currently in use for analysing human resources or economic growth metrics are well established. As a result, it is possible to achieve a detailed multiple-criteria evaluation of human resource growth considerations and geographical variations. (Bilan, Mishchuk, Roshchyk, & Kmecova, 2020) All European Union countries operate similarly but culturally differently when it comes to household asset management and country degree of development.
When looking at the relationship between national cultural characteristics and bank deposit levels in Europe, it has been shown that national culture has a significant impact on financial decision-making. (Guiso, Sapienza, & Zingales, 2006) According to the findings, research created by (Kanagaretnam, Lim, & Lobo, 2011) found differences between national traditions which influence both accounting conservatism and risk-taking. On the other hand, (Thakor, 2016) in his research examines the literature on banking culture and concludes that corporate culture will help banks thrive while also improving financial stability.
The study was based on three national culture values: trust, individualism, and hierarchy, as recommended by (Ahern, Daminelli, & Fracassi, 2015). Following (Acharya, Drechsler, & Schnabl, 2014), the study compared the values chosen in national cultures with data from European banking authorities, based on the bank selected by the European Banking Authority
10
to conduct a stress test, which operates in a similar regulatory environment. (Mourouzidou-Damtsa, Milidonis, & Stathopoulos, 2021)
After optimizing individual bank results, country-level economic performance, and structural efficiency characteristics, multi-level regressions of bank deposit levels are used on the three cultural characteristics, given the various layers of variables in the study (i.e., countries, banks, and bank-years). All three cultural features have been shown to have a statistically significant relationship with the volume of bank deposits. Individualism has a negative relationship with bank deposits, while trust and hierarchy have a positive relationship. (Mourouzidou-Damtsa, Milidonis, & Stathopoulos, 2021) According to the study, this research also shown that National culture is projected to significantly affect deposits in banks with more culturally homogeneous customers and workers, according to the study, than in banks with a more culturally diverse climate. As a result, the sample was divided into domestic and global banks (Edwards, 2012).
This research concluded that cultural factors have a greater effect on domestic banks than on global banks, which is in line with the expectations of the research. A connection was discovered between all three cultural variables and the number of bank deposits held by domestic banks. In the case of global banks, only a favourable relationship between deposit levels and trust was found (no relationship was found for individualism or hierarchy), bolstering the common belief that banking is primarily dependent on trust. (Mourouzidou-Damtsa, Milidonis, & Stathopoulos, 2021) According to this study, the positive relationship between trust and bank deposit levels was decreased in the case of high deposit uncertainty. The magnitude of this decline is important from a financial standpoint. This finding is also consistent across the entire study and subsamples of domestic and global banks. (Mourouzidou-Damtsa, Milidonis, & Stathopoulos, 2021)
Based on the previous research we came to conclusion and formed our research question: • What is the relationship between a country degree of development and household asset
management in European Union? 1.3 Contribution
With this study, the aim is to close the gap in the quantitative rough data comparison and draw a meaningful link between household asset management in the European Union and country degree of development. All the datasets used in this research were gathered from the European statistical agency Eurostat. The goal is to define the correlations in however different cultural background and socioeconomical environment. These correlations could provide better understanding of household asset management habits characterising differently developed countries and would also help in drawing up on the conclusion. The contribution with this research also aims on formulating habit advice, which is relevant for different countries to become familiar with, in order to increase their well-being that would be based on the research.
11 1.4 Keywords
Household Financial Assets, Asset management, Capital market participation, Degree of Development, Financial Market, Knowledge of Economics and Finance, Risk diversification, Financial Literacy
1.5 Methodology
In this master thesis, the aim is on using a quantitative research approach. In this quantitative research approach, secondary dataset which are freely available and collected by the respected European statistical institution Eurostat will be analysed (eurostat, 2021). Quantitative research approach requires numerical summaries and for this the use of the datasets that will be analysed having different operational variables related to household asset management in European Union and the degree of development of individual EU countries.
The sample will consist of 28 EU–member countries and the estimated EU average number, so the statistical relationship's variable significance will be evaluated using 29 samples. All the samples will be referring to year 2019 as the most up-to-date datasets that are currently available. It is impossible to conclude causation in a quantitative approach, but the method aims on finding a correlation relationship between given variables. Quantitative method also shows data in “group-understanding” rather than individually based outcomes. However, there is a limited sample of data in this case, but it is large enough to draw conclusions on an overall efficacy and in-depth understanding of the issue. Since datasets are intended to assess relevant relationships, a generalization can be made at the level of the European Union in this quantitative research.
The pre-validated and accurate instruments developed by the publicly certified European statistical agency Eurostat will be used in this quantitative method analysis. Continuous variables will be included in the instrumentation, which will be interpreted on an interval basis. Face validity is proven by the specifical choice and filtration of each of the desired variable. Content validity addresses the relevance of content that was studied in the datasets and sampling is appropriate when covering all the EU–member states. Concurrent validity was also revised based on previous data sampling and what is more the data gathering method is consistent over the years and keeps measuring the same variables continuously. Instrument reliability was examined with the Test-Retest method. Two different administrations did the same data gathering ECB (ECB, 2020) and Eurostat (eurostat, 2021) and the difference between these two relevant instruments was identified within the statistical discrepancy. (eurostat, 2020)
This study will employ a correlational research design. It investigates the relationship between one or more dependent and independent variables, in this case, household asset management and development degree variables. Causation is not determined in the correlational research design because of the presence of confounding variables. The complexity of the outputs is determined by proper control of the input variables. The correlation study will be carried out entirely in Microsoft Excel. The parametric Pearson r correlation coefficient, which is similar to linear regression, will be used to determine the correlation relationship pattern.
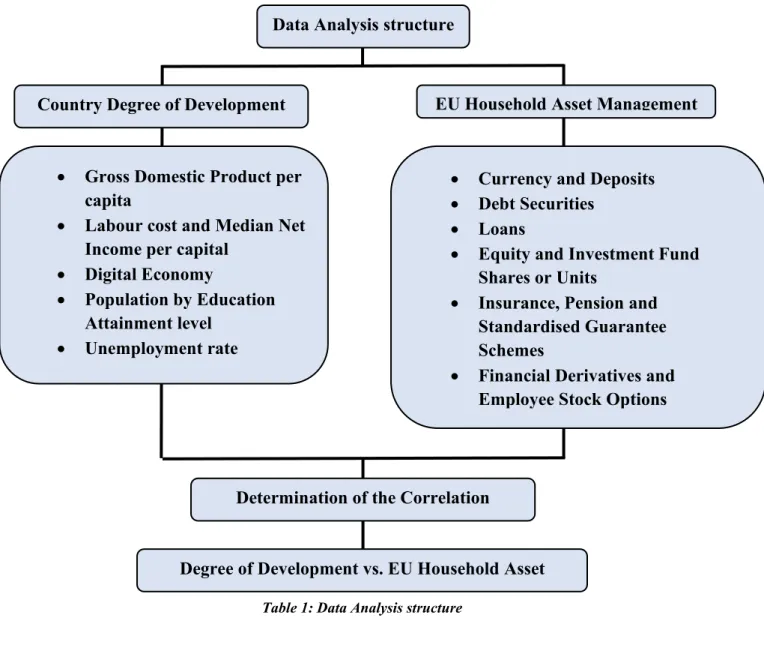
12 Country Degree of Development
• Gross Domestic Product per capita
• Labour cost and Median Net Income per capital
• Digital Economy
• Population by Education Attainment level
• Unemployment rate
• Currency and Deposits • Debt Securities
• Loans
• Equity and Investment Fund Shares or Units
• Insurance, Pension and Standardised Guarantee Schemes
• Financial Derivatives and Employee Stock Options • Other Accounts
Receivable/Payable Determination of the Correlation
Relationship
EU Household Asset Management Data Analysis structure
Degree of Development vs. EU Household Asset Management
13 1.6 Assumptions and Hypotheses
In the Assumption and Hypotheses sub-chapter, correlational analysis design will be checked. It is believed that a significant correlation relationship between two variables could be found, which are the country Degree of Development and EU Household Asset Management, using the gathered datasets. These two variables are defined by sub-variables which are the relevant datasets for identifying such relationships.
- There are two main hypotheses that will be evaluated in the research.
Null hypothesis: Implicating no linear relationship between the two variables. r= 0. Alternative hypothesis: There is a linear relationship between the two variables. r≠ 0 - We believe that this study would support our hypothesis that households investing more
in volatile and more risky financial assets such as stocks are rather from the more economically developed countries.
- We also believe that there would be a negative correlation between currency and deposit holdings and a country's economic development.
- Lastly, there is one more outcome we feel could be significantly proving any kind of correlation. This is the digital economy parameter and its relationship to more risky financial assets of household. We believe that the more people who use the internet on a regular basis are more likely to invest in risky assets.
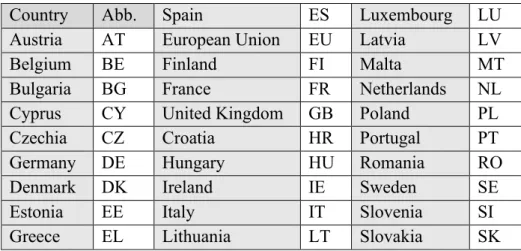
1.7 Abbreviations
This research deals with countries as the two-character abbreviations. The table below explains the logic behind it and what abbreviations would be used for each individual country.
Country Abb. Spain ES Luxembourg LU
Austria AT European Union EU Latvia LV
Belgium BE Finland FI Malta MT
Bulgaria BG France FR Netherlands NL
Cyprus CY United Kingdom GB Poland PL
Czechia CZ Croatia HR Portugal PT
Germany DE Hungary HU Romania RO
Denmark DK Ireland IE Sweden SE
Estonia EE Italy IT Slovenia SI
Greece EL Lithuania LT Slovakia SK
14
2
Degree of Development
A developed country is described as one with a high level of economic and social development that ensures stability. Matrices that the country must possess before it can be acknowledged as a developed country are certain level of gross domestic product (GDP) per capita, level of income, industrialization, infrastructure and living standards. (Majasky, 2020) When these matrices do not provide relevant datasets for the individual country, it is also possible to measure the level by non-economic measures such as the human development index (HDI). The human development index (HDI) is calculated by three factors: education, health, and financial literacy of the country's population. These three variables are indicators of a country's low level of economic growth. (Majasky, 2020) HDI is measured on a scale ranging from 0 to 1 and it determines the country' level of economic development. Most of the developed countries have a score above 0,8. Countries such as Sweden and Norway are between the world’s most developed countries, whereas country such as Niger has the lowest HDI rating of all other countries. (Majasky, 2020)
This research will be looking at five matrices that are considered as highly relevant ones in terms of forming a base of the degree of development in the European Union (EU) countries. These metrics provide socio-economic outlook and are highly suitable for proving a degree of development measure of each individual EU country. These are the crucial metrics we will be focusing on in our research:
1) Gross Domestic Product per capita 2) Labour cost
3) Median Net Income per capita 4) Digital Economy
5) Population by Education Attainment level 6) Unemployment rate
15 2.1 Gross Domestic Product per capita
GDP per capita is a global economic metric which evaluates the wealth of nations and is used by analysts, along with GDP, to analyze the prosperity of a world based on its economic growth. (Staff, 2020) There are a few approaches to evaluate the wealth and stability of a society. GDP per capita is the most universal, with its components regularly tracked on a global scale, making it simple to calculate and apply.
The indicator is measured as the ratio of actual GDP to the average population in a given year. GDP calculates the amount of the overall final production of goods and services provided by the economy for a given period of time. This includes goods and services with markets (or the potential for markets) as well as products produced by the government and non-profit organizations. It is a measure for the development of a country's material standard of living and is also used as an indicator of economic activity. However, this is just a sliver of a picture of economic health. GDP, for example, does not account for the majority of unpaid household employees, nor does it account for the negative impacts of economic development, such as environmental degradation. (eurostat, 2021)
Chart below compares European Union countries in 2019. Countries such as Luxemburg, Ireland and Denmark had the highes GDP per capita. Luxemburg was leading with 83 640 EUR per capita, followed by Ireland with 60 170 EUR per capita and Denmark with 49 720 EUR per capita. Average GDP of the EU which was 28 610 EUR per capita, those countries are excelling. In the contrary, countries such as Bulgaria, Romania, and Croatia are the countries with the lowest GDP. Bulgaria having 6 840 EUR per capita, followed by Romania with 9 110 EUR per capita and Croatia with 12 450 EUR per capita.
Chart 1: GDP at market prices [EUR/ capita] in 2019; (eurostat, 2021) 38 170 35 940 6 840 24 570 18 330 35 840 49 720 15 760 17 750 25 20028 610 37 170 33 270 32 910 12 450 13 260 60 170 26 920 14 010 83 640 12 510 21 800 41 870 13 000 18 590 9 110 43 900 20 700 15 860 0 10 000 20 000 30 000 40 000 50 000 60 000 70 000 80 000 90 000 AT BE BG CY CZ DE DK EE EL ES EU FI FR GB HR HU IE IT LT LU LV MT NL PL PT RO SE SI SK
16 2.2 Labour cost
Labour cost is the sum of all wages paid to employees. This also includes benefits, such as salaries, cash and in-kind insurance, and social security contributions from employers, as well as vocational training, and other expenses, recruitment costs, expenditure on work clothes, and employment taxes regarded as labour costs minus any subsidies received. (europa.eu, 2021) In our research we will be using the labour cost calculated as a compensation of employees plus taxes minus subsidies, expressed in base units: EUR/ hour.
Chart below compares all the European Union countries and proves that countries such as Denmark, Luxemburg, and Belgium had the highest labour cost in 2019. Denmark was leading the pack with 44,7 EUR/ hour, followed by Luxemburg with 41,6 EUR/ hour and Belgium with 40,5 EUR/ hour. These countries are the top three countries that are leading the chart of labour cost in the European Union. EU labour cost average was 28,2 EUR/ hour. In contrary to the top highest rates, there are many countries having a rate lower than the EU average. Countries such as Bulgaria having a labour cost at 6 EUR/ hour, followed by Romania with 7,7 EUR/ hour and Lithuania with 9,4 EUR/ hour.
Chart 2: Labour cost compensation [EUR/ hour] in 2019; (eurostat, 2021) 34,7 40,5 6,0 17,4 13,5 35,6 44,7 13,4 16,4 21,8 28,2 34,0 36,6 28,5 11,1 9,9 33,2 28,8 9,4 41,6 9,9 15,0 36,4 10,7 14,6 7,7 36,3 19,0 12,5 0 5 10 15 20 25 30 35 40 45 50 AT BE BG CY CZ DE DK EE EL ES EU FI FR GB HR HU IE IT LT LU LV MT NL PL PT RO SE SI SK
17 2.3 Median Net Income per capita
Median net income per capita is the average income that an individual receives from their occupation. This contrasts with other conventional wealth metrics in the country, such as household income, which counts all people living under one roof as households, and family income, which counts all people living under one roof as families who are related by birth, marriage, or adoption. Since per capita income is calculated by dividing the total income of the country by the total number of people, it is not always an accurate representation of the cost of living. (Kenton, 2020)
Data from Eurostat show that median equivalised net income per capita differs in European Union countries. There are countries with median equivalised net income per capita as high as 36 354 EUR/ year in Luxemburg, followed by Denmark with 30 717 EUR/ year and Austria with 25 279 EUR/ year. Whereas the lowest median equivalised net income per capita in the EU is in Romania, equal to 3 851 EUR/ year, followed by Bulgaria 4 224 EUR/ year and Hungary with 5 852 EUR/ year. The EU average was 22 562 EUR/ year in 2019.
Chart 3: Median equivalised net income [EUR/ year] in 2019; (eurostat, 2021) 17 819 24 608 4 224 9 995 30 717 23 515 11 461 25 528 8 195 15 015 22 562 7 306 17 165 16 215 8 187 7 586 36 354 5 852 15 354 24 612 25 729 7 124 10 023 3 851 14 067 8 119 24 879 24 474 0 5 000 10 000 15 000 20 000 25 000 30 000 35 000 40 000 EU BE BG CZ DK DE EE IE EL ES FR HR IT CY LV LT LU HU MT NL AT PL PT RO SI SK FI SE
18 2.4 Digital Economy
A steady decrease in computing costs, the introduction of the Internet as a networking tool, the rapid growth of mobile Internet, the spread of day-to-day applications, and the growing presence of internet-based social networks and commercial platforms have all had a huge impact on the economy's functioning and have had a profound impact on businesses, government institutions, and individuals. (europa.eu, Digital Economy, 2021) Emerging technologies like the Internet of Things, artificial intelligence, and Big Data would accelerate technological advancement while also presenting new opportunities and challenges. Customers and businesses have benefited from digitalization, but it has also generated new opportunities and policy concerns. These new issues are being addressed by policymakers. (eurostat, 2021) Therefore, we will use in our research the metric referring to frequency of internet access of at least once a week. This metric is using the base unit % of population.
Chart below demonstrates the percentage share of population frequently using internet access at least once a week. The EU average is around 85%. However, there are countries where the population share was higher, for example in countries such as Denmark, Great Britain, Netherlands, and Sweden sharing the highest rate of frequency of internet access with 95% of population. Whereas there were countries such as Bulgaria with 67% of population, Romania with 72% of population and Portugal with 73% of population sharing the lowest rate of frequency of internet access of at least once a week in population.
Chart 4: Frequency of internet access [% of population] in 2019; (eurostat, 2021)
86 89 67 85 85 91 95 88 74 88 85 93 87 95 77 80 88 74 81 93 84 85 95 78 73 72 95 81 82 0 10 20 30 40 50 60 70 80 90 100 AT BE BG CY CZ DE DK EE EL ES EU FI FR GB HR HU IE IT LT LU LV MT NL PL PT RO SE SI SK
19 2.5 Population by Education Attainment level
Education attainment level represents the percentage of population that has obtained tertiary education in individual EU countries. Tertiary education refers to University and Higher Degree education, i.e., levels 5 to 8. This metric refers to active population aged from 15 to 64 years. Educational attainment differs in countries as it is highly dependent on economic conditions and expenses tightly connected with reaching this level of education. Some of the countries also surprisingly reached the below average rate however ranging at the top of the economic prosperity. (eurostat, 2020)
Chart below shows the tertiary education attainment proving the highest share was in 2019 in Luxembourg reaching 41% of population, followed by Ireland with 40,7% of population and Great Britain with 40,6% of population that reached the highest education. The EU average rate in 2019 was 29,5% of population. In contrary, the lowest rate of tertiary educational attainment was seen in Romania where there was 16% of population reached the tertiary education, followed by Italy with 17,4% of population and the Czech Republic with 21,6% of population.
Chart 5: Tertiary education attainment level [% of population] in 2019; (eurostat, 2020) 31,1 36,0 24,7 40,0 21,6 26,0 33,1 36,5 27,8 35,1 29,5 38,5 33,7 40,6 22,022,5 40,7 17,4 37,9 41,0 31,4 26,7 34,8 28,2 23,8 16,0 37,8 29,3 23,1 0 5 10 15 20 25 30 35 40 45 AT BE BG CY CZ DE DK EE EL ES EU FI FR GB HR HU IE IT LT LU LV MT NL PL PT RO SE SI SK
20 2.6 Unemployment rate
Unemployment is an important economic indicator because it reflects workers' willingness (or inability) to work and contribute to the economy's productive output. Since there are so many unemployed people, there is less gross economic activity than there would have been otherwise. Unemployed people, unlike idle money, must maintain at least their subsistence level throughout their unemployment. This implies that in an economy with high unemployment, productivity falls without a corresponding drop in demand for basic goods and services. Unemployment that remains high for an extended period of time will signal extreme economic hardship and could even result in social and political turmoil. (Hayes, 2021) Unemployment rate also shows a very precise information about the economy in the country and its competitive abilities.
Chart below represents percentage of active population levels of unemployment rates in individual European Union countries. The highest unemployment rate shows Greece where there was 17,33% of the active population without work in 2019. It is followed by Spain with 14,11% of active population and Italy with 9,97% of population. EU average was 6,33% of population unemployment rate in 2019 while there were also countries with very low rate, such as the Czech Republic with 2,02% of population, Denmark with 3,15% of population and Netherlands represented by 3,4% of its active population.
Chart 6: Unemployment rate [% of population] in 2019; (eurostat, 2021) 4,51 5,37 4,24 7,11 2,02 3,15 5,06 4,40 17,33 14,11 6,33 6,69 8,45 3,77 6,64 3,45 4,97 9,97 6,28 5,59 6,33 3,62 3,40 3,28 6,55 3,93 6,77 4,45 5,77 0 2 4 6 8 10 12 14 16 18 20 AT BE BG CY CZ DE DK EE EL ES EU FI FR GB HR HU IE IT LT LU LV MT NL PL PT RO SE SI SK
21
3
EU Household Asset management
Asset management is a continuous discipline where financial (economic) assets are meant to store a value through holding it or using the assets over period of time. (Stafford Jr., Kasulis, & Lusch, 1982) These financial assets are meant to carry forward the value from one accounting period to another. (eurostat, 2019) Household asset management is focused on level of individual households and their approach towards the value formation over years. Household’s wealth usually consists of a combination of tangible and intangible assets. (Delbecque, 2020) Tangible assets: - houses, - flats, - vehicles, - other valuables.
Intangible (financial) assets: - currency and deposits, - debt securities,
- loans,
- equity and investment fund shares, - insurance, pensions and
standardized guarantees,
- financial derivatives and employee stock options,
- other accounts receivable/ payables In the report for 2019 conducted by (eurostat, 2021), this European statistic agency summarised that in average around 38,75% of European Union households held their financial assets in insurance, pensions, and standardized guarantees, another 30,27% were held in currencies and deposits and around 26,36% were in equity and investment fund shares. This report also points at the share of around 2,68% that belongs to other accounts receivable or payable, 1,58% in debt securities, 0,31% in loans, and only around 0,04% were held in financial derivatives and employee stock options.
Chart 7: EU Household Consolidated Financial balance sheets in 2019, (eurostat, 2021)
38,75%
30,27% 26,36%
2,68%
1,58% 0,31% 0,04%
Insurance, pensions and standardised guarantees Currency and deposits
Equity and investment fund shares Other accounts receivable / payable Debt securities
Loans
Financial derivatives and employee stock options
22
According to report created by (Delbecque, 2020) there is majority of European Union households that do not save in capital market instruments at all. Report also shows data reflecting on the countries with the lowest share of deposits that tend to have the highest share of financial wealth held in pension savings, which is caused by the long-lasting history of policy. Report examined the very current state, reflecting on the development between 2008 and 2019. There were defined five major reasons for this happening:
1. Risk aversion
Many people rather tend to limit the amount of risk, so they choose to save their funds via bank deposits and insurance, where they are provided with higher guarantee of not losing their wealth.
2. Financial literacy
Financial literacy goes hand in hand with risk aversion because many people do not realise the advantages and disadvantages of different financial instruments and how an unwanted impact inflation has on their bank deposits.
3. Economic development
There is a proof of so-called negative correlation between country economic development and the share of financial assets held in bank deposits, which means the less developed country is, the higher percentage of people will have their funds held in bank accounts.
4. Real estate
Real estate is seen to be the most popular investment choice for majority of the European population.
5. Welfare system
There is also a negative correlation between the welfare system and people saving funds for the retirement. The more sufficient welfare system and the provision of social services is the less are people “motivated” for savings their own funds for the retirement.
A lack of participation on capital markets throughout the European Union is significant. However, being active on capital markets has also many advantages that would enrich its participants. As above mentioned, this problem can be defined through the lack of financial literacy which it goes hand in hand with risk aversion due to not knowing all the important facts and at the same time a reluctance to learn new things. (Delbecque, 2020) Many people also find it difficult to collect desired information when living in country of lower economic development. These countries therefore tend to be rather conservative, and their citizens are not educating themselves in how to take care of their funds effectively.
Going more into a sociological aspect, it could be defined as a tendency by the Maslow's Hierarchy of Needs. It says that before a person moves up in a hierarchy, the person needs to fulfil own needs at the current level. Therefore, before thinking of how and why to save funds
23
and actively invest them in order to increase their future value in time, the person needs to satisfy current needs before doing so.
Chart 8: Maslow's Hierarchy of Needs (McLeod, 2020)
In general, participation in capital markets and active use of the financial instruments can lead to a proper reallocation of wealth throughout the European Union and the world. It is also seen as a rational way to provide EU citizens with future financial well-being and can help achieve a fairer participation of vulnerable social groups. (Delbecque, 2020)
Sub-chapters below aim on summarising and explaining a role of crucial household asset management instruments that are being actively used. These intangible financial instruments that will be evaluated in the research are:
1) Currency and Deposits 2) Debt securities
3) Loans
4) Equity and Investment Fund Shares
5) Insurance, Pensions and Standardized Guarantees 6) Financial Derivatives and Employee Stock Options 7) Other Accounts Receivable/ Payables
24 3.1 Currency and Deposits in EU Households
Holding currency and deposits represents banknotes and coins officially issued by monetary authorities. These are exchangeable for currency on demand and might be used for payments by cheque, giro, direct debit and so on. (eurostat, 2019)
According to data collected from Eurostat (eurostat, 2021), known as “Your key to European statistics” we found out that the highest rate in 2019 was in Cyprus, with 60,56% share of households having their funds held in currency and deposits. Second highest rate was in Greece, with around 57,86% holding their funds this way. Third highest rate was in Slovakia, where there were 53,91% of all households having stored their funds in currency and deposits. On the other hand, the lowest share was reported in Sweden with the country holding 13,14%, Denmark with 13,99%, and the Netherland with 15,66%. European Union average for 2019 was 30,28% holding in Currency and Deposits.
Chart 9: Currency and Deposits Holding (eurostat, 2021) 40,12% 31,34% 40,19% 60,56% 44,47% 39,93% 13,99% 25,54% 57,86% 38,27% 30,28%32,18% 27,18% 24,90% 48,27% 25,76% 36,12% 33,71% 37,18% 45,48% 35,96% 49,64% 15,66% 50,76% 44,52% 37,01% 13,14% 47,48% 53,91% 0% 10% 20% 30% 40% 50% 60% 70% AT BE BG CY CZ DE DK EE EL ES EU FI FR GB HR HU IE IT LT LU LV MT NL PL PT RO SE SI SK
25 3.2 Debt Securities in EU Households
Debt securities are negotiable financial instruments that are designed for potential trading on an organised and regulated exchange or in the over-the-counter-market (OTC). (eurostat, 2019) Financial balance sheet for Debt Securities holding was in 2019 stable with rates as low as 1,59% for the whole European Union average.
On the other hand, there are countries which are holding the highest share of Debt securities. These are Hungary and Malta, having their households holding debt securities of above 10%. Hungary 13,81% and Malta 10,20% respectively.
In contrary to Hungary and Malta, there were countries whose household debt securities holdings could be expressed in lower than 1%. These were for example Ireland (0,03%), Netherland (0,14%), Great Britain (0,19%), Croatia (0,23%), Bulgaria and Estonia (both 0,34%).
Chart 10: Debt Securities in European Union Households, (eurostat, 2021) 3,93% 2,70% 0,34% 2,36% 1,93% 1,87% 0,59% 0,34% 1,14% 0,79% 1,59% 0,69% 0,67% 0,19% 0,23% 13,81% 0,03% 5,99% 0,88% 3,82% 0,82% 10,20% 0,14% 0,63% 2,16% 1,43% 0,60% 0,41% 3,76% 0% 2% 4% 6% 8% 10% 12% 14% 16% AT BE BG CY CZ DE DK EE EL ES EU FI FR GB HR HU IE IT LT LU LV MT NL PL PT RO SE SI SK
26 3.3 Loans in EU Households
Loans are financial assets created when creditors lend funds to debtors, either directly or through brokers, which are either evidenced by non-negotiable documents or not evidenced by documents. (eurostat, 2019)
Distribution of Loans somehow corresponds with Debt Securities financial balance sheet in European Union households. However, in Loans, the highest share was in Malta (6,30%), followed by Portugal (3,92%) and Hungary (3,38%).
The lowest share of Loans were in the Czech Republic (0,00%), Greece (0,00%), Ireland (0,00%), Finland (0,03%), and Netherland (0,07%). European Union average was set to be 0,31%.
Chart 11: Loans in European Union Households (eurostat, 2021) 0,40% 0,23% 0,22% 1,06% 0,00% 0,00% 2,11% 0,09% 0,00% 0,00% 0,31% 0,03%0,18% 0,28% 0,00% 3,38% 0,00% 0,29% 0,50% 0,37% 2,57% 6,30% 0,07% 1,33% 3,92% 0,84% 0,22% 2,23% 0,15% 0% 1% 2% 3% 4% 5% 6% 7% AT BE BG CY CZ DE DK EE EL ES EU FI FR GB HR HU IE IT LT LU LV MT NL PL PT RO SE SI SK
27
3.4 Equity and Investment Fund Shares in EU Households
Equity and investment fund shares are financial assets that represent property rights on corporations or quasi-corporations (such assets generally entitle the holders to a share of profit, and to a share of net assets in the event of liquidation). (eurostat, 2019)
Equity and Investment Fund Shares in EU Households were enjoying a high attention in 2019. The whole EU average was set to represent a number as high as 26,38%.
There were however countries, where equity and investment in fund shares was even more popular with households, these were for example Estonia with 55,69% share, followed by Finland with 47,03% and Sweden with 45,44% share.
On the other hand, the lowest share was reported in Ireland with 11,92%, Netherland with 14,13% and Great Britain with 15,16%.
Chart 12: Equity and Investment Fund Shares in EU Households (eurostat, 2021) 33,69% 41,48% 36,53% 20,91% 40,07% 21,25% 34,01% 55,69% 32,97% 41,90% 26,38% 47,03% 28,11% 15,56% 21,82% 41,30% 11,92% 33,75% 40,04% 34,58% 35,83% 23,89% 14,13% 25,71% 29,43% 26,84% 45,44% 30,79% 19,49% 0% 10% 20% 30% 40% 50% 60% AT BE BG CY CZ DE DK EE EL ES EU FI FR GB HR HU IE IT LT LU LV MT NL PL PT RO SE SI SK
28
3.5 Insurance, Pensions and Standardised guarantees in EU Households
Insurance, pensions, and standardized guarantees stand for financial assets that are of policy holders or beneficiaries and financial liabilities of insurers, pension funds, or issuers of standardised guarantees. (eurostat, 2019)
Another way how people in European Union treat their funds are Insurance, Pensions and Standardised guarantees. This can be described as very popular in countries such as the Netherlands (with 68,28% share), Great Britain (55,56% share) and Ireland (49,63%).
Lowest share of insurance, pensions and standardised guarantees in EU households were reported in Greece (4,84%), Hungary (7,57%) and Malta (9,06%). European Union average rate in 2019 was 38,72%.
Chart 13: Insurance, Pensions and Standardised guarantees, (eurostat, 2021) 20,31% 23,41% 13,55%12,62% 10,59% 36,50% 47,74% 15,92% 4,84% 16,52% 38,72% 18,01% 37,73% 55,56% 26,60% 7,57% 49,63% 25,64% 11,18% 15,75% 20,93% 9,06% 68,28% 13,29% 17,46% 10,62% 39,09% 13,85% 19,38% 0% 10% 20% 30% 40% 50% 60% 70% 80% AT BE BG CY CZ DE DK EE EL ES EU FI FR GB HR HU IE IT LT LU LV MT NL PL PT RO SE SI SK
29
3.6 Financial Derivatives and Employee Stock Options
Financial derivatives and employee stock options are financial assets, a non-financial asset, or an index, through which specific financial risks can be traded in financial markets in their own right (for example, options, forwards and credit derivatives, or agreements for the purchase of an employer’s stock at a stated price). (eurostat, 2019) Financial Derivatives and Employee Stock Options are considered to be a very complex and sophisticated instruments for investing. This might also be a reason why the share of such instruments is very low in the European Union.
The highest share Financial Derivatives and Employee Stock Options in 2019 were reported in Belgium (0,13%), Spain (0,11%) followed by Great Britain with 0,10%.
Many of the European Union countries were reported to have a 0,00% of such financial instruments held by households. European Union average for 2019 was reported to be 0,03%.
Chart 14: Financial Derivatives and Employee Stock Options, (eurostat, 2021) 0,01% 0,00% 0,13% 0,00% 0,00% 0,00% 0,01% 0,00% 0,00% 0,11% 0,03% 0,00% 0,00% 0,10% 0,00% 0,00% 0,08% 0,03% 0,00% 0,00% 0,02% 0,00% 0,02% 0,00% 0,00% 0,01% 0,00% 0,01% 0,00% 0,00% 0,02% 0,04% 0,06% 0,08% 0,10% 0,12% 0,14% AT BE BG CY CZ DE DK EE EL ES EU FI FR GB HR HU IE IT LT LU LV MT NL PL PT RO SE SI SK
30 3.7 Other Accounts Receivable / Payable
Other accounts receivable/ payable represent financial assets that are created as a counterpart of a financial or a non-financial transaction in cases where there is a timing difference between this transaction and the corresponding payment (for example, the direct extension of credit by suppliers, advances for work that is in progress or has yet to be undertaken, or pre-payment for goods/ services that have yet to be delivered). (eurostat, 2019)
In the Other Account Receivable/ Payable chart there is the highest share for Romania with 23,25%, followed by Lithuania with 10,23% and Bulgaria with 9,04 %.
European Union average was in 2019 around 2,69% per household. Therefore, countries such as Luxemburg (0,00%), Denmark (0,46%) and Belgium (0,84%) are way under the average of the whole EU.
Chart 15: Other Accounts Receivable / Payable (eurostat, 2021) 1,53% 0,84% 9,04% 2,50% 2,93% 0,46% 1,54% 2,42% 3,20% 2,41% 2,69% 2,06% 6,14% 3,41% 3,08% 8,18% 2,21% 0,60% 10,23% 0,00% 3,88% 0,90% 1,70% 8,28% 2,50% 23,25% 1,52% 5,22% 3,31% 0% 5% 10% 15% 20% 25% AT BE BG CY CZ DE DK EE EL ES EU FI FR GB HR HU IE IT LT LU LV MT NL PL PT RO SE SI SK
31
4
Data Analysis
4.1 Research technique
Within this part, the aim on comparing the crucial metrics of individual country degree of development with the European Union household asset management. The goal is to define any kind of linear correlation that would point at different habits. However, it is important to keep in mind that all the metrics might be highly influenced by different cultural habits and political regulations in each of the individual country. Therefore, the aim is to try to minimize this effect and argue for any exceptions that are closely linked to the individual country. Some countries’ households might show a higher interest in any specific financial assets class that are linked to their history or to the social system of the country.
4.2 Correlation and Pearson coefficient
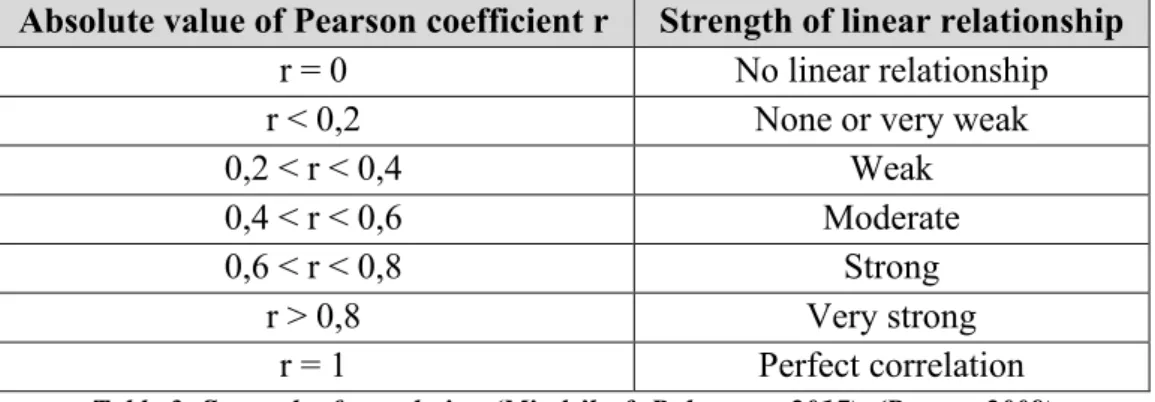
Correlation is a statistical measure that is used to determine the relationship between two variables. (Taylor, 1990) This relationship is determined by so called Pearson coefficient “r” which it represents the value range between -1 and +1. If there was calculated value higher than +1 or lower than -1, then there was made a mistake in a measurement. Correlation coefficient “r” represents number on a scale from -1 to +1. (Godfrey, 1980) Both values -1 and +1 represent the perfect correlation. In case of perfect negative correlation (-1), the relationship in variables can be explained as “the greater the value of the first variable the lower the value of the second variable and vice versa”. In contrary, perfect positive correlation (+1) is determined as “the greater the value of the first variable the greater the value of the second variable and vice versa”. (Asuero, Sayago, & González, 2007) Correlation of value equal to 0 shows no linear relationship in two variables and the values can be described as “randomly positioned”.
𝑃𝑎𝑒𝑟𝑠𝑜𝑛 𝑐𝑜𝑟𝑟𝑒𝑙𝑎𝑡𝑖𝑜𝑛 𝑐𝑜𝑒𝑓𝑓𝑖𝑐𝑖𝑒𝑛𝑡 = 𝑟 = 𝑛(∑ 𝑥𝑦) − (∑ 𝑥)(∑ 𝑦)
√[𝑛 ∑ 𝑥2− (∑ 𝑥)2] ∗ [𝑛 ∑ 𝑦2− (∑ 𝑦)2] [−]
Absolute value of Pearson coefficient r Strength of linear relationship
r = 0 No linear relationship
r < 0,2 None or very weak
0,2 < r < 0,4 Weak
0,4 < r < 0,6 Moderate
0,6 < r < 0,8 Strong
r > 0,8 Very strong
r = 1 Perfect correlation
32
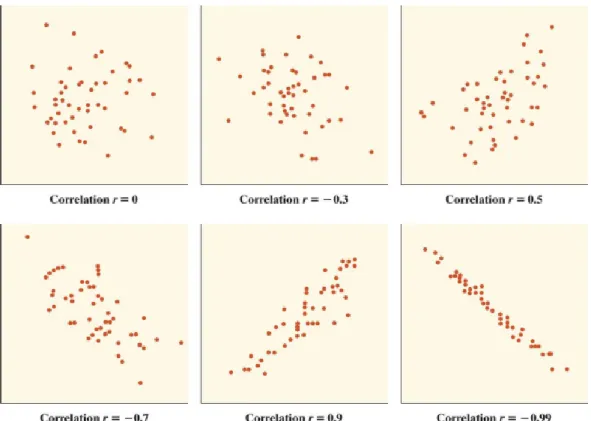
Picture 1: Correlation illustration (Mindrila & Balentyne, 2017)
Table below demonstrates all the Pearson’s correlation coefficients calculated with the Excel CORREL function, for the relevant variables.
Table 4: Pearson correlation coefficients
33 4.3 Coefficient of Determination
Coefficient of determination is used to determine how many data points fall within the result of the line formed by the correlation regression. Coefficient of determination, so called r-squared coefficient is replicated in percentage value and is calculated as “r-square” from the Pearson coefficient “r”. Therefore, the greater the number of Pearson coefficient “r” the greater the coefficient of determination.
Coefficient of Determination = r2 [%]
In the table below there are calculated all the coefficients of determination that were determined based on the relationships between the provided variables.
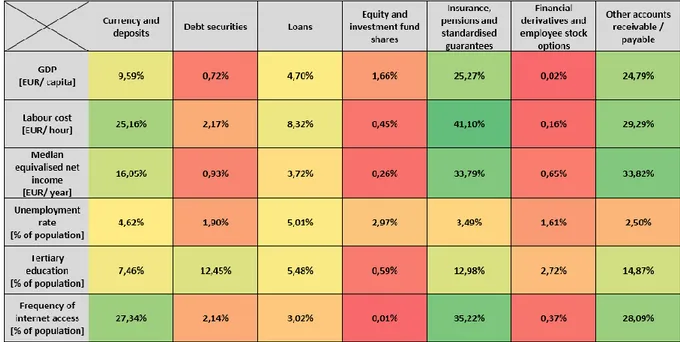
Table 5: Coefficients of Determination
34 4.4 Statistical Significance
P-value is the coefficient used for statistical significance determination of the linear correlation. Correlation relationship is usually considered significant when p-value ≤ 0,05 then the correlation is called statistically significant. Based on this knowledge every p-value ≤ 0,05 has a correlation different from 0. (Minitab, 2021)
P-value coefficient can be calculated according to this procedure:
1. Convert the Pearson correlation value “r” to “t-statistic”. For this step there is needed value for “pairs in the correlation test”.
𝑁 (𝑛𝑜. 𝑜𝑓 𝑝𝑎𝑖𝑟𝑠 𝑖𝑛 𝑡𝑒𝑠𝑡) = 29 𝑡 − 𝑠𝑡𝑎𝑡𝑖𝑠𝑡𝑖𝑐 =𝑟 ∗ √𝑁 − 2
√1 − 𝑟2 Excel formula:
𝑡 − 𝑠𝑡𝑎𝑡𝑖𝑠𝑡𝑖𝑐 = (𝑟 ∗ (𝑆𝑄𝑅𝑇(𝑁 − 2)))/(𝑆𝑄𝑅𝑇(1 − 𝑟^2))
* When the Pearson correlation coefficient “r” is negative value, use the ABS value to get a positive value because otherwise it would bring up an error.
2. Final step is to convert “t-statistic” into “p-value”. This can be done using the followed formula. 𝐷𝐹 (𝐷𝑒𝑔𝑟𝑒𝑒 𝑜𝑓 𝐹𝑟𝑒𝑒𝑑𝑜𝑚) = 𝑁 − 2 = 27 𝑁𝐹 (𝑛𝑜. 𝑜𝑓 𝑡𝑎𝑖𝑙𝑠) = 2 Excel formula: 𝑝 − 𝑣𝑎𝑙𝑢𝑒 = 𝑇𝐷𝐼𝑆𝑇(𝑡 − 𝑠𝑡𝑎𝑡𝑖𝑠𝑡𝑖𝑐; 𝐷𝐹; 𝑁𝐹)
35
Table below shows the statistically significant coefficients and their relationship between two variables.
Table 6: Statistical significance coefficients
p-value= 0,00 p-value= 1
Table below represents all the relationships including both variable classes, household asset management and the degree of development class.
36
5
Results
The main goal is to draw conclusions based on the results that appeared after proper correlation determination process. With the Pearson correlation coefficient, the knowledge of whether the relationship is negative or a positive correlation between two variables have been found. This research managed to define the coefficient of determination and calculated the p-value of statistical significance. For this research it is considered that p-value ≤ 0,05 as statistically significant. However, it was decided to take in account p-value ≤ 0,1 which is still considered as statistically significant. This is because the aim is to bring up more complex explanation of the outcomes. Based on the p-value, the results are therefore divided into 4 different parts according to household asset management class and are meant to prove the relevance of such relationship with statistically significant counterparts from the degree of development class variables.
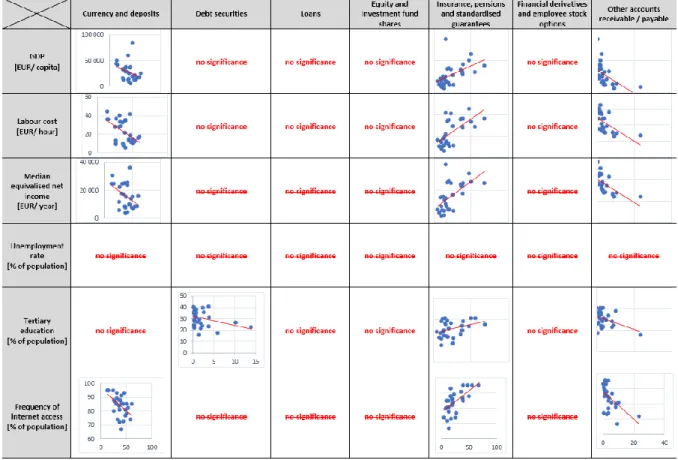
Table below refers to relevant data outcomes. This table also points at the conclusion that there was no statistically significant relationship found for Loans, Equity and investment fund shares and Financial derivatives and employee stock options as for the household asset management class variables with their degree of development counterparts variables. While at the same time no significant correlations for Unemployment rate from the degree of development class was found. Therefore, the result ended up having 15 statistically significant correlating relationships that were concluded as the ones on which would like to draw the conclusions of this research.
37
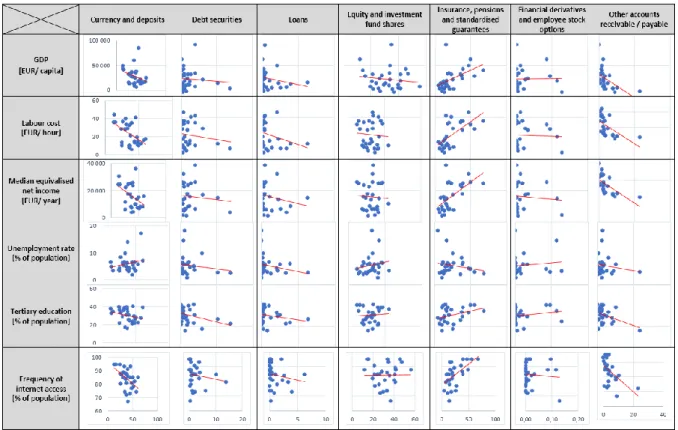
Based on the relevant statistically significant relationships shown below it can be concluded as a summary of scatterplots that will be explained in more detailed analysis in the following chapter. The table below shows the correlation patterns determined after a close factor analysis.
38 5.1 Statistically significant relationships
5.1.1 Relationships related to Currency and Deposits
AT BE BG CY CZ DE DK EE EL ES EU FI FR GB HR HU IE IT LT LU LV MT NL PL PT RO SE SI SK y = -426,17x + 43749 R² = 0,0959 0 10 000 20 000 30 000 40 000 50 000 60 000 70 000 80 000 90 000 0 10 20 30 40 50 60 70 G DP [EUR/ c ap ita ]
Currency and deposits [%]
AT BE BG CY CZ DE DK EE EL ES EU FI FR GB HR HU IE IT LT LU LV MT NL PL PT RO SE SI SK y = -0,4955x + 41,491 R² = 0,2516 0 5 10 15 20 25 30 35 40 45 50 0 10 20 30 40 50 60 70 La b o u r c o st [EUR ]
39 AT BE BG CY CZ DE DK EE EL ES EU FI FR GB HR HU IE IT LT LU LV MT NL PL PT RO SE SI SK y = -0,3269x + 96,536 R² = 0,2734 60 65 70 75 80 85 90 95 100 0 10 20 30 40 50 60 70 Freq u en cy o f i n terne t ac ce ss [% of po p u la ti o n ]
Currency and deposits [%]
AT BE BG CY CZ DE DK EE EL ES EU FI FR HR HU IE IT LT LU LV MT NL PL PT RO SE SI SK y = -288,4x + 26972 R² = 0,1605 0 5 000 10 000 15 000 20 000 25 000 30 000 35 000 40 000 0 10 20 30 40 50 60 70 M e d ia n eq u iv al is e d n e t in co me [E UR / ye ar ]
40
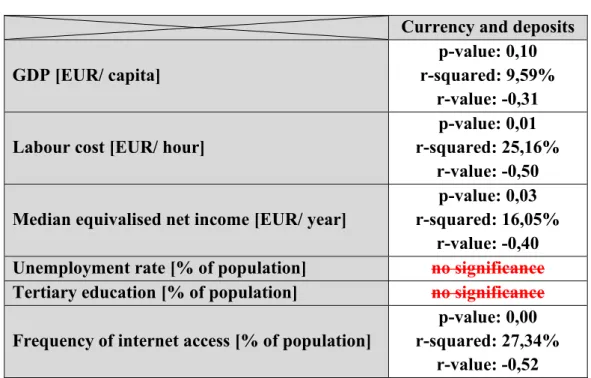
Currency and deposits prove 4 statistically significant relationships with their counterparts from the Degree of development class. These are GPD per capita, Labour cost, Frequency of internet use and Median equivalised net income. All the significant relationships are characterised as moderate negative correlations, which are ranging from -0,31 to -0,52. The most significant relationship is seen with frequency of internet access where p-value is equal to 0,00 with almost 27,34% coefficient of determination. Here it can be concluded that the more currency and deposits households hold the less time they spend being active at internet and vice versa. This realtionship is explained with negtive correlation of r-value equal to -0,52. This is followed by labour cost and its relationship to currency and deposits household holding, where there is p-value equal to 0,01 and the coefficient of determination almost 25,16%. This shows that it also proves the conclusion that there is a statistically significant negative correlation of - 0,5. It concludes the outcome that the more currency and deposits european union households hold the lower the labour cost per hour. Pointing at the relationship to GDP it shows that there is a good reason to conclude that households in economically less developed countries tend to have their assets more in currencies and deposits in comparison with countries that are more economically powerful.
This also goes hand in hand with the relationship found between currency and deposits and median equivalised net income, where there is also significant negative correlation of -0,4 with p-value 0,03 and the coefficient of determination equal to 16,05%.
There is also a strong statistical significance in relationship betweeen currency and deposits and GDP per capita. P-value is equal to 0,1 also showing the negative correlation of -0,31 and the coefficient of determination equal to 9,59%.
In this research it was not possible to prove any significant relationship between currency and deposits and the unemployment rate and tertiary education attainment in population.
Currency and deposits GDP [EUR/ capita]
p-value: 0,10 r-squared: 9,59%
r-value: -0,31 Labour cost [EUR/ hour]
p-value: 0,01 r-squared: 25,16%
r-value: -0,50 Median equivalised net income [EUR/ year]
p-value: 0,03 r-squared: 16,05%
r-value: -0,40 Unemployment rate [% of population] no significance
Tertiary education [% of population] no significance
Frequency of internet access [% of population]
p-value: 0,00 r-squared: 27,34%
r-value: -0,52 Table 10: Currency and deposits significant relationships