Journal for Person-Oriented Research
2020; 6(1): 28-38Published by the Scandinavian Society for Person-Oriented Research
Freely available at https://journals.lub.lu.se/jpor and https://www.person-research.org
https://doi.org/10.17505/jpor.2020.22044
28
Rank-Order of Body Shapes Reveals Internal
Hierarchy of Body Image
Revital Naor-Ziv
a, Rose King
a, and Joseph Glicksohn
a,ba Department of Criminology, Bar-Ilan University, Israel
b The Leslie and Susan Gonda (Goldschmied) Multidisciplinary Brain Research Center, Bar-Ilan University, Israel
Corresponding author: Joseph Glicksohn, Ph.D., Department of Criminology, Bar-Ilan University, Ramat Gan, 52100, Israel
E-mail: gliksoj@biu.ac.il Orcid ID: 0000-0001-5584-177X Fax: 972-3-7384038
To cite this article:
Naor-Ziv, R., King, R., & Glicksohn, J. (2020), Rank-order of body shapes reveals internal hierarchy of body image. Journal for
Person-Oriented Research, 6(1), 28-38. https://doi.org/10.17505/jpor.2020.22044
Abstract:
How do individuals rank body shapes? Does this relate to the body part one is most dissatisfied with? Our studyinvestigates whether one can generalize regarding how women represent the body. Three BMI-calibrated images from the Photographic Figure Rating Scale, representative of thin (BMI = 14.72), medium (BMI = 20.33), and large (BMI = 29.26) shapes, were divided into torso, legs and arms, and saved as individual images on a black background. Of 27 possible composite images, 8 were chosen based on a Torso (thin vs. large) × Leg (thin/large vs. medium) × Arm (thin vs. large) design. Our 44 female participants ordered these from thinnest to largest. This was first according to torso, then leg, and finally arm: 41 individuals agreed on the thinnest image (thin torso, thin legs, thin arms), followed by a second image (thin torso, thin legs, large arms, n = 26; or thin torso, medium legs, thin arms, n = 10). One participant differed markedly in her choice of the first image (large torso, medium legs, thin arms). Interestingly, she scored 10 on the EDI-2 scale of Bulimic Tendencies, revealing high risk for bulimia, suggesting that our task might be useful for studying eating disorders. Our juxtaposition of two analytic procedures—partial order scalogram analysis (POSAC) and cluster analysis—enables one to uncover such outliers in a data set. Importantly, the 2D POSAC space clearly reveals the hierarchical structure of the body image.
Keywords:
Body image; Photographic Figure Rating Scale; eating disorders; POSAC; cluster analysis.Introduction
While the notion of the body image resonates with a ge-stalt (Werner, 1965), it is nevertheless the case that women who are dissatisfied with the way they look tend to spend more time inspecting particular regions of the body (Svaldi et al., 2016). For example, a female misperception of being spatially larger can be localized to the region of the torso (Gendebien & Smith, 1992). Those having an increased drive for thinness (DT) will focus on the waist, arms, hips and legs (Hewig et al., 2008). In fact, DT is often related to body dissatisfaction (Jones et al., 2014; Keski-Rahkonen et al., 2005), and empirical evidence suggests that body image disturbances are a pivotal etiological and maintenance fac-tor of eating disorders (Ghaderi & Scott, 2001; Stice, 2002).
Given this, what is the internal hierarchy of the body image? Does one focus on the extremities (legs, arms) prior to more central regions (head, torso)? Or, does one move outwards from the center? Certainly, areas of focal interest would include the torso (Irvine et al., 2019), the legs, and the arms (Rodway et al., 2018). The torso (specifically, the chest) is perceived as being more significant than either the arm or the leg (Morrison & Tversky, 2005). Further, is there a point of reference when an individual indicates their al/ideal body shape? Presumably, this would be with re-spect to one's own BMI1 (McCabe, Ricciardelli et al., 2006,
1 Body Mass Index (weight divided by height-squared), expressed in
Journal for Person-Oriented Research, 6(1), 28-38
29 p. 164). In this study, we had two specific aims: (1) to in-vestigate the hierarchical structure of the body image using a rank-ordering task of specifically constructed body shapes; and (2) to present two analytical procedures that, when used together, enable us to portray this structure in a 2D representational space.
To investigate this rather neglected area of research, we employed images taken from the familiar Photographic Figure Rating Scale (Swami et al., 2008a, 2008b). These were divided into torso, legs and arms, from which we could construct composite images for our participants to inspect, and then to rank-order these from the thinnest to the largest body shape. A rank-ordering, or card-sorting, task has previously been employed to uncover the hierar-chical structure of a data set (Avital & Cupchik, 1998), and to “allow the natural structure of conceptual systems to emerge” (Gabe-Thomas et al., 2016, p. 3). With respect to the body image, such a task has been employed to order female body photographs in terms of increasing BMI (Schuck, Munsch, & Schneider, 2018), and to order various body parts (e.g., arm, leg) in terms of significance (Morri-son & Tversky, 2005, pp. 700-701). Hence, the purpose of this rank-ordering task in our study is to uncover the hier-archical structure of the body image.
How should one analyze such rank-ordering data? In or-dering the images from thinnest to largest, an individual profile is generated. The set of profiles created will be ana-lyzed using both cluster analysis (Vargha et al., 2016) and scalogram analysis (Shye, 2007), and subsequently the cluster-analytic solution will be superimposed on the sca-logram space. Given the fact that one of our participants exhibited markedly aberrant performance on the task, this juxtaposition of analytic procedures will serve the addi-tional diagnostic goal of uncovering outliers in a data set.
Method
Participants and design
Forty-four female undergraduate university students par-ticipated in this study on a voluntary basis. They signed an informed consent form, and the study was approved by the ethics committee of Bar-Ilan University. They were ran-domly assigned to one of four groups each containing 11 participants (see below). This sample size and group allo-cation is comparable to that recently reported by Irvine et al. (2019) when assessing body image. If 20-30 participants are sufficient for a rank-ordering study (Gabe-Thomas et al., 2016, p. 4), then, again, our sample size should be ade-quate.
Measures
We employed three scales taken from the Eating
der Inventory-2 (EDI-2; Garner, 1991), which is one of the most widely used self-report questionnaires for assessing psychological characteristics related to ED pathology among Western populations (Garner, 1991; Strien & Ouwens, 2003). These were Drive for Thinness (DT); Bu-limic Tendencies (B); and Body Dissatisfaction (BD). Following Garner's instructions, item-responses ranging from 1 to 6 are forced into a 4-point scale, with the most extreme anorexic response earning a score of 3, the high-est-but-one response receiving a score of 2, the next sponse being awarded 1, and the three least "anorexic" re-sponses all receiving a score of 0 (transformed item scores). Weight and height were self-reported, as part of the EDI-2 questionnaire. In addition, the participant was asked which part of the body she was most satisfied with and which part she was most dissatisfied with.
The Photographic Figure Rating Scale (PFRS) measures Body Dissatisfaction, and for our purposes Body Image. The participants are asked to choose which figure sents their current body image (B), and which figure repre-sents their ideal body image (I). The 10 PFRS images are calibrated with BMI, as follows: Image 1 (BMI = 12.51); Image 2 (BMI = 14.72); Image 3 (BMI =16.65); Image 4 (BMI = 18.45); Image 5 (BMI = 20.33); Image 6 (BMI = 23.09); Image 7 (BMI = 26.94); Image 8 (BMI = 29.26)2; Image 9 (BMI = 35.92); Image 10 (BMI = 41.23), as re-ported by Swami et al. (2008b). We distinguish between body size distortion, which contrasts current body image (B) with actual body image (this distortion is concretized here as the discrepancy between the BMI for B and self-reported BMI), and body size dissatisfaction, which contrasts B and ideal body image (I).
Standard presentation of these images is in ascending order from left to right. Furthermore, first B is indicated, and then I. In the present study, we employed two orders of presentation: ascending (a) and descending (d). We also presented the two tasks (B, I) in two orders. Crossing these two factors of Order of Presentation and Task resulted in 4 series of tasks, each presented to a separate group of 11 participants: Group 1 (Ba, Bd, Ia, Id); Group 2 (Bd, Ba, Id, Ia); Group 3 (Ia, Id, Ba, Bd); and Group 4 (Id, Ia, Bd, Ba).
In controlling for the order of presentation of the images, we can address the question of whether in viewing the de-scending series, our participants “will reach a final judg-ment of their body size that is too large”, while when viewing the ascending series, they “will reach a final judg-ment that is too thin” (Gardner & Brown, 2011, p. 741). In controlling for the order of presentation of the two tasks (B, I), we can address the requirement that separate presen-tation orders are needed when participants make “current and ideal figure ratings” (Swami, Cavelti, Taylor, & Tovée, 2015, p. 32).
2 And yet, Swami et al. (2008a, p. 226) report for this same image a
30
Rank-Ordering Task
Image 2 (BMI = 14.72), Image 5 (BMI = 20.33), and Image 8 (BMI = 29.26) of the PFRS were manipulated us-ing Adobe Photoshop, set to 600 pixels per square inch for all stages. These images, which are equidistant on the PFRS, were chosen to be representative of thin, medium, and large body shapes. Each was divided into torso, legs, and arms, and these body parts were saved as individual images (130 mm × 130 mm). These isolated body parts were used to construct 27 composite images, each placed on a black background, and slightly edited to appear more real. Seven of these images were eliminated due to their grotesque na-ture (i.e., the particular composite image is blatantly mal-formed). From the remaining images, a total of 8 were chosen for the rank-ordering task, based on a Torso (thin vs. large) × Leg (thin/large vs. medium) × Arm (thin vs. large) design. These images appear in Figure 1. The images were printed on separate cards. These were presented to the par-ticipant in a random order (achieved by shuffling the cards before the participant). The task presented to the participant was to order the images from thinnest to largest.
Procedure
The participant first completed the 4 PFRS tasks in the order determined by her group affiliation. She then com-pleted the rank-ordering task. At the end of the session, she completed the EDI-2 scales, printed as a questionnaire.
Analytical Procedures
We employ two analytical procedures for investigating the hierarchical structure of our rank-ordering profile data. One is cluster analysis, which groups the various profiles into clusters, such that the basis for forming the clusters (e.g., a similar focus on the torso in our data), the number of clusters (e.g., torso, legs, etc.), and their linkage indicate how the body image is represented. The other is partial- order scalogram analysis, which maps these profiles into a 2D representational space, such that the basis for partition-ing this space (e.g., a dimension of center-extremities in our data) indicates whether the body image has a unidimen-sional mapping or requires two dimensions, and what those dimensions reflect in the data. By embedding the clus-ter-analytical solution within the 2D representational space (e.g., Shepard, 1980), a better understanding of the hierar-chical structure of the body image will be obtained.
Figure 1.
The 8 images used for the rank-ordering task. Image 1 (= thin torso, thin legs, thin arms*); image 2 (= thin torso, thin legs, large arms); image 3 (= thin torso, medium legs, thin arms); image 4 (= thin torso, medium legs, large arms); image 5 (= large torso, large legs, thin arms); image 6 (= large torso, large legs, large arms*); image 7 (= large torso, medium legs, thin arms); and image 8 (= large torso, medium legs, large arms).
31
Results
Performance on the PFRS
Current, or perceived, body image was uniformly higher in BMI than ideal body image [F(1, 39) = 32.42, MSE = 1.52, p < .0001], as can be seen in Figure 2, which is as one would expect, and this effect is not moderated by Group (as defined by crossing task with order of presentation) [F(3, 39) < 1]. Furthermore, the higher the participant’s BMI, the more apparent is this discrepancy (on average).
Figure 2.
Body image and ideal image as a function of BMI.
Performance on the ascending and descending series is highly correlated for both perceived body image (r = .94, p < .0001) and ideal body image (r = .72, p < .0001), and the discrepancy score (i.e., the difference between these re-spective means) between the two series is practically zero for both perceived and ideal body image [t(43) < 1 for both].
Performance on the rank-ordering task
Rank-ordering of body image from thinnest to largest was practically monotonic [F(7, 301) = 55.07, MSE = 2.69, p < .0001], as can be seen in Figure 3. On looking at the individual profiles, we note that 41 of our 44 participants agreed on the thinnest image, this being image #1 (thin torso, thin legs, and thin arms). Figure 4 presents the modal number of choices made for each image, and as can be seen, ordinal choice preserves an inner hierarchy of first (thin) torso (images #1, #2, #3, and #4), then (thin) leg (images #1 and #2), and finally (thin) arm (images #1, #3, #5, #7).
Figure 3.
Ordinal ranking of images (from thinnest to largest).
Figure 4.
Modal choice of images.
Aberrant performance on the rank-ordering
task
Three participants did not agree with the others on the thinnest image (i.e., thin torso, thin legs, thin arms—see Figure 1). These were participants #34 and #40, both of whom placed image #2 (i.e., thin torso, thin legs, large arms; see Figure 1) in first rank order of thinness. Even given this discrepancy, the hierarchical order of first torso, then legs, is preserved. In contrast to these, participant #11 chose im-age #7 as being the thinnest. This imim-age (i.e., large torso, medium legs, thin arms; see Figure 1) is clearly deviant, as is the participant herself, who scored 10 on the EDI-2 scale of Bulimic Tendencies, revealing high risk for bulimia, suggesting that our task might be useful for studying eating disorders.
32
Profile analysis
Given the nature of our rank-ordering task, the individual profile generated necessarily presents correlated choices. To alleviate this situation, we shall look at only the first five ratings, and submit this truncated profile to cluster analysis. Even though the data are clearly ordinal in nature, cluster analysis can still be employed here (Mooi, Sarstedt, & Mooi-Reci, 2018, p. 337). Figure 5 presents the dendro-gram obtained for the top four branches of the clustering solution provided by Stata, on implementing Ward’s hier-archical method (using the squared Euclidean distance met-ric); Table 1 provides summary statistics provided by the clustering module of ROPstat (Vargha, Torma, & Bergman, 2015), when employing Ward’s method followed by a k-clustering tweaking of that cluster solution, for k ranging between 2 and 6. For k = 4, the same four clusters are un-covered; at this level, ESS > .67 (Malmberg & Little, 2007, p. 744) and HC < 1 (Malmberg & Little, 2007, p. 744; Vargha et al., 2016, p. 81)—all of which support the k = 4 cluster solution.
In line with a reviewer's suggestion that, in addition to using Ward's method, we implement a different clustering algorithm to confirm the 4-cluster solution, we employed both the single-linkage and complete-linkage algorithms in ROPstat (for both using squared Euclidean distance, as before), followed by the k-clustering tweaking of the clus-ter solutions, as before. These two specific clusclus-tering methods were employed in line with the suggestion that "single or complete linkage would be preferable to Ward's method when the data are ordinal" (Blashfield, 1976, p.
386), as indeed is the case with our data. Table 2 summa-rizes the results of these analyses.
As before, for k = 4, ESS > .67 and HC < 1. We note that it is the specific implementation of a hierarchical clustering method, followed by a k-clustering tweaking of the solution (Bergman, Vargha, & Kövi, 2017, p. 52) that leads to this convergence in solutions. Without the follow-up tweaking of the solution, there would be a discrepancy in the results, though as Vargha et al. (2016, p. 79) note, "good algorithms tend to produce similar findings."
Figure 5.
The dendrogram obtained for the top 4 branches of the clustering solution.
Table 1.
Comparison of two- to six-cluster solutions, adopting Ward’s method followed by k-clustering.
k Point-biserial correlation (PBC) Silhouette coef-ficient (SC)
Cluster homogeneity co-efficient (HC), when variables are
standard-ized
Explained Error Sum of Squares (EESS) expressed
as a percentage 2 .50 .75 1.56 34.92 3 .54 .79 1.18 53.71 4 (8, 19, 5, 12) .64 .85 0.77 70.76 5 .70 .87 0.39 78.41 6 .70 .91 0.28 86.01
Journal for Person-Oriented Research, 6(1), 28-38
33
Table 2.
Two- to six-cluster solutions, comparing single linkage to complete linkage, each followed by k-clustering
k Point-biserial correlation (PBC) Silhouette coef-ficient (SC)
Cluster homogeneity co-efficient (HC), when variables are
standard-ized
Explained Error Sum of Squares (EESS) expressed
as a percentage Single linkage 2 .41 .67 1.59 28.90 3 .65 .79 1.19 53.75 4 .64 .85 0.77 70.76 5 .70 .87 0.39 78.41 6 .70 .91 0.35 86.01 Complete linkage 2 .50 .75 1.59 34.92 3 .65 .79 1.19 53.75 4 .64 .85 0.78 70.76 5 .70 .87 0.39 78.41 6 .70 .91 0.28 86.01 Figure 6.
34
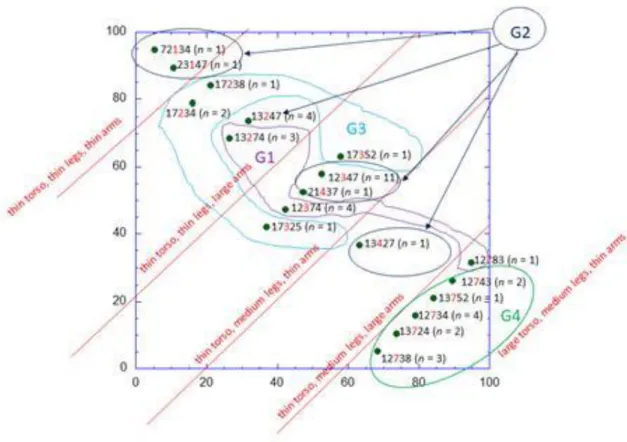
Figure 7.
Superimposition of the four clusters onto the POSAC space.
A second way to analyze the data is to conduct a par-tial order scalogram analysis by coordinates (POSAC) cedure, as described by Shye (2007). The same set of pro-files analyzed above using cluster analysis comprises a scalogram (Shye, 1998, p. 163). Figure 6 is the 2D space in which the various profiles can be mapped, as provided by the POSAC module of Hudap (Shye, 2007). Note the fol-lowing: (1) the profiles lie on the top-left to bottom-right diagonal, indicating a unidimensional mapping (Merschrod, 1980, p. 636), hence one does not need to consider the 2D coordinates (Dancer, 1990, p. 488); (2) in an attempt to interpret this space, note that a lawful partitioning can be seen when focusing on the listing of images appearing in the third ordinal position; (3) the space can be partitioned using parallel stripes (Shye, 1998, p. 165) perpendicular to this diagonal, and when these are interpreted in terms of the image appearing in the third ordinal position within the profile they indicate the hierarchical structure of the body image; and (4), the participant exhibiting aberrant perfor-mance on the task lies at the top left of the diagonal.
Figure 7 presents the superimposition of the four clusters onto this 2D space. Note the following: (1) cluster G4 is clearly marked, and its data points lie perpendicular to the main diagonal; (2) clusters G1, G2 and G3 are not clearly demarked, hence they should be merged into one large cluster, in line with the higher-order clustering appearing in
the dendrogram (Figure 5); and (3), cluster G2 decomposes into three areas, one of which appearing at the top-left of the diagonal, reflects aberrant performance on the task.
Discussion
As Figure 2 clearly shows, ideal body image is on aver-age much thinner than perceived body imaver-age, much as has been reported by others (Barnett et al., 2001; Tiggemann, 1992). This discrepancy between perceived and ideal body image reveals the degree of body size dissatifaction (Gard-ner & Brown, 2010; Swami et al., 2012), and is more ap-parent with increasing BMI, in line with the findings of others (Thaler et al., 2018; Tovée et al., 2003). Perceived body image, in turn, tends to underestimate actual body image, when viewed in terms of the corresponding BMI- calibrated figure (see Figure 2), and this discrepancy be-tween perceived and actual body image reveals the degree of body size distortion (Gardner & Brown, 2010). This ef-fect is not moderated by group, determined in part by order of presentation (i.e., ascending or descending order) of the PFRS figures, and this lack of effect for particular order of presentation is consistent with the literature (Duncan et al., 2005). Note that body size distortion, as opposed to body size dissatisfaction, can be either one of overestimation or of underestimation of body size (see Figure 2). Participant #11 who exhibits aberrant performance on our rank-
Journal for Person-Oriented Research, 6(1), 28-38
35 ordering task, and who scores high on the EDI-2 scale of Bulimic Tendencies, has a reported BMI of 29.36, roughly matching the BMI-calibrated image #8. Her perceived body image is veridical (she selected image 9 on the ascending series, and image 8 on the descending series of the PFRS), and this comes in opposition to what has been reported for anorexic women, who tend to overestimate their body size (Gardner & Brown, 2010; Hagman et al., 2015). The ideal body image she indicated was image 4 on both ascending and descending series, which is calibrated with a BMI of 18.45. This is roughly the same ideal body image selected by a bulimic participant in the study reported by Tovée et al. (2003, p. 507). Her body size dissatifaction is thus clearly marked.
Turning to our rank-ordering task, we have an answer to our initial question, and this is that one moves outwards from the center when assessing body shapes. The torso is the first area of attention (Cornelissen et al., 2016; Cundall & Guo, 2017), and if this torso is viewed against the back-ground of the whole body shape, then it should appear larger in size, much as in any figure-ground setting (Glicksohn, 1998; Glicksohn & Berkovich-Ohana, 2011). Participant #11, who chose image #7 of this task (= large torso, medium legs, thin arms) as being the thinnest, is highly deviant in this, given that image #7 is characterized by a large torso. How could such a large torso be justified as being the thinnest body shape for this participant, who is at high risk for bulimia? Tovée et al. (2003) have shown that bulimics tend to overestimate body size and, further, that their ideal body image has a significantly reduced waist and thighs. Clearly, they focus on the torso in making this choice. Given this, our participant should not have designated image #7 as being the thinnest of the series. But, one must take into consideration her own BMI of 29.36, which places her at the upper end of the BMI category of ‘overweight’ (Tovée et al., 2003, p. 503). Could her choice of thinnest image be codetermined by the images presented and by her own body image? If so, this would suggest that she is highly field dependent, and that remains an issue on our research agenda (Naor-Ziv & Glicksohn, 2016). Body self-schema (Williamson, White, York-Crowe, & Stewart, 2004) might well work in unison with field de-pendence-independence here (Basseches & Karp, 1984). We can, therefore, set ourselves a future goal of investigat-ing our rank-orderinvestigat-ing task with bulimics (or, with those at high risk for bulimia), who should display a distorted body image (Johnsson, 1993), coupled with an assessment of field dependence-independence (Glicksohn & Bozna, 2000; Glicksohn & Kinberg, 2009; Naor-Ziv & Glicksohn, 2016).
What have we learned from employing a person-oriented, data-analytic approach to the data generated by our rank-ordering task? Clearly, the 2D POSAC space neatly portrays these data, and allows us to reveal the hierarchical structure of the body image. The cluster analysis was less successful here, with cluster G2 being seen to relate to sep-arate regions of the 2D POSAC space. Could this be a
re-sult of the appearance of aberrant behavior on the rank- ordering task? Participant #11 chose image #7 as being the thinnest, and this participant is clearly seen at the top-end of the diagonal appearing in POSAC space. Participants #34 and #40 both placed image #2 in first rank order of thinness, and one of these appears next to participant #11 in the POSAC space. In fact, all three of these participants belong to cluster G2. Aldenderfer and Blashfield (1984, p. 61) have recommended that “outliers should be identified before cluster analysis is used, and each should be carefully evaluated to determine the reason it is so different from the other cases.” We suggest that rather than removing such outliers at the outset, the juxtaposition of the two analytic procedures employed here enables one to uncover such outliers in a data set. Hence, our prediction for future stud-ies in this domain, employing participants suffering with eating disorders such as bulimia, is that these individuals will be clearly indicated within POSAC space, and will be affiliated in one cluster that does not preserve a contiguous region within that space.
To sum up: We have been able to present the hierarchical structure of the body image, based in part on the high de-gree of ade-greement among our participants regarding the rank-ordering of the body shapes presented, and partly on this orderliness of their data, revealed by juxtaposing the results of the two analytical procedures of cluster analysis and POSAC. An anonymous reviewer has questioned whether different results would have been found had real body shapes been rated. Indeed, other types of body shape could be used for our rank-ordering task, and there are a number of these in the literature, such as computer- generated 3D images of a standard model that can be ma-nipulated in line with changing BMI (Cornelissen et al., 2016) and 3D body scans of the actual participant that can be modified to present different BMI versions of the par-ticipant (Thaler et al., 2018). This is certainly worthy of research attention of our colleagues who employ these tools.
Of course, the study also has a number of limitations, one of which is the relatively small sample size, though samples of comparable size have previously been reported in the literature when studying the body image (e.g., Thaler et al., 2018) or when employing a rank-ordering task (Böhm & Pfister, 1996). Clearly, it is necessary to replicate the study in order to evaluate the degree of generalizability of the present results—both of the clustering solution and of the partitioning of the 2D POSAC space. Having sug-gested that the juxtaposition of these two analytical proce-dures also enabled us to identify an outlier—and one that may well have relevance for the future implementation of both the rank-ordering task and its data analysis in the study of eating disorders—it is important to conduct a similar study in such a population and see whether we can replicate the pattern. That is certainly a goal for our own future work in this domain.
36
Acknowledgements
We thank Geoff Cole, Mathias Hegele and two anony-mous reviewers for their helpful comments on an earlier draft of this article.
Author contributions
RK served as the experimenter in this study, which was supervised by RN-Z and JG.
Declaration of Conflicting Interests
The authors declared no potential conflicts of interest with respect to the research, authorship, and/or publication of this article.
Action editor
Lars-Gunnar Lundh served as action editor for this article.
References
Aldenderfer, M. S., & Blashfield, R. K. (1984). Cluster analysis. London: Sage.
Avital, T., & Cupchik, G. C. (1998). Perceiving hierarchical struc-tures in nonrepresentational paintings. Empirical Studies of the
Arts, 16(1), 59-70.
https://doi.org/10.2190/8YJ4-TGU8-Q32R-9FBL
Barnett, H. L., Keel, P. K., & Conoscenti, L. M. (2001). Body type preferences in Asian and Caucasian college students. Sex Roles,
45, 867-878. https://doi.org/10.1023/A:1015600705749
Basseches, H. I., & Karp, S. A. (1984). Field dependence in young anorectic and obese women. Psychotherapy and Psychosoma-
tics, 41(1), 33-37. https://doi.org/10.1159/000287783
Bergman, L. R., Vargha, A., & Kövi, Z. (2017). Revitalizing the typological approach: Some methods for finding types. Journal
for Person-Oriented Research, 3(1), 49-62.
https://doi.org/10.17505/jpor.2017.04
Blashfield, R. K. (1976). Mixture model tests of cluster analysis: Accuracy of four agglomerative hierarchical methods.
Psycho-logical Bulletin, 83(3), 377-388.
https://doi.org/10.1037/0033-2909.83.3.377
Böhm, G., & Pfister, H. R. (1996). Instrumental or emotional evaluations: What determines preferences? Acta Psychologica,
93(1-3), 135-148.
https://doi.org/10.1016/0001-6918(96)00017-0
Cornelissen, K. K., Cornelissen, P. L., Hancock, P. J., & Tovée, M. J. (2016). Fixation patterns, not clinical diagnosis, predict body size over‐estimation in eating disordered women and healthy controls. International Journal of Eating Disorders, 49(5), 507-518. https://doi.org/10.1002/eat.22505
Cundall, A., & Guo, K. (2017). Women gaze behaviour in as-sessing female bodies: the effects of clothing, body size, own body composition and body satisfaction. Psychological
Re-search, 81(1), 1-12. https://doi.org/10.1007/s00426-015-0726-1
Dancer, L. S. (1990). Suicide prediction and the partial order sca-logram analysis of psychological adjustment. Applied
Psychology: An International Review, 39(4), 479-497.
https://doi.org/10.1111/j.1464-0597.1990.tb01067.x
Duncan, M. J., Dodd, L. J., & Al-Nakeeb, Y. (2005). The impact of silhouette randomization on the results of figure rating scales.
Measurement in Physical Education and Exercise Science, 9(1),
61-66. https://doi.org/10.1207/s15327841mpee0901_5 Gabe-Thomas, E., Walker, I., Verplanken, B., & Shaddick, G.
(2016). Householders’ mental models of domestic energy con-sumption: using a sort-and-cluster method to identify shared concepts of appliance similarity. PLoS ONE, 11(7), e0158949. https://doi.org/10.1371/journal.pone.0158949
Gardner, R. M., & Brown, D. L. (2010). Body image assessment: A review of figural drawing scales. Personality and Individual
Differences, 48(2), 107-111.
https://doi.org/10.1016/j.paid.2009.08.017
Gardner, R. M., & Brown, D. L. (2011). Method of presentation and sex differences when using a revised figural drawing scale to measure body size estimation and dissatisfaction. Perceptual
and Motor Skills, 113(3), 739-750.
https://doi.org/10.2466/07.17.27.PMS.113.6.739-750 Garner, D. M. (1991). Eating Disorder Inventory-2. Professional
Manual. Florida: Psychological Assessment Resources.
Gendebien, M. L., & Smith, M. O. (1992). Field dependence and perceptual, cognitive, and affective measures of body image in asymptomatic college students. Personality and Individual
Dif-ferences, 13(8), 937-943.
https://doi.org/10.1016/0191-8869(92)90011-D
Ghaderi, A., & Scott, B. (2001). Prevalence, incidence and pro-spective risk factors for eating disorders. Acta Psychiatrica
Scandinavica, 104(2), 122-130.
https://doi.org/10.1034/j.1600-0447.2001.00298.x
Glicksohn, J. (1998). States of consciousness and symbolic cogni-tion. The Journal of Mind and Behavior, 19(2), 105-118. Glicksohn, J., & Berkovich-Ohana, A. (2011). From trance to
transcendence: A neurocognitive approach. The Journal of Mind
and Behavior, 32(1), 49-62.
Glicksohn, J., & Bozna, M. (2000). Developing a personality profile of the bomb-disposal expert: The role of sensation seeking and field dependence-independence. Personality and
Individual Differences, 28, 85-92.
https://doi.org/10.1016/S0191-8869(99)00083-5
Glicksohn, J., & Kinberg, Z. (2009). Performance on embedded figures tests: Profiling individual differences. Journal of
Indi-vidual Differences, 30, 152-162.
https://doi.org/10.1027/1614-0001.30.3.152
Hagman, J., Gardner, R. M., Brown, D. L., Gralla, J., Fier, J. M., & Frank, G. K. W. (2015). Body size overestimation and its asso-ciation with body mass index, body dissatisfaction, and drive for thinness in anorexia nervosa. Eating and Weight Disorders,
20(4), 449-455. https://doi.org/10.1007/s40519-015-0193-0
Hewig, J., Cooper, S., Trippe, R. H., Hecht, H., Straube, T., & Miltner, W. H. (2008). Drive for thinness and attention toward specific body parts in a nonclinical sample. Psychosomatic
Medicine, 70(6), 729-736.
https://doi.org/10.1097/PSY.0b013e31817e41d3
Irvine, K. R., McCarty, K., Pollet, T. V., Cornelissen, K. K., Tovée, M. J., & Cornelissen, P. L. (2019). The visual cues that drive the self-assessment of body size: Dissociation between fixation patterns and the key areas of the body for accurate judgement.
Journal for Person-Oriented Research, 6(1), 28-38
37
Body Image, 29, 31-46.
https://doi.org/10.1016/j.bodyim.2019.02.006
Johnsson, P. (1993). Anorexics and bulimics compared vis-à-vis defense, proximity, and separation. In U. Hentschel, G. J. W. Smith, W. Ehlers, & J. Draguns (Eds.), The concept of defense
mechanisms in contemporary psychology (pp. 389-403). New
York: Springer-Verlag.
Jones, L. E., Buckner, E., & Miller, R. (2014). Chronological progression of body dissatisfaction and drive for thinness in females 12 to 17 years of age. Pediatric Nursing, 40, 21-25. Keski‐Rahkonen, A., Bulik, C. M., Neale, B. M., Rose, R. J.,
Ris-sanen, A., & Kaprio, J. (2005). Body dissatisfaction and drive for thinness in young adult twins. International Journal of Eating
Disorders, 37(3), 188-199. https://doi.org/10.1002/eat.20138
Malmberg, L.-E., & Little, T. D. (2007). Profiles of ability, effort, and difficulty: Relationships with worldviews, motivation and adjustment. Learning and Instruction, 17(6), 739-754. https://doi.org/10.1016/j.learninstruc.2007.09.014
McCabe, M. P., Ricciardelli, L. A., Sitaram, G., & Mikhail, K. (2006). Accuracy of body size estimation: Role of biopsycho-social variables. Body Image, 3(2), 163-171.
https://doi.org/10.1016/j.bodyim.2006.01.004
Merschrod, K. (1980). Partial order scalogram analysis: A tech-nique for scaling qualitative data on two dimensions. Quality
and Quantity, 14(5), 635-650.
https://doi.org/10.1007/BF00152107
Mooi, E., Sarstedt, M., & Mooi-Reci, I. (2018). Market research:
The process, data, and methods using Stata. Heidelberg:
Springer.
Morrison, J. B., & Tversky, B. (2005). Bodies and their parts.
Memory & Cognition, 33(4), 696-709.
https://doi.org/10.3758/BF03195336
Naor-Ziv, R., & Glicksohn, J. (2016). Investigating cognitive deficits as risk factors for developing eating disorders during adolescence. Developmental Neuropsychology, 41, 107-124. https://doi.org/10.1080/87565641.2016.1170129
Rodway, V., Tatham, B., & Guo, K. (2018). Effect of model race and viewing perspective on body attractiveness and body size assessment in young Caucasian women: an eye-tracking study.
Psychological Research, 83, 347-356.
https://doi.org/10.1007/s00426-018-1138-9
Schuck, K., Munsch, S., & Schneider, S. (2018). Body image perceptions and symptoms of disturbed eating behavior among children and adolescents in Germany. Child and Adolescent
Psychiatry and Mental Health, 12(1), 10.
https://doi.org/10.1186/s13034-018-0216-5
Shepard, R. N. (1980). Multidimensional scaling, tree-fitting, and clustering. Science, 210(4468), 390-398.
https://doi.org/10.1126/science.210.4468.390
Shye, S. (1998). Modern facet theory: Content design and meas-urement in behavioral research. European Journal of
Psycho-logical Assessment, 14(2), 160-171.
https://doi.org/10.1027/1015-5759.14.2.160
Shye, S. (2007). Partial order scalogram analysis by coordinates (POSAC) as a facet theory measurement procedure: How to do POSAC in four simple steps. In A. Cohen (Ed.), Facet theory
and scaling: In search of structure in behavioural and social sciences (pp. 295–310). Jerusalem: Facet Theory Association.
Stice, E. (2002). Risk and maintenance factors for eating patholo-gy: a meta-analytic review. Psychological Bulletin, 128(5), 825-848. https://doi.org/10.1037/0033-2909.128.5.825
Strien, T., & Ouwens, M. (2003). Validation of the Dutch EDI-2 in one clinical and two nonclinical populations. European Journal
of Psychological Assessment, 19, 66-84.
https://doi.org/10.1027//1015-5759.19.1.66
Svaldi, J., Bender, C., Caffier, D., Ivanova, V., Mies, N.,
Fleischhaker, C., & Tuschen-Caffier, B. (2016). Negative mood increases selective attention to negatively valenced body parts in female adolescents with anorexia nervosa. PLoS ONE, 11(4), e0154462. https://doi.org/10.1371/journal.pone.0154462 Swami, V., Cavelti, S., Taylor, D., & Tovée, M. J. (2015). The
breast size rating scale: Development and psychometric evalua-tion. Body Image, 14, 29-38.
https://doi.org/10.1016/j.bodyim.2015.02.004
Swami, V., Salem, N., Furnham, A., & Tovée, M. J. (2008a). The influence of feminist ascription on judgements of women’s physical attractiveness. Body Image, 5, 224-229.
https://doi.org/10.1016/j.bodyim.2015.02.004
Swami, V., Salem, N., Furnham, A., & Tovée, M. J. (2008b). Initial examination of the validity and reliability of the female photo-graphic figure rating scale for body image assessment.
Person-ality and Individual Differences, 44(8), 1752-1761.
https://doi.org/10.1016/j.paid.2008.02.002
Swami, V., Stieger, S., Sunshine Harris, A., Nader, I. W., Pi-etschnig, J., Voracek, M., & Tovée, M. J. (2012). Further inves-tigation of the validity and reliability of the photographic figure rating scale for body image assessment. Journal of Personality
Assessment, 94(4), 404-409.
https://doi.org/10.1080/00223891.2012.660293
Thaler, A., Geuss, M. N., Mölbert, S. C., Giel, K. E., Streuber, S., Romero, J., . . . Mohler, B. J. (2018). Body size estimation of self and others in females varying in BMI. PLoS ONE, 13(2), e0192152. https://doi.org/10.1371/journal.pone.0192152 Tiggemann, M. (1992). Body-size dissatisfaction: Individual
dif-ferences in age and gender, and relationship with self-esteem.
Personality and Individual Differences, 13(1), 39-43.
https://doi.org/10.1016/0191-8869(92)90215-B
Tovée, M. J., Benson, P. J., Emery, J. L., Mason, S. M., & Co-hen‐Tovée, E. M. (2003). Measurement of body size and shape perception in eating‐disordered and control observers using body‐shape software. British Journal of Psychology, 94(4), 501-516. https://doi.org/10.1348/000712603322503060 Vargha, A., Bergman, L. R., & Takács, S. (2016). Performing
cluster analysis within a person-oriented context: Some methods for evaluating the quality of cluster solutions. Journal for
Person-Oriented Research, 2(1-2), 78-86.
https://doi.org/10.17505/jpor.2016.08
Vargha, A., Torma, B., & Bergman, L. R. (2015). ROPstat: A gen-eral statistical package useful for conducting person-oriented analyses. Journal for Person-Oriented Research, 1(1-2), 87-98. https://doi.org/10.17505/jpor.2015.09
38 Ajuriaguerra, S. E. Cleveland, M. Critchley, S. Fisher, & H. A. Witkin (Eds.), The body percept (pp. 3-8). New York: Random House.
Williamson, D. A., White, M. A., York-Crowe, E., & Stewart, T. M. (2004). Cognitive-behavioral theories of eating disorders.
Behavior Modification, 28(6), 711-738.