PREFACE
This report is the result of a market research project on the field reliability of plate heat exchangers in offshore oil and gas processes carried out by the author under the direction of Alfa Laval during September 2002 to September 2003.
The report is the final part of my Master Degree in Industrial Engineering and Management. The degree is awarded by Lund Institute of Technology, Lund University, Sweden.
I would like to thank all the employees within Alfa Laval who have contributed with their knowledge and support to this project. I would also like to thank the maintenance personnel and process engineers at the oil and gas companies who have provided valuable feedback.
I address a special thanks to my coach in this project, Tobias Svensson at Alfa Laval Oil & Gas Technology, for great support and dedication.
Finally, I would like to thank my supervisor in writing this report, Bertil Nilsson at the Division of Production Management, Lund Institute of Technology, for all help.
Lund, December 2003
Field reliability of plate heat exchangers in oil and gas processes
- a market perspective
By Lisa Rydén
ABSTRACT
In the offshore industry, reliability of installed equipment is of paramount concern due to safety, environmental and economic consequences. The costs of unplanned shutdowns and maintenance have high economic implications and are of increasing importance with tighter profit margins. Reliability is therefore of significance when selecting equipment model and brand.
This report presents a survey of the field reliability of Alfa Laval plate heat exchangers in offshore oil and gas processes with main focus on failure data. Because of the increasing attention paid to the relationship between optimised maintenance and the achievement of field reliability, preventive maintenance practices are also included in the survey. Whether a product is reliable or not is in the end determined by the users. The users attitudes regarding Alfa Laval reliability are therefore surveyed as well. The method chosen was a cross-sectional survey focusing on quantitative primary data. Data was collected by using self-administered questionnaires distributed by e-mail to maintenance personnel and process engineers at offshore oil production platforms. Valid responses were received for a total of 174 installations, including 309 units at 60 platforms in nine countries.
For 65% of the surveyed installations, respondents reported no failures, 25% one failure and only 10% two or more failures. A total of 104 failures were reported. The average failure rate based on reported failures was estimated to 6,14 failures/106 h. As a comparison, 114 failures/106 h correspond to one failure a year. There is a risk that all failures have not been reported and the estimated failure rate should therefore be seen as some kind of minimum value. It should be noticed that findings of previous and related research indicate that in offshore oil and gas processes the estimated failure rate of plate heat exchangers are lower than the failure rate including all heat exchanger types.
Failure causes reported in the survey are generally the result of either none or incorrect maintenance, or unsuitable operating conditions which the survey have given many specific examples of. External leakage was the most commonly reported fault mode with 45% of the failures. This fault was generally due to gasket wear-out or gasket blow-out. Overall the most commonly reported corrective maintenance action
was replacement of a few or all plates (including gaskets). Recurring failures appear to be due to a lack of identifying the root cause of the problem, which can lie outside of the plate heat exchanger, leading to inappropriate corrective maintenance actions. The majority of all reported failures, 56%, did not have any negative influence on the production process at the platform, only 16% of the failures were reported to have caused a process shutdown.
Maintenance practices vary broadly between the oil and gas companies and platforms but generally no or little preventive maintenance is carried out on the heat exchangers on a regular basis. Opening the unit for inspection, manual cleaning and the replacement of parts are most often only carried out on units that currently have or recently had failures.
Overall, the end users’ attitudes and perceptions of the reliability of Alfa Laval and its products and support are very positive reflecting the few reported failures. 88% of the respondents consider the Alfa Laval plate heat exchanger to be a reliable or very reliable product.
Funktionssäkerhet hos plattvärmeväxlare installerade i olja- och
gasprocesser
- ett marknadsperspektiv
av Lisa RydénSAMMANFATTNING
Inom offshoreindustrin är funktionssäkerheten hos installerad utrustning av stor betydelse på grund av säkerhetsmässiga, miljömässiga och ekonomiska aspekter. Kostnaden för oplanerade stopp och underhåll har omfattande ekonomiska konsekvenser vilkas betydelse ökar med allt snävare vinstmarginaler. Funktionssäkerhet är därför av vikt vid val av typ av utrustning och leverantör.
Denna rapport behandlar en undersökning av funktionssäkerheten hos plattvärmeväxlare levererade av Alfa Laval och installerade i olja- och gasprocesser. Fokus i undersökningen är feldata. På grund av det ökade intresset för sambandet mellan optimerat underhåll och en hög funktionssäkerhet så är förebyggande underhållsrutiner också inkluderat i undersökningen. I slutändan är det användarna av en produkt som avgör då funktionssäkerheten är tillräckligt hög. Användarnas uppfattning om funktionssäkerheten undersöks därför också.
Undersökningsmetoden var en tvärsnittsstudie med huvudsakligen kvantitativa primärdata. Data samlades in genom skriftliga enkäter distribuerade med e-mail till underhållspersonal och processingenjörer på oljeplattformar. Besvarade enkäter erhölls för 174 installationer, vilka inkluderar 309 enheter på 60 plattformar i nio länder.
För 65 % av de undersökta installationerna rapporterades inga fel, för 25 % ett fel och för 10 % två eller fler fel. Totalt rapporterades 104 fel. Den genomsnittliga felintensiteten baserat på rapporterade fel uppskattades till 6,14 fel/106 timmar. Som en jämförelse kan nämnas att 114 fel/106 timmar motsvaras av ungefär ett fel om året i genomsnitt. Det finns en risk att alla fel inte har rapporterats och den uppskattade felintensiteten ska därför ses som ett minimivärde. Det bör uppmärksammas att resultat från relaterade undersökningar indikerar en lägre felintensitet för just plattvärmeväxlare än värmeväxlare i allmänhet.
Med antagande om en bra design, är i undersökningen rapporterade felorsaker resultatet av inget eller felaktigt underhåll eller olämpliga driftsförhållanden vilka undersökningen gett många specifika exempel på. Externt läckage var den mest rapporterade typen av funktionsfel med 45 % av felen. Denna typ av funktionsfel var
generellt sett orsakad av packningsförslitning eller packningsförskjutning. Den mest rapporterade typen av avhjälpande underhåll var byte av några eller alla plattor (packningar inkluderat). Återkommande fel verkar bero på en brist att identifiera rotorsaken till felet som kan ligga utanför värmeväxlaren. Detta leder till olämpligt eller otillräckligt avhjälpande underhåll.
Majoriteten av alla rapporterade fel, 56 % hade ingen negativ inverkan på plattformens produktionsprocess, endast 16 % rapporterades ha orsakat ett stopp.
Underhållsrutiner varierar mellan de olika olja- och gasbolagen och plattformarna men generellt sett utförs ingen eller lite förebyggande underhåll på värmeväxlarna. Att öppna enheten för inspektion, manuell rengöring och byte av reservdelar utförs oftast bara på enheter som har eller nyligen har haft fel.
Användarnas uppfattning om funktionssäkerheten på Alfa Lavals värmeväxlare var positiv vilket reflekterade att så få fel rapporterats. 88 % av de som deltog i enkäten ansåg Alfa Lavals värmeväxlare vara tillförlitliga eller mycket tillförlitliga.
CONTENTS
1 INTRODUCTION... 9 1.1 BACKGROUND... 9 1.2 PRESENTATION OF PROBLEM... 9 1.3 RESEARCH SCOPE... 10 1.4 OBJECTIVES... 10 1.5 STAKEHOLDERS... 11 1.6 OVERVIEW OF REPORT... 11 2 RELIABILITY THEORY... 13 2.1 WHAT IS RELIABILITY?... 13 2.2 WHY IS RELIABILITY IMPORTANT? ... 142.3 QUANTIFYING AND EVALUATING RELIABILITY... 15
2.4 PRINCIPLES OF ACHIEVING PRODUCT RELIABILITY... 20
3 SURVEY ENVIRONMENT... 23
3.1 ALFA LAVAL - THE SUPPLIER... 23
3.2 THE OFFSHORE INDUSTRY – THE OPERATORS... 25
3.3 PLATE HEAT EXCHANGERS – THE PRODUCT... 28
3.4 THE HEAT EXCHANGER MARKET - THE COMPETITION... 32
3.5 RELATED RESEARCH FINDINGS... 33
4 METHOD... 37
4.1 CHOICE OF METHOD... 37
4.2 SURVEY PROCEDURE... 38
4.3 TARGET POPULATION AND FRAME... 39
4.4 FINDING RESPONDENTS... 39
4.5 DATA COLLECTION PROCESS... 40
4.6 CODING AND INTERPRETATION OF DATA... 42
4.7 RELIABILITY AND VALIDITY... 43
5 SURVEY RESULTS ... 47
5.1 CHARACTERISTICS OF SURVEYED INSTALLATIONS... 47
5.2 FAILURE DATA... 48
5.3 PREVENTIVE MAINTENANCE... 53
5.4 END USER ATTITUDES ON ALFA LAVAL RELIABILITY... 57
5.5 OTHER OBSERVATIONS... 60
6 DISCUSSION AND CONCLUSIONS ... 63
6.1 FAILURE DATA... 63
6.3 END USER ATTITUDES ON ALFA LAVAL RELIABILITY... 68
6.4 IMPROVEMENTS ON FIELD RELIABILITY... 68
6.5 GENERALISABILITY AND LIMITATIONS... 70
6.6 PROJECT EVALUATION... 70
REFERENCES ... 73
APPENDICES ... 75
APPENDIX 1:DEFINITIONS... 75
APPENDIX 2:WHAT IS A PLATE HEAT EXCHANGER?... 77
APPENDIX 3:WHAT IS A SHELL AND TUBE HEAT EXCHANGER?... 78
APPENDIX 4:ORIGINAL QUESTIONNAIRE... 79
1 INTRODUCTION
This chapter provides a brief introduction to the research project. The background, problem, objectives, scope and stakeholders of the research are presented. An overview of the report with brief details on the content of each chapter is also given.
1.1 Background
In the offshore industry, reliability of installed equipment is of paramount concern due to safety, environmental and economic consequences. The costs of unplanned shutdowns and maintenance have high economic implications and are of increasing importance with tighter profit margins. Reliability is therefore of significance when selecting equipment model and brand.1
Alfa Laval has delivered plate heat exchangers (PHEs) for use in oil and gas processes to the offshore industry all over the world for more than 30 years. Their products are known for good design and manufacturing processes as well as advanced technology, all of which contribute to product reliability. But how is the equipment working in real life operational conditions? For Alfa Laval, as a supplier, data on both success and failure is necessary to evaluate their products’ influence on the reliability of their customers’ processes. A confirmation of field reliability would be an effective sales argument.
Reliability in the field is based upon practice in installation, operation and maintenance of equipment. Therefore, reliability field data must originate from end users and on-site maintenance records.2 In most cases Alfa Laval does not receive any systematic feedback including reliability data.
1.2 Presentation of problem
Alfa Laval wishes to evaluate the field reliability of PHEs in oil and gas processes. In order to do this, data from the end users needs to be collected.
The task is therefore to carry out a survey of the field reliability of Alfa Laval plate heat exchangers in oil and gas processes through the collection and analysis of operational data from end users. Findings of previous and related research will also be reviewed.
The main focus of the survey is on failure data with the following specific questions: 9 How common is the occurrence of failure for PHEs in oil and gas processes? 9 What is the failure rate of Alfa Laval plate heat exchangers in offshore oil and
gas processes?
9 What are the most common fault modes and failure causes?
1
www.oreda.com
2
9 What do the operators do to correct the failures and what are the failures’ influences on the processes?
Because of the increasing attention paid to the relationship between optimised maintenance and the achievement of field reliability the practice of preventive maintenance will also be included in the survey.
When is a product reliable enough? One way of answering this question could be: when the users of the product consider it reliable. Therefore the end users’ attitudes regarding the reliability of Alfa Laval and its products and services were also surveyed.
1.3 Research scope
The survey will only include offshore, not onshore, installations. The reason is that this is a well-defined population. Borders between onshore plants in the oil and gas and associated industries, for example refineries, can be unclear.
Only process PHEs will be included in the survey. In this context, process PHEs are included in the topsides equipment on the platform, which are part of the oil production process and exclude small utility heat exchangers such as lube oil coolers. There are several motives for this limitation. Reliability of the process heat exchangers is much more critical than for utility heat exchangers. It is also very difficult to get reliable data on the utility heat exchangers because records are not usually kept.
1.4 Objectives
The main objective of this project is to evaluate the reliability of plate heat exchangers in offshore oil and gas processes, with main focus on failure data, through the collection and analysis of operational data from end users and by studying findings of previous and related research. An overall objective is to gain knowledge and understanding of the installed base and its users with focus on reliability and maintenance.
Detailed objectives:
9 Create a common language for the concept of reliability within Alfa Laval Oil & Gas Technology
9 Sharing of real life operational experience in a systematic way by creating a reliability database
9 Exploring possible improvements of field reliability
9 Provide input to marketing material such as case stories and technical paper 9 Possibility of using the evaluation for benchmarking
1.5 Stakeholders
The major interest group for this research project are the employees at Alfa Laval Oil & Gas Technology and their sales representatives around the world. The intention is that this research will both add knowledge and be of practical use for this group. They can use collected data and this report to learn more about the concept of reliability and real life operational experiences. They can also find references to use for marketing purposes.
The oil and gas industry is another interest group who can learn more about reliability and maintenance of PHEs in oil and gas processes. There has been a demand from the market regarding this type of information.
Stakeholders are also university students or other persons interested in market research projects, report writing or any issues covered in the report.
1.6 Overview of report
The six chapters of this report can be divided into four parts: I: Introduction, II: Framework, III: Method and IV: Findings. They are followed by References and Appendices. Appendix 1 is a collection of definitions of words that can be useful to know. The parts and chapters of the report and a brief description of their contents are presented on next page.
To get a complete understanding of the research project it is suggested to read all chapters in order. For those with lack of time and those who are mostly interested in the findings of the survey, Part I: Introduction and Part IV: Findings, should give sufficient information.
PART I INTRODUCTION
PART II FRAMEWORK
PART III METHOD
PART IV FINDINGS
Chapter 2: Reliability theory
The purpose of this chapter is to put the research questions into a theoretical framework, which is used both in the choice of method and the interpretation of data. A definition of the term reliability is given. The need for reliability is discussed as well as how it is assessed and achieved.
Chapter 3: Survey environment
An overview of the complex environment of the research, which is important, both for the choice of method and in the development of conclusions. Alfa Laval, the offshore industry, the PHE and its market is presented. Previous studies in the field are also reviewed.
II
III
Chapter 4: Method
In this chapter the research method is discussed and described. First the general basis for choice of method is presented. Next the survey procedure is described. Finally the reliability and validity of the research is discussed.
Chapter 5: Survey results
The purpose of the chapter is to present the results from the survey in an objective and meaningful manner. The chapter begins with a description of the characteristics of the surveyed units followed by the results in the specific areas of interest.
IV
Chapter 6: Discussion and conclusions
The results for the specific areas of interest are discussed and conclusions are made based upon the results and research framework. An evaluation of the method and the project as a whole is also given.
I
Chapter 1: Introduction
The chapter provides a brief introduction to the research project. The background, problem, objectives, scope and stakeholders of the research are presented.
2 RELIABILITY
THEORY
The purpose of this chapter is to put the research questions into a theoretical framework, which will be used both in the choice of method and the interpretation of data. First a definition of the term reliability is given. Then the need for reliability will be discussed as well how it is assessed and achieved.
2.1 What is reliability?
The achievement and assessment of product and system reliability, in the form of continued existence or functioning, has been an implicit aspect of engineering practice since the earliest times.3 In order to discuss reliability issues in a meaningful way we need a definition of the term.
Reliability is defined as the “ability of an item to perform a required function under given conditions for a given time interval”.4 In other words it is the ability of an item to function without failures.5
Consequently, a failure is defined as “the termination of an item to perform a required function”.6 The reason leading up to a failure, called failure cause, “may be the result of one or more of the following: Design failure, manufacturing failure, installation failure, misuse failure, mishandling failure, maintenance related failure”. After failure the item has a fault.7
Figure 1 The dependability of an item is the collective term used for availability and its influencing
factors; reliability, maintainability and maintenance supportability
3
Cannon, A.G. & Bendell, A (Eds). (1991) Reliability data banks
4
European Standard 13306:2001. Maintenance Terminology
5
Bergman, Bo & Klefsjö, Bengt. (1991) Kvalitet från behov till användning.
6
European Standard 13306:2001. Maintenance Terminology
7 Ibid Availability Maintenance supportability Maintainability Reliability
Reliability is an important factor in determining the availability and dependability of an item. Dependability is a “collective term used to describe the availability and its influencing factors: reliability, maintainability and maintenance supportability”, see figure 1.8
2.2 Why is reliability important?
Reliability issues are of concern both for users of products and manufacturers. Customers and manufacturers often have some experience of the frustration and costs caused by poor product reliability. If a delivered product fails often, the manufacturer will suffer high warranty costs and the customers will suffer inconvenience. Outside the warranty period, only the customer suffers directly. In any case, the manufacturer is likely to suffer from loss of reputation, probably affecting future business negatively.9 Once gained, a reputation of unreliable products may be very difficult to correct.
Reliable products will lead to happy customers but what inconveniences do unreliable products cause their users?
Failures on equipment have negative consequences, e.g:10 9 Reduced availability
9 Reduced performance
9 Influence on safety or environment 9 Costs and loss of revenue
Therefore, for users of modern engineering systems reliability is of key concern. Interest in the study of reliability is a response to the need for finding answers to specific questions such as (adopted from Cannon, A.G. & Bendell, A (Eds). (1991)
Reliability data banks) …
9 How reliable is this system, or what is its probability of surviving a specified number of
hours?
9 Which is the most reliable of a number of possible designs for a system? 9 Is it worth introducing redundancy into a design in case a component fails? 9 How is the field performance of an item affected by its conditions of use?
9 What will be the warranty, maintenance and logistic support costs for the system in the
field?
9 Can we improve the reliability and throughput of the system?
8
Ibid
9
O’Connor, Patrick D.T. (1991) Practical reliability engineering
10
In many cases, the answers to these questions will have important economic implications, for example those affecting availability of the system.
The costs of non-availability for many modern systems, particularly if unscheduled, can be very high e.g. for a radar station, a process plant or as earlier mentioned an offshore oil platform.11 The costs are associated with repair, loss of income due to loss of production time and perhaps penalty costs. Reliability together with maintainability and maintenance supportability generally affects availability as seen in figure 1.
Today, there is an increased awareness of the high costs and loss of revenue for operation, maintenance and unavailability of systems/plants/components. The reliability of a system/plant/component has implications on several of these costs. Over the lifetime of a plant/system/component these costs are in many cases higher than the capital expenditures. This is one of the factors, which have increased the interest in the Life Cycle Cost (LCC) concept.12
Life cycle cost includes all costs associated with the procurement of a plant/system/component such as capital investment, operational costs, preventive and corrective maintenance costs and costs due to unavailability. Although life cycle cost analysis is used primarily as a tool for customers in evaluating quotations there are several other areas of use. For example, suppliers can use it when trying to convince a customer of the beneficial life cycle cost of the own product compared with the competition.13
2.3 Quantifying and evaluating reliability
While the need for products to be reliable is non-controversial, the quantification and evaluation of reliability is not. O’Connor states that “argument and misunderstanding begin when we try to quantify reliability values, or try to put financial or other benefit values to levels of reliability”. 14
He emphasizes that “quality and reliability data contain many sources of uncertainty and variability which cannot be rigorously quantified”. Many of the factors arise because the involvement of people in making and using products. They are not made and used in exactly the same way. Other factors are due to the widely varying environments in which the same type of products can operate. 15
Uncertainty is also introduced owing to variations in the definitions used. Two important problem areas are the failure definition and the component boundary definition. The failure definition is subject of interpretation and whether an event should be considered a failure or not thus becomes a subjective decision. Variations in the definition of the component boundary will also give way for variations in reliability
11
O’Connor, Patrick D.T. (1991) Practical reliability engineering
12
Ahlmann, Hans. (1993) Service och underhåll.
13
Ibid
14
O’Connor, Patrick D.T. (1991) Practical reliability engineering
15
data. Questions such as: Should connecting pipes and valves be included in the component or not? need to be addressed.16
In order to achieve reliability some kind of value is needed in order to assess reliability performance, for example to choose between opposing designs and products and to assess the requirements for maintenance support and spare parts.17 A common way of specifying reliability values is as the rate of occurrence of failures denoted by λ, also called failure rate.
2.3.1 Failure rate definition
Rate of occurrence of failures or failure rate may be defined as the “number of failures of an item in a given time interval divided by the time interval”. Failure rate is generally a function of time i.e. the age of an item. “The failure rate function λ( t ) tells us how likely it is that an item that has survived up to time t, will fail during the next unit of time.” 18 Mathematically, the failure rate may be defined as:
λ( t ) · ∆t ≈ Pr( t < T ≤ t + ∆t │ T > t ) T = time to failure
∆t = unit of time
The right hand side of the equation express the probability that an item, functioning at time t, will fail during the next time interval, ( t, t + ∆t ). The approximation is sufficiently accurate when the unit of time ∆t is small. 19
In reliability literature it is suggested that failure rate vary with time according to a bathtub shape, as the graph in figure 2. The model is based on the assumption that the life of an item can be divided into three phases; the burn-in phase, the useful life phase and the wear out phase. In the beginning of the burn-in phase the number of failures may be high due to installation problems, inherent quality problems or other initial complications. Failure rate is usually decreasing as problems are solved. During the useful life phase the failure rate is typically constant with failures being externally induced, for example maintenance-induced failures of mechanical equipment. The wear out phase is characterized by an increasing failure rate as wear out of parts is increasing.2021
16
Cannon, A.G. & Bendell, A (Eds). (1991) Reliability data banks
17
Ibid
18
OREDA, Offshore Reliability Data. (2002)
19
Ibid
20
Ibid
21
Figure 2 The failure rate bathtub curve22
2.3.2 Estimation of failure rate
In the useful life phase where the failure rate is close to constant and independent of time, the failure rate function, λ( t ) = λ. This relationship is used when estimating average failure rate for a number of items.23
Assuming a constant failure rate, the estimated failure rate, λ, can be calculated as:24 λ = Number of failures/Aggregated time in service = n / τ
Aggregated time in service is usually expressed in 106 hours and consequently failure rate is expressed in number of failures per 106 hours.
The time of reference for aggregated time in service may be calendar time or operational time. Expressed in calendar time, the aggregated time in service is the interval of time between the start-up of the installation and the collection of data. The operating time is the total time the installation is in operation e.g. not out of service due to maintenance or repair. 25
Calendar time could be used instead of operating time when appropriate. Then trend analysis and failure rate estimates would be calculated on a calendar time basis. This is acceptable if run time is quite closely correlated with calendar time and if operating data is not easily obtainable. Using calendar time can be easier and cheaper. Only the start-up date for each unit and the total number of units in use need to be ascertained.26
The uncertainty of the estimated failure rate value in relation to the true value may be presented by a confidence interval. The confidence interval is the interval between the
22
OREDA, Offshore Reliability Data. (2002)
23
OREDA, Offshore Reliability Data. (2002)
24
Ibid
25
O’Connor, Patrick D.T. (1991) Practical reliability engineering
26
lower and upper s-confidence limits. For a 90% confidence interval the true value is covered by the interval with a probability of 90%.27
Assuming a constant failure rate, the failure rate data will be exponentially distributed and thus highly skewed. Under these circumstances the χ2 distribution is used for estimating the confidence limits in these circumstances.28
With n failures during an aggregated time in service τ, the 90% confidence interval is given by:
( 1/ 2τ * z0.95, 2n , 1/2τ *z0.05, 2(n+1) )
where z0.95, v and z0.05,v denote the upper respectively lower confidence limits of the χ2 distribution with v degrees of freedom.29
The formula given above for estimated failure rate is valid under the assumption of a so-called homogenous sample or for individual items. A homogenous sample means that all the items included are the same type of item operating under the same conditions. In many cases we do not have a homogenous sample i.e. we know that there is variation between sub-samples within the sample. In these situations we may decide to merge several more or less homogenous samples, into what we call a multi-sample. The estimation of an average failure rate for a multi-sample, needs a more advanced procedure than the formula *, in order to compensate for the variations. This procedure will not be given here but for those who are interested a rationale for the procedure is presented in the reference, OREDA, Offshore Reliability Data. (2002). 30
2.3.3 Critique of the assumption of a constant failure rate
The estimation of an average failure rate requires the assumption of a constant failure rate. The assumption of a constant failure rate is based on the view that any repairable system may be considered as an assembly of parts, the parts being replaced when they fail. If part times to failure are independently and identically exponentially distributed (IID exponential) the system will have a constant failure rate. 31
However, the assumption of IID exponential for part times to failure in a repairable system, and therefore the assumption of a constant failure rate, can be very misleading. Some reasons for this are (adopted from O’Connor, Patrick D.T. (1991)
Practical reliability engineering) :
9 Failure and repair of one part may cause damage to other parts. Therefore times between
successive failures are not necessarily independent.
9 Repairs do often not renew the system. Repairs are often imperfect or they introduce other
defects leading to failures of other parts.
27
OREDA, Offshore Reliability Data. (2002)
28
O’Connor, Patrick D.T. (1991) Practical reliability engineering
29
OREDA, Offshore Reliability Data. (2002)
30
OREDA, Offshore Reliability Data. (2002)
31
9 Repair personnel learn by experience, so diagnostic ability (i.e. the probability that the
repair action is correct) improves with time. Generally, changes of personnel can lead to reduced diagnostic ability and therefore more reported failures.
9 Not all part failures will cause system failures
9 Factors as on-off cycling, different modes of use, different system operating environments or
different maintenance practices are often more important than operating times in generating failure-inducing stress.
9 Reported failures are nearly always subject to human bias and emotion. What an operator
or maintainer will tolerate in one situation might be reported as a failure in another, and perception of failure is conditioned by past experience, whether repair is covered by warranty, etc. Wholly objective failure data is very rare.
9 Failure probability is affected by scheduled maintenance or overhaul. Systems, which are
overhauled often, display higher failure rates shortly after overhaul, due to disturbance of parts, which would otherwise not have failed.
9 Many reported failures are not caused by part failures at all, but by events such as
intermittent connections, improper use, maintainers using opportunities to replace ‘suspect parts’, etc.
There are certainly more to be added to this list. So, why is the constant failure rate assumption so often used considering all these problems? O’Connor states it is because it is practicable and measurable, “particularly when data are not sufficient to allow a more detailed analysis”. Sufficient reliability data is very difficult and expensive to acquire. 32
2.3.4 Other ways of evaluating reliability
Under the condition of a constant failure rate, repairable systems reliability performance is sometimes expressed as the mean time between failures (MTBF) which is calculated as, λ = (MTBF)-1. 33
MTBF is often used when illustrating the relationship between availability and its influencing factors:
Availability = MTBF/(MTBF+MTTR+MWT)
where MTTR (mean time to repair) is the measure of maintainability and MWT (mean
waiting time) is the measure of maintenance supportability:34
Note that this is the simplest steady-state situation based on a constant failure rate. From studying the formula it is clear that improvements of reliability can be achieved by improving MTBF, MTTR or MWT. It is important to be aware of the trade-offs
32
O’Connor, Patrick D.T. (1991) Practical reliability engineering
33
Ibid
34
between these factors and the total effect on the availability. For example new and faster repair routines may increase MTTR at a cost of a slight reduction in reliability.35 Due to the many uncertainties involved in estimating reliability values, the benefits of such a measurement could be and have been questioned. Warrington and Jones criticize the use of failure rate and MTBF as measure of reliability performance. They argue that reliability and maintenance are not direct customer requirements in its own right and therefore not meaningful to express in absolute values.36
Customer requirements are rather concerned with the benefits that reliability and supportive maintenance can deliver, described in previous section. Generally these benefits are maximisation or minimisation of scenario objectives such as safety, operational success and whole-life costs. For these reasons reliability and maintenance should rather be expressed in terms of the benefits they can deliver in the context of a full scenario and not as a numerical measure. It is important to notice that all benefits do not have the same priority or criticality for all customers. Therefore a structured process is needed to find the single best technical solution for each customer.37
2.4 Principles of achieving product reliability
Reliability is concerned with failures throughout the life of a product. Naturally the achievement of reliability then starts when designing and developing a product. Decisions made during the design phase will strongly influence the future reliability of a product. This will not affect only one item but all items produced. In order to create a good design the designer/s must have a wide range of knowledge including materials, processes, components, production methods and more. Computer-aided engineering (CAE) may assist in many design tasks and can, properly used, contribute to more reliable designs. 38
The next step of achieving reliability is well-controlled manufacturing processes. Poor quality of production can make a well-designed product unreliable. Control of production quality involves controlling and minimizing variability and identifying and solving problems. Variability in production processes is the main cause of production-induced unreliability. Human operations are frequent sources of variability, particularly if repetitive or boring. Quality control (QC) methods and statistical process control are used in measurement, control and minimization of variability.39
There is a lot more to be said about the achievement of reliability in design and manufacturing, but this report is neither about good design nor well-controlled manufacturing processes. The focus here is on reliability in the field. Assuming a good
35
O’Connor, Patrick D.T. (1991) Practical reliability engineering
36
Warrington, Les & Jones, Jeffery A. (2003) Derivation of Technical Reliability & Maintenance
Requirements for Maximised User Benefits. 2003 37
Warrington, Les & Jones, Jeffery A. Derivation of Technical Reliability & Maintenance Requirements for
Maximised User Benefits. 2003 38
O’Connor, Patrick D.T. (1991) Practical reliability engineering
39
design and well-controlled manufacturing processes, product reliability in the field is based upon good practice in installation, operation and maintenance of equipment.40 Good practice in installation, operation and maintenance requires a good knowledge of the equipment and how to handle it. Operating and maintenance instructions from the supplier may improve this knowledge. Users learn by experience and knowledge generally increases with time. Conversely, frequent changes of personnel can lead to loss of knowledge. Established routines and maintenance records will prevent this loss.
Another factor affecting reliability in the field is redundancy. Redundancy means that there is parallel equipment and the required function can therefore be maintained, in case one of the equipment units fails.41
2.4.1 Maintenance and the achievement of reliability
The relationship between optimized maintenance and the achievement of field reliability attracts increasingly attention. Maintenance activities used to be regarded as a necessary evil, only inducing costs and disturbance. Today there is awareness that these activities in fact can reduce total cost and increase profit. 42
With a suitable maintenance strategy, maintenance provides an essential contribution to the reliability and dependability of an item.43 At the same time reliability data can be used to predict how maintenance will affect failure rate and by doing so be of use in maintenance optimization.44
Maintenance activities are usually divided into corrective maintenance and preventive maintenance. Corrective maintenance is the “maintenance carried out after fault recognition and intended to put an item into a state in which it can perform a required function”.45 If the failure is serious, corrective maintenance has to be carried out immediately, without delay after fault recognition. Failures needing immediate action can be very costly because of the costs of unplanned shutdowns apart from the direct maintenance costs. All failures do not need immediate attention and corrective maintenance may then be delayed, i.e. until a planned shutdown.
Preventive maintenance is the “maintenance carried out at predetermined intervals or according to prescribed criteria and intended to reduce the probability of failure”.46
40
Cannon, A.G. & Bendell, A (Eds). (1991) Reliability data banks
41
Hagberg, Leo & Henriksson, Tomas. (1994) Lönsamt underhåll: 8 steg till säkrad produktion.
42
Ahlmann, Hans. (1993) Service och underhåll.
43
European Standard 13306:2001. Maintenance Terminology
44
Langseth, H et al (1998) “Analysis of OREDA data for maintenance optimization”.
45
European Standard 13306:2001. Maintenance Terminology
46
There are several objectives of preventive maintenance, for example: 9 Minimize failures and their negative consequences
9 Minimize maintenance induced shutdowns 9 Increased lifetime of equipment and components 9 Better spare part holdings
9 Better documentation contributing to continuity of maintenance activities. Examples of preventive maintenance activities are cleaning, replacements of parts and lubrication. Examples of how failures are minimized and costs saved are: a) cleaning of the equipment preventing failure that would cost a lot more to correct and b) replacing components at scheduled shutdowns which reduces the risk of part failure, requiring a more expensive unplanned shutdown for replacement. 47
The preventive maintenance can be either predetermined in accordance with established time intervals or condition based i.e. based on performance and/or parameter monitoring. Condition based maintenance is increasingly replacing the practice of predetermined maintenance which has shown to be neither technically nor economically successful. Condition based maintenance leads to longer intervals between maintenance operations and reduced maintenance costs. The increasing popularity is also due to the recent development of devices for monitoring performance and parameters.48
In order to optimize preventive maintenance, all effects and costs of the maintenance activities must be considered. Sometimes it will be more economical to wait with replacement until a part fails than before, for example when repairs introduce defects leading to failure of other parts. An example of this is given below.49
“Data might show that a high pressure hydraulic hose has an increasing hazard rate after a failure-free life, in terms of hose leaks. A sensible maintenance policy might therefore be to replace the hose after say, 80 per cent of the failure free life. However, if the replacement action increases the probability of hydraulic leaks from the hose end connectors, it might be more economical to replace the hoses on failure.50”
Frequent overhaul and maintenance can cause disturbance of parts resulting in failure. Systems that are overhauled often display higher failure rates shortly after overhaul.51
47
Ahlmann, Hans. (1993) Service och underhåll.
48
Ahlmann, Hans. (1993) Service och underhåll.
49
O’Connor, Patrick D.T. (1991) Practical reliability engineering
50
Ibid
51
3 SURVEY
ENVIRONMENT
The chapter gives an overview of the complex environment of the research, which is important, both for the choice of method and in the development of conclusions. Alfa Laval, the customers, the product and the market is presented. After that previous studies in the field are reviewed.
3.1 Alfa Laval - the supplier
52Alfa Laval, a Swedish company founded in 1883, is a global supplier of products and system solutions based on their key technologies heat transfer, separation and fluids handling. The company is active in more than 100 countries and currently has about 10 000 employees. The headquarter is located in Lund, Sweden.
Alfa Laval customers are to be found in a wide range of industries. The total invoicing in 2001 was 1,700 MEUR.
3.1.1 Sales organization
The sales organization is divided into customer segments, grouped into the two divisions, Equipment Division and Process Technology Division.
Each customer segment is divided into two or three market units targeting specific customer groups within the segment. Each market unit is responsible for the marketing and sales of Alfa Laval products and system solutions globally to their group of customers.
The fully incorporated Alfa Laval sales companies located in 50 countries worldwide manages direct sales. A central market unit supports the local sales companies in both technology and market related issues. It is also the link between the market/sales companies and the R&D, product management and operations within Alfa Laval. The after sales organization Parts & Service has a central global service network as well as local service centres and field engineers. They sell spare parts and service contracts and provide any service for the Alfa Laval products.
3.1.2 Market Unit Oil & Gas Technology
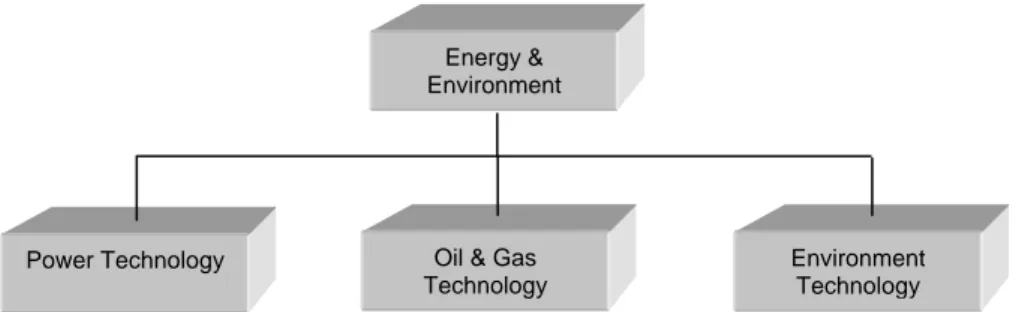
Market unit Oil & Gas Technology is part of the customer segment Energy and Environment, which is part of the Process Technology Division. Organization charts are presented in figure 3 and figure 4. The market unit is responsible for the marketing and sales of Alfa Laval products and system solutions to the oil and gas industry globally.
52
All information in this section has been provided by employees at Alfa Laval Oil & Gas Technology and the website www.alfalaval.com
Figure 3 Process Technology Division organization chart
Figure 4 Energy & Environment customer segment organization chart
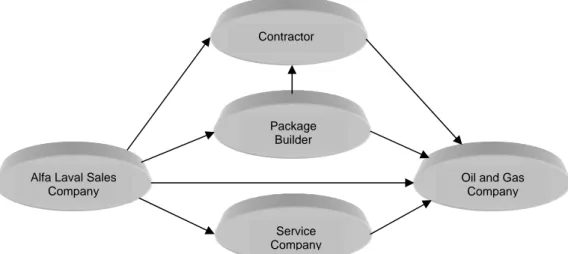
The end users of the products and systems are found all over the world in upstream offshore and onshore operations and include all major oil companies, for example BP, ConocoPhillips and Statoil. Sales are conducted either directly to the oil and gas company or through a contractor, package builder or service company. Figure 5 presents the possible sales alternatives.
For market unit Oil & Gas Technology the plate heat exchanger is a core product, which stands for a substantial share of the sales. Heat exchangers in oil and gas exploration and production are mainly used for cooling of machinery (utility coolers) and for the initial treatment of extracted oil and gas. The heat exchangers used in the treatment of the extracted oil and gas are called process heat exchangers and is part of the topsides equipment on the platform.
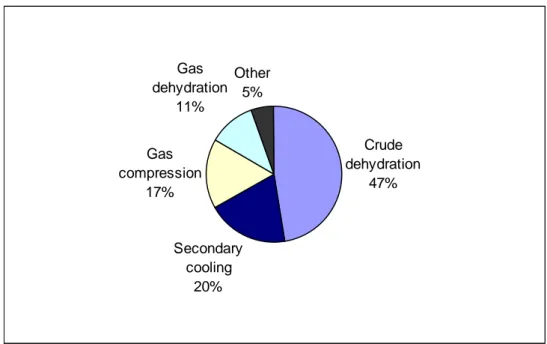
The process heat exchangers are used in a variety of oil and gas processes for cooling, heating, condensing, reboiling and vaporizing. Main processes are crude oil dehydration, gas compression, gas dehydration, gas sweetening and secondary cooling. Plate heat exchangers are sold both to new plants and for replacements of old heat exchangers. Each plate heat exchanger is designed to suit the specific application and process conditions.
Process Technology Division
Parts & Service
Life Science Technology Energy & Environment Process Industry Membrane Technology Food Technology Energy & Environment
Power Technology Oil & Gas Technology
Environment Technology
Figure 5 Alfa Laval sales process to oil and gas customers
Today, Alfa Laval has delivered several thousands of plate heat exchangers to the oil and gas industry. A majority of these are recorded in an installation database with facts on location, end user, duty and design parameters. Oil & Gas Technology now records all deliveries in this database. This has not been a priority in the past though, which is why a part of the delivered units are missing in the database.
3.2 The offshore industry – the operators
The operator group in focus of this survey is the offshore oil and gas production platforms. Offshore oil production accounts for about 30% of the total world oil production, and offshore gas production for about half of the world production of natural gas.
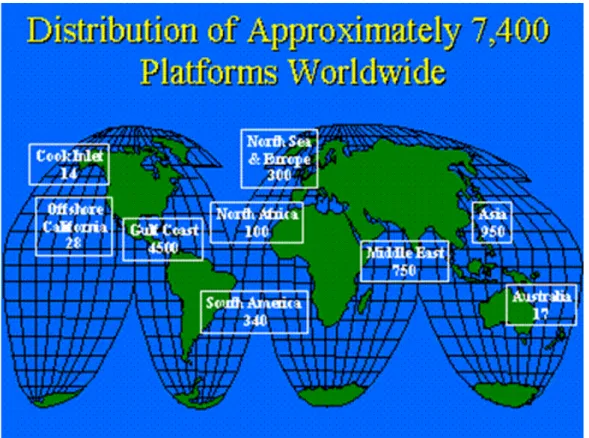
There are about 8000 offshore oil and gas platforms worldwide. About half of these are in the US. Examples of other important areas are the Middle East, North Sea and Brazil. The distribution of platforms is shown in figure 6. 53 However, the size and production rate of the platforms in the different regions vary. For example an offshore oil field in Norway generally has a daily oil production many times the production of large offshore fields in US.54
53
www.mms.gov
54
Ostebo, Runar. (1993) System-effectiveness Assessment in Offshore Field Development using Life-cycle
Performance Simulation.
Alfa Laval Sales Company
Contractor
Oil and Gas Company Package
Builder
Service Company
Figure 6 Distribution of approximately 7400 platforms worldwide55
The offshore industry is dominated by relatively few major oil and gas companies. The market has gone through a consolidation in recent years. Examples of mergers are BP and Amoco, and Exxon and Mobil.
3.2.1 Reliability in the offshore industry
“The reliability, availability, maintenance and safety (RAMS) of offshore exploration and production facilities are of considerable concern to employees, companies and authorities.”56 “Equipment faults alone, or in combination with other factors, have been the cause of a number of accidents.”57
For oil companies, unavailability in large offshore fields has high economic implications, e.g. maintenance costs and costs associated with unplanned shutdowns such as inability to meet the demand for deliveries. This makes reliability issues of key
55
www.mms.gov
56
OREDA, Offshore Reliability Data. (2002)
57
concern for economic decision-making, both during planning and production phases.58
There is a trend towards life-cycle assessment i.e. more focus is put on operating expenditures in addition to capital expenditures, which traditionally has been the most important factor. Decisions taken at an early planning stage will strongly influence the total life-cycle cost. Maintenance requirements are dependent on decisions regarding equipment choice and design in the planning stage. Maintenance costs are a big part of the total operating costs. As an example, for one North Sea operator, approximately 60% of the offshore operational costs are related to the maintenance of the platform.59
Various types of RAMS analyses are carried out to provide a basis for decisions in offshore engineering, fabrication and operations. It is a support when optimizing the production system and identifying critical issues to be followed up in later project phases. Analyses are also used in improving existing facility operation. In order to allow RAMS analyses to be conducted, a source of real life reliability data is required.60 In response to the need for reliability data the OREDA (Offshore REliability DAta) project organization was established in the early 1980’s by eight major oil companies operating in the North Sea and Adriatic Sea. The members of OREDA are (as per 2002) ENI/AGIP, BP Exploration, ExxonMobil, Norsk Hydro, Phillips Petroleum, Statoil, Shell Exploration & Production and TotalFinaElf. SINTEF has been the main contractor for project management since 1990.61
“The main objective of the OREDA project is to contribute to an improved safety and cost-effectiveness in design and operation of oil and gas exploration and production facilities; through collection and analysis of maintenance and operational data, establishment of a high quality reliability database, and exchange of reliability, availability, maintenance and safety (RAMS) technology among the participating companies.”62 One of the overall objectives of collecting data is for the selection of most reliable make/model of equipment.63
Findings from the OREDA project will be presented in Section 3.5.
Despite the many risks and uncertainties associated with the oil and gas industry, involving the risk of huge financial losses, poor decision-making has plagued the oil and gas investors since the industry’s inception, leading to monumental and recurring mistakes.
58
Ostebo, Runar. (1993) System-effectiveness Assessment in Offshore Field Development using Life-cycle
Performance Simulation 59
Ibid
60
OREDA, Offshore Reliability Data. (2002)
61
www.oreda.com
62
OREDA, Offshore Reliability Data. (2002)
63
Figure 7 Offshore oil production platform
According to Myers and Futchik, there is a pattern to the recurring mistakes and that these mistakes, in nearly every instance, can be avoided by modest expenditures. One of the factors mentioned contributing to less-than-optimal operating performance is the turnover of key personnel with reorganizations and downsizing reducing overall staff experience. Combined staffing, experience, and knowledge deficiencies have contributed to relying on outmoded technologies or inadequate familiarity with new technologies.64
3.3 Plate heat exchangers – the product
Heat exchangers are used for the purpose of heat transfer. Heat transfer involves bringing two substances at different temperatures close to each other, so that one either heats or cools the other. This means that energy already in the system is simply transferred to another part of the process where it can be put to greatest effect. This will save money, energy and reduce the overall environmental impact of the production process compared to buying additional energy.65
There are several types of heat exchangers, of which shell and tube heat exchangers and plate heat exchangers are two of the most widely known and used.
The basic PHE, shown in figure 8, consists of a series of thin corrugated metal plates that are gasketed and/or welded together. The plates are compressed together in a rigid frame to create an arrangement of parallel flow channels. One fluid travelling in the odd numbered channels, the other in the even. Further information on construction, is given in Appendix 2.66 (Construction of a shell and tube heat exchanger is shown in Appendix 3).
64
Myers, Merle H & Futchik, Dennis (2003): “Investors can minimize risk in upstream oil, gas projects”.
65
Alfa Laval – plate technology. Alfa Laval. 2002.
66
Figure 8 Plate heat exchanger
3.3.1 Reliability and failures of plate heat exchangers
Reliability was earlier defined as the “ability of an item to perform a required function under given conditions for a given time interval”67 and the ability of an item to function without failures.68 So what are the typical fault modes and failure causes for a PHE in general? What factors are affecting PHE reliability?
As mentioned earlier discussing and classifying failures and their causes is not easy as it is subject of human bias. However, for this survey we need some theory and classification of PHE failures. The most common fault modes and their causes and consequences will therefore be briefly described here.
Heat exchanger faults generally fall into one of two groups; mechanical faults or performance faults. Sometimes these two may be related.69
A mechanical fault is usually external leakage or internal leakage. External leakage means that there is a leakage visible on the exterior of the PHE. External leakage failure causes can be:70
67
European Standard 13306:2001. Maintenance Terminology
68
Bergman, Bo & Klefsjö, Bengt. (1991) Kvalitet från behov till användning
69
Heat Exchanger Service Guide. Alfa Laval. 1998.
70
9 Dislocation of gaskets, also called gasket blow-out, as a result of an abnormal increase in internal pressure.
9 Damaged or crushed gaskets, which may be the result of overtightening of the plate pack, wrong re-assembly or unsuitable combination of process media and gasket material.
9 Too low gasket force as a result of gasket wear-out or undertightening of plate pack.
9 Damage of weld
An internal leakage means that there is mixing of the two substances, which generally indicates some form of hole or crack in one or several plates. There are many different causes of holes and cracks in plates, some are:71
9 Corrosion by which the material is destroyed as a result of excessive local chemical attacks.
9 Erosion, generally a localised mechanical wearing down caused by particles in areas with high media velocities.
9 Fatigue which is caused by either
a) continuous pressure pulsations in the system or frequent start-ups/stops causing noticeable pressure variations, or
b) temperature fluctuations
9 Damage of plates by foreign objects in the system or mistreatment when taking the unit apart.
Among the performance related faults gradual performance reduction due to fouling (also referred to as clogging) is a common fault.72
For a PHE there are two types of basic fouling problems, fouling on the heat transfer area and plugging of the surface channels. It may put the heat exchanger in a degraded state with reduced thermal performance, pressure loss and restricted flow. Fouling can be the result of scaling, deposition of solids in the system or biological growth. A PHE can pass only a limited amount of solids and debris. If the size of particles exceeds the plate gap limitations, the inlet port area will be plugged. Process conditions highly influence the degree of fouling. Dirty media and low velocity of media are examples of factors that increase the tendency of fouling.73 In most cases the PHE can still perform the required function in spite of the performance reduction. When discussing failures of PHE it is worth mentioning that, in contrast to a turbine, compressor or pump, a PHE is a piece of static equipment i.e. it has no moving parts.
71
Heat Exchanger Service Guide. Alfa Laval. 1998.
72
Ibid
73
This means it cannot create pressure surges, energy, temperature changes, plugging solids or scale by itself.74
In order for a PHE to be reliable it has to be designed properly for the application and process conditions in which it is to be used. Important design parameters are number, material and size of plates and choice of sealing i.e. gaskets or welds or a combination of the two. If gaskets are chosen the gasket material must be compatible with the media.75
3.3.2
Operating instructions and preventive maintenance of plate heat exchangers76Following the operating instructions and practicing a suitable preventive maintenance will avoid many failures and ensure a longer operating life. With each PHE delivery Alfa Laval enclose one copy of the PHE instruction and maintenance manual. There is no space in this report to cover the whole subject of PHE operating instructions and maintenance. The most important issues for this survey will be summarized below:
Operating instructions
9 Flush the system including the interconnecting piping of all foreign matter before initial start-up and after the system has been worked on.
9 Avoid pressure variation and pressure shocks. Always open and close valves and pumps slowly. Operational changes must be made slowly and smoothly, use slow operating valves and pressure surge suppression devices if necessary. 9 The PHE should be protected from large-solids. In high solids applications a
filter/strainer should be used. Backflushing valves can also be used. It reverses the flow through the exchanger, as needed, to flush out any materials that may have accumulated in the inlet areas of the unit.
9 Do not open the unit if not necessary. Dismantling and re-assembly of the PHE should be done under the direction of qualified field service personnel.
Maintenance instructions
Depending on the physical and chemical properties of the media and the thermal duty the PHE may need cleaning from every few months to never at all to ensure optimum heat transfer. The need for cleaning will show through a decrease in thermal performance and an increase in pressure drop across the unit and/or a reduction in the flow. When cleaning fouling build-up is removed. There are two methods available for cleaning the PHE:
9 Opening the PHE and removing the plates from the unit for mechanical cleaning with a soft brush and high-pressure washing with water or a suitable cleaning agent. This cleaning can be done either on-site by qualified field 74 Ibid 75 Ibid. 76
service personnel or the PHE can be sent to a PHE service centre. This cleaning method tends to be very time-consuming and involves a risk of damaging the gaskets and plates, particularly if performed by untrained personnel. This type of cleaning cannot be used for welded units because the unit cannot be opened.
9 Chemical cleaning of the plates without opening the unit. A chemical is then run through the unit dissolving and loosening any deposits. As long as the PHE is not plugged up completely with fouling build-up this can be a cost-effective solution by minimizing downtime and maintenance time.
Recommended spare parts are gaskets, plates with gaskets or full plate pack. Regarding replacement of parts the gaskets are the only part that normally requires replacement. The lifetime for gaskets varies from process to process and can range from 2 to 20 years. High temperature and high pressure shortens the gasket life. Planned regasketing of the PHE prior to gasket failure should be included in all maintenance programs for gasketed heat exchangers.
In case plates are damaged they should be replaced. There is no reliable way of repairing damaged plates.
3.4 The heat exchanger market - the competition
77The global heat exchanger market is a large market spread out both geographically and on many different industries. The market as a whole is mature and slow growing. The competition is intense with many suppliers. Shell and tube heat exchangers are dominating the market with its traditional technology. The rest of the market is mostly constituted of plate heat exchangers.
The plate heat exchanger market grows above the industry wide average of heat exchangers of all types. Advantages that the newer plate technology has over shell and tube heat exchangers are:
9 Compact size – often only about 20% of the size of the traditional installation 9 More effective heat transfer –3 to 5 times higher ratio
9 Flexible design – the number of plates can be increased or reduced as the required capacity varies over time.
9 Lower cost – both in terms of capital cost and installation cost
Although there are many benefits of choosing a PHE rather than a shell and tube, the technology conversion is moving quite slowly. The drawbacks of PHEs are technical limitations, which exclude them from use in very high temperature and pressure installations. Market drivers for shell and tube heat exchangers are versatility and familiarity; everyone knows the technology and how to handle the equipment.
77
There are also expenses involved in a technology conversion. The plants and platforms are planned to suit the shell and tubes so adjustments might be needed if changing to PHEs. Maintenance routines and operating instructions are not the same for shell and tubes and PHEs. Therefore a technology conversion requires new knowledge and a change in behavior of the operators.
Alfa Laval has estimated that the market for PHEs in the oil and gas industry is far from saturated and sees a growth potential and therefore an opportunity in increasing their market share.
3.5 Related research findings
The findings of related research are of use both in designing the research and to gain an understanding of the current state of knowledge in the subject. This research project is rather specific and relevant previous research have therefore been difficult to find. A few interesting findings have been found and these are presented separately in sections 3.5.1-3.5.3
3.5.1 OREDA
78In section 3.2.1 the OREDA (Offshore Reliability Data) project was introduced. The project organization consists of eight major oil companies and the contractor, SINTEF. The idea of the OREDA project, which started in the early 1980’s, was to survey the reliability of important offshore equipment under real life operational conditions, by collecting reliability field data and merge into a reliability database. In the beginning of the project, OREDA data was primarily needed for risk and availability studies in the early concept phases of an offshore field development. However, there has been an increasing interest in data for use in maintenance optimization.
The collection of data has been carried out in several phases with some variation of focus and equipment classes included. The choice of equipment on which the data was to be collected was selected by the oil companies and was mostly topsides equipment. Heat exchangers have been included as an equipment class in all phases of the project.
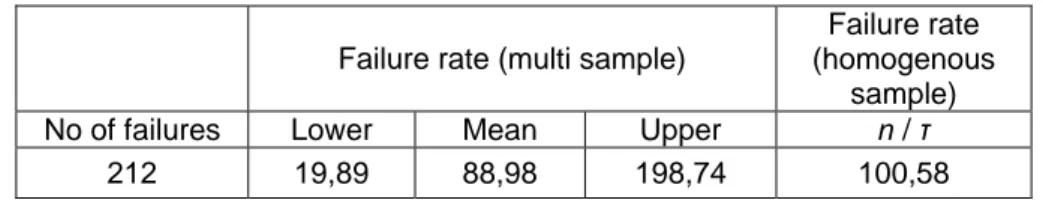
OREDA handbooks have been published to present the data collected for the different types of equipment classes. The data presented are failure modes, estimated failure rates and repair time. The latest handbook, published in 2002, covers the data collected in 1993-2000. Data for 68 heat exchangers at 12 platforms was collected during this time. Table 1 shows a summary of failure rates, based on calendar time, for these units. Failure rates are given in number of failures per 106 hours.
78
Failure rate (multi sample)
Failure rate (homogenous
sample) No of failures Lower Mean Upper n / τ
212 19,89 88,98 198,74 100,58
Table 1 Summary of heat exchanger reliability data collected by OREDA
Out of the 68 heat exchangers, 14 are PHEs, whereas almost all of the others are shell and tube. See table 2 for a summary of the reliability data, based on calendar time, for the 14 PHEs (collected from 4 platforms).
Failure rate (multi sample)
Failure rate (homogenous
sample) No of failures Lower Mean Upper n / τ
32 5,50 71,15 201,72 66,35
Table 2 Summary of plate heat exchanger reliability data collected by OREDA
Comparing estimated failure rates for heat exchangers with failure rates of rotating machinery equipment shows that heat exchangers have significantly lower failure rates. As an example compressors have a mean estimated failure rate of 656,86 failures/106 hours and gas turbines 1199,23 failures/106 hours.
Some of the topsides equipment have lower estimated failure rates than heat exchangers, for example valves with a mean failure rate of 31,05.
In order to be able to compare the reliability data collected in different projects it is necessary to know the definitions and conditions of the research. It is most often difficult to find out all this information. Some of the conditions for collected data in the OREDA project are given below:
Data collected are in general not covering the whole lifetime of equipment, but 2-4 years of operation. The main part of the failure events comes from the useful life phase. The failure rate estimates are therefore based on the assumption of a constant failure rate. Failure is defined as “the termination or degradation of the ability of an item to perform its required function(s). It includes:
9 Complete failure of item
9 Failure of part of the item that causes unavailability of the item for corrective
action
9 Failure discovered during inspection, testing, or preventive maintenance that
requires repair
9 Failure on safety devices or control/monitoring devices that necessitates shutdown,
3.5.2 Operational experiences for heat exchangers at oil platforms
79In 1988 SINTEF carried out a specific survey of operational experience for heat exchangers at oil platforms on the Norwegian Continental Shelf (NCS). The objective of the project was to collect and analyse operational and maintenance data. Identification of failures and problem areas was given special attention.
Four oil companies, with a total of 355 heat exchangers, participated in the survey. Out of the surveyed units 77,2% were shell and tube heat exchangers, 8,5% plate heat exchangers, 3,9% air coolers and the rest was unknown.
The survey is based on verbal and written information received from contact persons in the oil companies. It was noticed that maintenance personnel is a very valuable source of information, since they are concerned with the equipment on a daily basis. The most serious problems noticed for the different types of heat exchangers were the following:
9 Shell and tube – Galvanic and pitting corrosion causing leaks in tubes, tube sheets, connections, channels and plugs.
9 Plate heat exchangers – Leaks in gaskets, may be due to the ageing of gaskets. 9 Air coolers – Too high cooling efficiency when outside temperatures get too
low or when wind chill is strong.
9 Fouling and deposits were a problem for all heat exchanger types.
None of the companies have reported any accidents or hazardous incidents connected to the heat exchangers.
3.5.3 Reliability of plate heat exchangers in the power industry
80A reliability customer survey of the Alfa Laval plate heat exchangers delivered to power plants was carried out by Alfa Laval in 1982-1985. The data collection method was self-administered questionnaires distributed by mail. The collected data covered 474 units in 18 countries. The units in this survey were utility heat exchangers and not process heat exchangers as in the oil and gas survey. Utility heat exchangers generally have lower temperatures, lower pressure and less aggressive media. Interesting findings and observations from the survey are:
9 Only 35 failures were reported and the failure rate was found to be around 2 failures per million operating hours.
9 In case users did have problems with their PHE, these were often initial technical problems during installation and start-up.
79
Bonå, Lars Erik et al. (1988) Survey of operational experience for heat exchangers/coolers.
80
9 The most common fault mode reported in the survey was external leakage caused by gasket failure. However it was not possible to divide all failures into the fault modes.
The researchers also noticed that it was difficult to distinguish between preventive and corrective maintenance based upon the descriptions reported in the survey. For example maintenance to remedy fouling after many years in operation was regarded as a failure if reported as a failure, even though it could have been avoided by preventive maintenance.