Research
Assessment of the
QT-COOL coolant
channel module
against the PBF RIA
1-2 experiment
2020:12
SSM perspective
Background
The fuel rod analysis program SCANAIR has been developed by IRSN (Institut de Radioprotection et de Sûreté Nucléaire) for analysis of reactivity initiated accidents (RIA) in light water reactors. The Swedish Radiation Safety Authority (SSM) has access to SCANAIR in exchange for annual contributions for its further development. This ensures a possibility for SSM to do own analysis of fuel rods in reactivity initiated accidents. The development and administration of the program is done by Quantum Technologies AB on assignment from SSM.
SSM’s development of SCANAIR is primarily focused on the thermo-hydraulic models, with the aim of improving the analytical capabilities for fuel in boiler water reactors. In a previous work, an improved ther-mohydraulic model in SCANAIR was proposed and implemented in an SSM-specifc version of SCANAIR V_7_6. The present work is the 2020 contribution to SCANAIR development and contains a validation against tests in the Power Burst Facility (PBF).
Results
This current project has shown that the two-phase coolant chan-nel module developed by Quantum Technologies AB is able to model cladding-to-coolant heat transfer under RIAs. The work includes more in depth analysis of coolant properties and fuel rod gas pressure, from which it is concluded that the pellet-cladding gap conductance has a surprisingly strong efect. The work has also included a parametric study that investigate the efect of modelling aspects of the flm boiling heat transfer.
Relevance
Knowledge of what is happening in a fuel rod during an event and how it is implemented in analytical tools is essential to SSM for the supervi-sion of nuclear power plants. The participation in the development of SCANAIR also enables SSM to actively be a part of the large eforts that are made internationally with testing, understanding and improving the tools for analysis of reactivity initiated accidents.
Need for further research
Continued work on developing SCANAIR’s analysis capabilities is planned in cooperation with IRSN. This current work suggests that a deeper understanding of axial gas transport and internal gas pressure equalisation is motivated. On the longer time scale there will be new tests in the CABRI reactor with thermohydraulic conditions closer to those of current nuclear power plants. These tests will be valuable to validate the improved thermohydraulic model against and to continue model development from.
Project information
Contact person SSM: Anna Alvestav Reference: SSM2018-4297 / 7030301-00
Author: Lars Olof Jernkvist
Quantum Technologies AB, Uppsala
2020:12
Assessment of the QT-COOL coolant
channel module against the PBF RIA
1-2 experiment
This report concerns a study which has been conducted for the Swedish Radiation Safety Authority, SSM. The conclusions and view-points presented in the report are those of the author/authors and do not necessarily coincide with those of the SSM.
Assessment of the QT-COOL
coolant channel module against
the PBF RIA 1-2 experiment
April 24, 2020.
Lars Olof Jernkvist
Quantum Technologies AB
Contents
Summary ...III
Sammanfattning ... IV
1
Introduction ...1
2
The PBF RIA 1-2 test ...5
2.1 Test fuel rods and pre-irradiation conditions ...5
2.1.1 Design of the test rods ...5
2.1.2 Pre-irradiation of the test rods ...6
2.2 Rod instrumentation and pre-test examinations ...6
2.3 Pulse reactor test and post-test examinations ...7
3
Computer analyses ...13
3.1 Methodology...13
3.2 Analyses of fuel pre-irradiation with FRAPCON ...13
3.2.1 Description of the FRAPCON-3.3-SKI program ...13
3.2.2 Models and input used for the analyses ...14
3.3 Simulation of test rod re-fabrication with FRAPAIR ...14
3.4 Analyses of pulse reactor test with SCANAIR ...15
3.4.1 Description of SCANAIR-7.6-SSM ...15
3.4.2 Scope of analyses...15
3.4.3 Models and input used for the analyses ...15
4
Results and discussion ...17
4.1 Analyses of fuel rod pre-irradiation ...17
4.2 Analyses of pulse reactor test ...18
4.2.1 Fuel pellet enthalpy and temperature...19
4.2.2 Cladding tube surface temperature ...19
4.2.3 Coolant properties ...24
4.2.4 Fuel rod internal pressure and fuel fission gas release ...29
4.2.5 Circumferential deformation of the cladding tube ...31
4.2.6 Parametric studies ...33
5
Summary and conclusions ...37
LIST OF APPENDICES
Appendix A:Input used in analyses of test rod pre-irradiation ... A.1 Appendix B:
Modelling assumptions made in analyses of the PBF RIA 1-2 test ... B.1 Appendix C:
Models and options used for SCANAIR-7.6-SSM ... C.1
Summary
SCANAIR is a state-of-the-art computer program for analyses of the thermal-mechanical behaviour of light water reactor fuel rods under reactivity initiated accidents (RIAs). This work aims to validate an updated and improved version of QT-COOL, which is a coolant channel module for modelling of heat transfer under two-phase flow that has recently been implemented in an SSM-specific version of SCANAIR V_7_6.
The validation is done by comparing calculated results for coolant and fuel rod properties against measured results for two test fuel rods in a specific experiment, namely the PBF RIA 1-2 test. This particular experiment is chosen, since it is one of very few RIA simulation tests that have been conducted with cooling conditions that are close to those in boiling water reactors at hot zero power operating conditions. Moreover, the selected test fuel rods were extensively instrumented and carefully investigated after the test, which makes them well suited for validation of computer programs.
Calculated time histories for the coolant and the fuel rod cladding surface tempera-tures agree fairly well with measured data, whereas differences are found between calculated and measured time histories for coolant pressure and rod internal gas pressure. Possible reasons for these differences are identified and discussed.
In conclusion, the validation shows that the QT-COOL two-phase coolant channel module is able to model cladding-to-coolant heat transfer under RIAs that are postulated to occur in boiling water reactors at hot zero power operating conditions, provided that the heat transfer coefficent in the film boiling regime, calculated with default correlations in the module, is increased by a factor around 2.3.
Sammanfattning
SCANAIR är ett modernt beräkningsprogram för att analysera det termomekaniska beteendet hos kärnbränslestavar i lättvattenreaktorer under reaktivitetsolyckor (RIA). Föreliggande arbete syftar till att utvärdera en ny och förbättrad version av QT-COOL, vilket är en kylkanalmodul avsedd för modellering av värmetransport under tvåfasflöde, som nyligen införts i en SSM-specifik version av SCANAIR V_7_6.
Utvärderingen genomförs genom att jämföra beräknade egenskaper hos kylmedium och bränsestav mot uppmätta resultat för två provstavar i ett specifikt experiment, nämligen PBF RIA 1-2. Detta experiment är utvalt, då det är ett av väldigt få RIA-simuleringsprov som utförts med kylvattenförhållanden liknande dem i kokvatten-reaktorer under varm avställning. Dessutom var de studerade provstavarna mycket välförsedda med mätinstrument och undersöktes noggrant efter provningen, vilket gör dem lämpade för validering av beräkningsprogram.
Beräknade tidsförlopp för temperaturen hos såväl kylmediet som kapslingsytan hos bränslestavarna överensstämmer relativt väl med mätdata, medan däremot skillnader kan ses mellan beräknade och uppmätta tidsförlopp för kylmedietrycket och bränse-stavarnas inre gastryck. Möjliga orsaker till dessa skillnader identifieras och diskuteras.
Sammanfattningsvis så visar utvärderingen att kylkanalmodulen QT-COOL förmår att modellera värmeöverföring från kapslingsrören till kylmediet under postulerade reaktivitetsolyckor som inträffar i kokvattenreaktorer vid varm avställning, givet att värmeövergångstalet under filmkokning ökas ungefärligen med en faktor 2.3 från dess nominella värde, beräknat genom standardkorrelationer i modulen.
1 Introduction
SCANAIR is a state-of-the-art computer program for analyses of the thermal-mechanical behaviour of light water reactor (LWR) fuel rods under reactivity initiated accidents (RIAs). It is developed and maintained by Institut de Radio-protection et de Sûreté de Nucléaire (IRSN), France, and currently used by about a dozen organisations [1, 2]. The Swedish Radiation Safety Authority (SSM) belongs to this international user group and supports development of the program, i.a. by annual in-kind contributions.
As an in-kind contribution by SSM in 2013, a simple two-phase coolant channel module, named QT-COOL, was implemented in SCANAIR [3, 4]. For each time step in a transient modelled with SCANAIR, this module calculated the local changes in water/steam coolant properties (specific enthalpy, steam quality, steam fraction, temperature, velocity) along the fuel rod, given the coolant inlet conditions and the fuel rod cladding tube surface temperature as a function of axial position. A homogeneous equilibrium representation was used for representing the two-phase coolant, meaning that the water-steam mixture was treated as a homogeneous pseudo fluid that obeyed the usual equations of a single-component fluid. Under these simplifying assumptions, the QT-COOL module solved the conservation equations for coolant energy and mass in one dimension (along the fuel rod). However, the momentum equation was not solved, which means that the space-time variation of coolant pressure had to be given as input to the calculations. The cladding-to-coolant heat transfer coefficient was also determined by QT-COOL, using an extensive library of heat transfer correlations for both sub- and supercritical heat transfer. After review and evaluation by IRSN, the QT-COOL module was accepted and introduced in SCANAIR. It is available as an optional coolant channel module in SCANAIR from version V_7_5 and later; the default coolant model in SCANAIR is restricted to single phase coolants (liquid water or sodium).
The QT-COOL module was originally developed for general thermal-mechanical analyses of LWR fuel rods under steady-state conditions and slow transients, and not specifically for modelling conditions under RIAs. Validation of the module against pulse reactor RIA simulation tests in the Japanese Nuclear Safety Research Reactor (NSRR) [4, 5], and also against test cases in the RIA fuel code benchmark organized by the OECD Nuclear Energy Agency (NEA) [6, 7], showed that the QT-COOL module underestimated the cladding-to-coolant heat transfer under transient film boiling conditions and that it overestimated the steam (void) fraction growth rate, when passing from single phase liquid to mixed phase conditions during the RIA.
A hypothetical explanation to the aforementioned shortcomings of the QT-COOL module was tested in 2016, as part of SSM:s annual in-kind contribution to the development of SCANAIR [8]. More precisely, it was hypothesized that coolant
inertia effects could be of importance for clad-to-coolant heat transfer and coolant flow in cases with rapid onset of boiling. Inertia is not considered in the QT-COOL module, and simple hydrodynamic models were used to assess whether the simple two-phase model in the QT-COOL module should be improved [8].
In conclusion, the assessment in [8] showed that the original version of the QT-COOL coolant channel module was inadequate for modelling axial coolant flow in situations that involve rapid net vapour generation anywhere along the fuel rod. With regard to scenarios for LWR RIAs, net vapour generation is most likely for hot zero power reactor conditions, when the coolant flow and subcooling are fairly low. The original QT-COOL module was deemed inadequate for modelling these scenarios, for two reasons: Firstly, it did not account for coolant inertia effects on axial flow, since conservation of momentum was not considered in the fundamental equations solved by the module. Secondly, it treated the two-phase coolant as a homogeneous mixture of water and steam, where the two phases were assumed to have the same velocity (no velocity slip).
Based on the assessment in [8], it was proposed that the original QT-COOL coolant channel module should be improved with regard to its simplistic modelling of two-phase axial flow. It was also recognized that the modelling should be kept as simple as possible, in order to retain reasonable execution times for SCANAIR. To this end, a two-phase coolant channel model used in the PARET/ANL computer program was identified as a suitable candidate with regard to balance between modelling adequacy and computational complexity [9]. PARET/ANL is intended for analyses of reactivity insertion events in research and test reactor cores, cooled by light or heavy water, with fuel composed of either plates or rods. Version 5.0 of the program is available for non-commercial use through the OECD NEA Data Bank Computer Program Services [10]. The coolant fluid dynamics model in PARET/ANL solves the conservation equations for mass, momentum and energy in one dimension, accounting for frictional loss and the velocity difference (slip) between vapour and liquid. The model dates back to the 1960s and the algorithm is designed to suit the computers available at that time, meaning that it is optimized for computational simplicity and speed [11].
Since the PARET/ANL model seemed to address the observed shortcomings in the original version of QT-COOL, a feasibility study was performed by SSM as an in-kind contribution to the SCANAIR development in 2017 [12]. The intention was to assess if the PARET/ANL coolant model, or concepts thereof, could be used to replace or improve the model in QT-COOL. The feasibility study showed that no part of the source code to PARET/ANL could be re-used in QT-COOL, since it was poorly documented and programmed in obsolete FORTRAN style. However, it was concluded that concepts from the PARET/ANL hydrodynamic model could be introduced in the QT-COOL module, thereby improving the modelling capacity of QT-COOL with moderate efforts.
The in-kind contribution from SSM to the SCANAIR development in 2019 was formulated on the basis of the findings from the 2017 feasibility study [12]. The contribution resulted in an updated and improved version of the QT-COOL coolant channel module [13]. The updated module uses the same library of clad-to-coolant heat transfer correlations as the original version of QT-COOL [3], but the hydrodynamic description of the two-phase coolant is based on concepts from the PARET/ANL model, supplemented by a drift-flux model for the velocity slip between water and steam and correlations for wall-fluid friction. In contrast to the original version of QT-COOL, the updated module accounts for velocity differences (slip) between steam and liquid, and it also calculates the axial pressure distribution along the coolant channel by solving the one-dimensional conservation equation for momentum.
In this report, the updated and improved version of the QT-COOL coolant channel module is validated against experimental data from an RIA simulation experiment, carried out in the early 1980s in the Power Burst Facility (PBF), Idaho Falls, USA. The experiment under study, known as the PBF RIA 1-2 test [14, 15], is one of very few RIA simulation tests that have been conducted with cooling conditions that are close to those expected in boiling water reactors at hot zero power operating conditions. This, together with the fact that two of the test rods in the experiment were extensively instrumented and also carefully examined after the experiment, makes the PBF RIA 1-2 test particularly useful for validation of the two-phase coolant channel model in QT-COOL.
The organisation of the report is as follows:
The RIA simulation test under study in this report, PBF RIA 1-2, is presented in section 2. Details on the design of the test fuel rods, their pre-irradiation and instrumentation are given, followed by a description of the RIA test conditions in the PBF. Section 3 deals with the applied computer programs, models and methods. The computational procedure, involving analyses of the steady-state pre-irradiation of the test rods with the FRAPCON-3.3-SKI program and simulations of the pulse reactor test with SCANAIR V_7_6, is described.
Section 4 presents the results of the performed analyses. Calculated fuel rod conditions at end of pre-irradiation, such as cladding tube corrosion, fuel fission gas release and pellet-cladding gap conditions, are first presented in section 4.1. These calculated conditions serve as input to the analyses of the PBF RIA 1-2 test, the results of which are presented in section 4.2. Throughout section 4.2, the calculated fuel rod conditions are compared with measured data, either recorded from the in-reactor instrumentation under the pulse test, or obtained from post-test examinations of the considered test rods. The calculated results are discussed in light of these data, and possible reasons for discrepancies between calculated results and measurements are identified. The most important results are finally summarised in section 5, where general conclusions from the work are drawn.
2 The PBF RIA 1-2 test
The RIA simulation test used as an assessment case in this report was carried out in the Power Burst Facility (PBF), USA, on four individually shrouded test rods that had been pre-irradiated to rod average burnups of 4.4–5.2 MWd(kgU)-1 in the
Saxton experimental reactor, USA. Two of these test rods were instrumented, and measured data from these rods are compared with calculated results in section 4 of the report. The data presented below for the tests rods are taken from [14, 15], unless otherwise stated.
2.1 Test fuel rods and pre-irradiation conditions
2.1.1 Design of the test rods
The four test rods used in the PBF RIA 1-2 test were fabricated by the Mitsubishi Atomic Power Industries (MAPI), and the design is therefore known as MAPI rods. Key properties of this design are summarised in Table 1. It is similar to the design of pressurized water reactor rods from the 1970s, except for the fuel pellet enrichment and the rod length.
Table 1: Specifications of the MAPI test fuel rod design [14, 15]. TD denotes the UO2 fuel theoretical density (10 960 kgm-3). The Zircaloy-4 cladding
material contains Zr-1.5Sn-0.2Fe-0.1Cr-0.12O by weight percent. Fuel rod design parameter
Fuel rod active length [ mm ]
Fuel rod fill gas
Gas plenum length [ mm ]
Fill gas pressure at room temperature [ MPa ]
914 He 45.7 1.90 Fuel material Enrichment of 235U [ wt% ]
Fuel pellet density [ %TD ]
Fuel pellet diameter [ mm ]
Fuel pellet height [ mm ]
UO2
5.7 94.0 8.59 15.20 Cladding tube material
Cladding tube inner diameter [ mm ]
Cladding tube outer diameter [ mm ]
Cladding as-fabricated hydrogen concentration [ wppm ]
Zircaloy-4 8.755 9.990 < 15
2.1.2 Pre-irradiation of the test rods
The test rods were pre-irradiated to burnups ranging from 4.4 to 5.2 MWd(kgU)-1 in
the Saxton experimental reactor, Pennsylvania, USA. This was a small pressurized LWR, developed by the Westinghouse Electric Corporation. It was operated from 1961 to 1972 with the primary objective of developing pressurized water reactor (PWR) technology [16]. The reactor core comprised 21 fuel assemblies of substanti-ally square geometry. Each fuel assembly contained approximately 72 individual fuel rods, charged with enriched UO2 and/or (U,Pu)O2 fuel. The core had an
effective diameter of 0.71 m and an effective height of 0.914 m with a nominal thermal output of 20 MW. The light water primary coolant entered the reactor at a temperature of 544 K and left it at a nominal temperature of 555 K. The nominal coolant pressure was 13.8 MPa.
Since the Saxton reactor was designed for experimental studies, provision was made for five removable subassemblies that could be inserted and withdrawn through special ports in the reactor vessel head without removing the head. The primary coolant side of the reactor was equipped with extensive instrumentation in comparison to that normally found in operating power reactors. In particular, the core was extensively instrumented to permit operational evaluation of the core performance [16].
The Saxton reactor was used for various experimental studies, and for this reason, the power histories experienced by the fuel rods were atypical of power histories in commercial PWRs. Most importantly, the fuel rod peak linear heat generation rate (LHGR) could be very high in the Saxton reactor, and the rod power varied substantially over time [17]. During part of the fuel life time, the local LHGR could reach extremely high values (>80 kWm-1), since the reactor was used to explore the
operating limits for various fuel designs. This lead to exceptional phenomena, such as formation of central holes in the fuel pellets, and to very high fission gas release. Unfortunately, the power histories of the MAPI test rods considered in this report are not known, and the same is true for the axial power distribution in the rods. In the calculations, these properties have been assumed, based on data available for other rods in the Saxton reactor; see section 3.2.2 and appendix A.
2.2 Rod
instrumentation
and pre-test examinations
After pre-irradiation in the Saxton reactor, the fuel rods to be used in the PBF RIA 1-2 test were re-fabricated and instrumented. The two test rods considered in this report, 802-1 and 802-2, were punctured and back-filled with a mixture of helium and argon gas to room temperature pressures of 0.105 and 2.40 MPa, respectively. The higher pressure in rod 802-2 was representative for the typical end-of-life gas pressure in the MAPI rods. The same gas composition was used for both rods: 77.7
% He and 22.3 % Ar. This composition was intended to simulate the typical thermal conductivity of the pellet-cladding gap gas in the MAPI rods at end of life. The reason for simulating end-of-life conditions in the back-filled rod 802-2 was to allow comparison with a MAPI test rod (802-3) that was not re-fabricated and back-filled with new gas after pre-irradiation in the Saxton reactor [15].
The test rods 802-1 and 802-2 were instrumented with two cladding surface thermo-couples each. In both rods, the thermothermo-couples were welded to the cladding surface at positions 0.46 and 0.79 m above the bottom of the fuel pellet column. Moreover, to allow on-line measurements of the rod internal gas pressure during the test, both test rods were instrumented with internal pressure transducers in the gas plenum volume at the upper end of the rod. Unfortunately, the transducer in rod 802-1 failed early during the test, and no gas pressure data were obtained for this test rod.
Non-destructive examinations of the test rods were carried out in order to examine the integrity of the rods and to obtain information on the test rod conditions before the pulse reactor test. The pre-test rod geometry was characterized by overall photographs, neutron radiographs and cladding profilometry [15]. In general, no major differences were observed in the overall appearance of the four test rods. The outer diameter of all rods was within 0.84 % of the nominal diameter, thus indicating moderate cladding creep deformation during pre-irradiation. Neutron radiographs did not show any unusual disturbances in the fuel pellet column, i.e. gaps in the pellet stack or unusual cracking. Pulsed eddy current scans did not indi-cate any incipient cracks on the inner surface of the cladding of any of the four test rods before PBF testing. Hydrogen analyses of cladding from other MAPI rods that had been irradiated in Saxton to burnups similar to those of the PBF RIA 1-2 test rods, i.e. 5 MWd(kgU)-1, showed a hydrogen concentration of about 40 wppm [15].
2.3 Pulse reactor test and post-test examinations
The PBF was an open-vessel type test reactor, operated by the Idaho National Laboratory (INL) from 1972 to 1985 for a wide spectrum of experiments [18]. The reactor core in the PBF was a right circular annulus, 1.3 m in diameter and 0.91 m high, with a centrally located, vertical test space, 0.21 m in diameter. The core was fuelled with 18.5 % enriched 235U, contained by approximately 2400 fuel rods.
These rods were grouped in closely packed, square-lattice canisters, each containing from 28 to 62 rods. The fuel rods were composed of ternary (20.6 % urania, 61.8 % zirconia, and 7.6 % calcia) ceramic fuel pellets, contained in a ceramic (zirconia, calcia) thermal insulator and a stainless steel cladding tube. This design restricted the rate of heat transfer from fuel to coolant during transient heating of the core, thereby providing an inherent shutdown mechanism through Doppler feedback of the 238U.
Two sets of moveable poison rods with boron carbide, named control rods and transient rods, were used for on-line reactivity control in the driver core. Eight control rods maintained basic reactivity control, while four transient rods were used
for changing the reactor power at various rates. For RIA simulation tests, the transient rods could be ejected from the core with a maximum velocity of 9.5 ms-1,
resulting in a reactivity addition rate of 5×10⁻⁴ s-1 or a reactivity insertion time of
about 50 ms [15]. The power pulse generated in the PBF RIA 1-2 test is shown in Figure 1. In the computational analyses of the test, the pulse shape is approximated with the analytical expression derived by Nordheim and Fuchs [19], which is included in the figure for comparison. This expression is reported to be a fair approximation for RIA power pulses that result from LWR cores that go prompt critical [20].
Figure 1: Normalized power pulse in the PBF RIA 1-2 test (red circles) in comparison with the Nordheim-Fuchs analytical pulse shape (black line)
used in the computational analyses of the test; see section 3.4.2.
Figure 2: Typical axial power profile in the PBF with a water-filled IPT [18].
An in-pile tube (IPT) occupied the vertical test space in the centre of the PBF core. The IPT had an inside diameter of 155 mm and an inside length of 4.47 m. The IPT extended 2.67 m above and 0.88 m below the core. A typical axial power profile for
a water-filled IPT in the PBF core region is shown in Figure 2. The IPT was a thick-walled (25.4 mm) pressure tube, fabricated from Inconel 718, as shown in Figure 3. It was designed to contain steady-state operating pressures and pressure surges that resulted from test fuel failure. A flow tube with a central section (through the reactor core) of Zircaloy-2 was positioned within the IPT to direct coolant flow: Coolant entered the top of the IPT from the side, above the reactor core, and flowed down the annulus between the IPT wall and flow tube. At the bottom of the IPT, the coolant reversed direction and flowed up through the test fuel rods in the experiment location, and then exited at the IPT outlet. The IPT was connected to a test loop, as illustrated in Figure 4. Parts of the loop indicated with dashed lines in Figure 4 were used in tests that simulated loss-of-coolant accident (LOCA) conditions, whereas parts indicated with solid lines are relevant for RIA simulation tests. The acoustic filters and rupture disks, placed at the IPT inlet and outlet, reduced or controlled pressure surges that propagated down the loop piping during test fuel failure. System pressure was maintained by a pressurizer connected to the loop piping near the pump inlet. More precisely, immersion heaters in the pressurizer maintained the pressurizer water at the saturation temperature corresponding to the desired loop operating pressure [18].
Figure 3: Axial cross section of the PBF in-pile tube (IPT) [21]. The four test rods in the PBF RIA 1-2 test were individually shrouded and installed in a support structure termed the test assembly; see Figure 5. The flow shrouds were made of Zircaloy-4, and had an inner diameter of 16.3 mm. Each flow shroud was instrumented with thermocouples at the inlet (bottom) and outlet (top), an inlet turbine flowmeter to measure coolant flow through the shroud, and an outlet pressure transducer. Additional pressure transducers were also mounted close to the outlet of the IPT. A linear variable differential transformer (LVDT) was mounted below the lower end of each test rod for on-line measurement of rod elongation during the test.
The nominal coolant pressure and temperature in the IPT during the test was 6.45 MPa and 538 K, respectively, and the axial velocity of the water flowing through the shrouds was about 0.65 ms-1.
Figure 4: Experiment loop in the PBF [18]. Solid lines indicate parts of the loop that are relevant for the considered RIA simulation tests.
Figure 5: Cross-sectional view of the test assembly used within the IPT in the PBF RIA 1-2 test [14].
The PBF RIA 1-2 test procedure was started with a non-nuclear loop heat-up phase, which was followed by a nuclear power calibration and fuel rod preconditioning phase. The reactor was then shut down for flux wire replacement, followed by a second loop heat-up prior to the power burst, and finally, the transient power burst.
A single power pulse of about 60 ms duration was produced, resulting in a total fuel pellet radially averaged energy deposition of 1000 J(gUO2)-1 at the axial power peak
and a radial average peak fuel enthalpy of 775 J(gUO2)-1 [15].
The test rods were comprehensively examined after the pulse test [15]. Exami-nations included rod diameter profile measurements, metallography of the cladding tubes and ceramography of the fuel pellets. Cladding samples from different axial positions were also tested for post-test hardness and hydrogen concentration. The hardness measurements, combined with metallographic results for cladding oxide layer thickness and past α/β phase composition, were used for estimating the peak temperatures experienced by the cladding samples during the test. This served as an independent verification of the temperatures recorded during the test by the cladding surface thermocouples.
One of the test rods, 802-3, failed during the test, while the remaining three rods survived. The failure of rod 802-3 was characterized by at least 22 longitudinal cladding cracks, all less than 1 cm long, dispersed over the central two-thirds of the test rod. Several of these cracks were examined to determine the failure mode and to identify the root cause for the numerous cracks. Although the failure mode of rod 802-3 was not conclusively identified, it was suspected that the failure of this particular rod was related to its fill gas: in contrast to the other three rods in the PBF RIA 1-2 test, rod 802-3 was never opened and back-filled with He-Ar gas before the test. It was tested with its original (as-fabricated) fill gas, which was air at atmospheric pressure. From more recent research, it is known that air-zirconium reactions at high temperature lead to severe embrittlement of the cladding by oxidation and nitriding [22].
3 Computer
analyses
3.1 Methodology
Computer analyses of the PBF RIA 1-2 test were carried out in three consecutive steps, using three different computer programs, as illustrated in Figure 6. In the first step, the operating history of a MAPI fuel rod in the Saxton reactor was modelled by use of FRAPCON-3.3-SKI. This is the SKI/SSM-version of FRAPCON-3.3, a computer program designed for analysing long-term steady-state operation of LWR fuel rods [23, 24]. In the second step, calculated data defining the end-of-life conditions for the irradiated fuel rod were extracted from FRAPCON output by use of the FRAPAIR-2 interface program [25]. These data, which define the burnup dependent pre-test conditions of the test rod, were used as input to the final analysis step. This step involved modelling of the pulse reactor test by use of the SCANAIR V_7_6 computer program [26], which has been extended with the updated QT-COOL two-phase coolant channel module [13]. Henceforth, this program is referred to as SCANAIR-7.6-SSM for simplicity. In fact, the analyses in Step 3 were repeated, since two of the test rods, 802-1 and 802-2, which differed only with regard to the pre-test fill gas pressure, were analysed. Both FRAPCON and SCANAIR are best-estimate computational tools, and throughout the analyses, we strived to use the computer programs with their recommended (default) best-estimate models. However, some parametric studies were conducted with rod 802-1 as a baseline case.
Figure 6: Procedure used in computer analyses.
3.2 Analyses of fuel pre-irradiation with FRAPCON
3.2.1 Description of the FRAPCON-3.3-SKI program
A specific SKI/SSM-version of the FRAPCON-3.3 steady-state fuel performance program was used for establish burnup-dependent initial conditions to the pulse test simulations. This version is henceforth named FRAPCON-3.3-SKI. In comparison with the standard version of FRAPCON-3.3 [23, 24], it has an interface (specific output data file) to SCANAIR [25].
3.2.2 Models and input used for the analyses
The irradiation of the MAPI fuel rods in the Saxton experimental reactor to a rod average burnup of 4.9 MWd(kgU)-1 was simulated by use of recommended (default)
models and options in FRAPCON-3.3-SKI. The input used for the analyses consists of design data and operating conditions for the fuel rods. Most of the rod design data are readily available in literature [14], but detailed information on the operating history of the two considered test rods is unfortunately unavailable. For this reason, a simplified operating history and an assumed axial power profile was used in the analyses. The same power history and axial power history was assumed for both the considered test rods. The input used in the analyses of test rod pre-irradiation with FRAPCON-3.3-SKI is specified in appendix A.
3.3 Simulation of test rod re-fabrication with
FRAPAIR
As described in section 2.2, after irradiation in Saxton, the MAPI fuel rods M-2 and M-13 were re-fabricated into the PBF test rods 802-1 and 802-2. In direct corre-spondence to the re-fabrication procedure for the test rods, calculated end-of-life fuel rod conditions, such as fuel pellet and cladding tube deformations, distributions of fuel plutonium and gaseous fission products, cladding tube hydrogen content etc., were extracted from FRAPCON-3.3-SKI output and transferred to SCANAIR-7.6-SSM input by use of the FRAPAIR-2 interface program [25]. These data defined the initial conditions for fuel and cladding, which were needed for analysing the PBF RIA 1-2 test with SCANAIR-7.6-SSM.
In the simulated re-fabrication process, the fuel rod free gas inventory was replaced with a gas mixture of 77.7 % He and 22.3 % Ar. Following the specifications for the test rods [15], the room temperature internal gas pressure was set to 0.105 MPa for rod 802-1 and to 2.40 MPa for rod 802-2. It should be emphasized that this difference in pre-test gas pressure is the only difference between the two test rods considered in our simulations. In reality, however, other differences may have existed between the rods, caused by differences in their pre-irradiation conditions. When transferring end-of-life fuel rod data from FRAPCON-3.3-SKI output to SCANAIR-7.6-SSM input, the pellet-cladding gap size calculated by FRAPCON-3.3-SKI was modified. This modification is necessary, since FRAPCON and SCANAIR have very different models for fuel pellet cracking and for deformation of the cracked fuel material. Moreover, during the simulated pre-irradiation, the LHGR reached sufficiently high values in the central part of the fuel rod to activate gaseous swelling of the fuel pellets. Since FRAPCON-3.3-SKI lacks a model for gaseous fuel swelling, the radial deformation of the fuel pellets was underestimated by the program. The modification introduced for the pellet-cladding gap are further described in section 4.1 below.
3.4 Analyses of pulse reactor test with SCANAIR
3.4.1 Description of SCANAIR-7.6-SSM
The SCANAIR program is developed and maintained by Institut de Radioprotection et de Sûreté de Nucléaire (IRSN), France. It is designed specifically to model the thermal-mechanical behaviour of LWR fuel rods under reactivity initiated accidents [1, 2]. The official version of SCANAIR V_7_6 [26], which was released in January 2016, contains the original QT-COOL two-phase coolant channel module from 2013 [3] as an option to the default single-phase coolant model. The recently updated version of the two-phase model [13] has been implemented in the SSM-version of the program (SCANAIR-7.6-SSM). The reason for using SCANAIR V_7_6 for the implementation is that this is the latest version of SCANAIR, for which SSM has access to the source code.
3.4.2 Scope of analyses
The purpose of the analyses with SCANAIR-7.6-SSM in this report was to validate the recently updated and improved version of the QT-COOL two-phase coolant channel module [13]. The validation was done by comparing calculated results for coolant and fuel rod properties against measured results for rod 802-1 and 802-2 in the PBF RIA 1-2 test. The analyses were done predominantly with recommended (default) best-estimate models; the most notable exception is the aforementioned two-phase coolant channel model.
In addition to the best-estimate analyses, some parametric studies were conducted with rod 802-1 used as a baseline case. These studies were aimed to investigate the effect of particular modelling aspects on the calculated coolant behaviour and the clad-to-coolant heat transfer. More precisely, in the parametric studies:
The cladding-to-coolant heat transfer in the film boiling heat transfer regime was varied, in order to study its importance to fuel rod and coolant behaviour; The calculation of local coolant pressure was cancelled, in order to study the
effect of local pressure variations in space and time;
The velocity difference (slip) between steam and liquid in the coolant was cancelled, meaning that the two-phase coolant was described by a homo-geneous equilibrium model.
3.4.3 Models and input used for the analyses
The input used for the analyses with SCANAIR-7.6-SSM consists of three categories: i) data on the burnup-dependent pre-test state of the test rod, ii) definitions of the power pulse shape, axial power distribution and reactor coolant conditions for the test, iii) selections of appropriate modelling options, model
parameters and material property correlations. The major part of the input in the first category is defined by the end-of-life conditions for the considered MAPI fuel rod, as calculated with FRAPCON-3.3-SKI. Only the composition and pressure of the rod internal gas and the pellet-cladding gap size are set by hand. The second and third categories of the SCANAIR input are described in appendices B and C.
It should be remarked that two model parameters in the QT-COOL coolant channel module were used as fitting parameters in the calculations, i.e. they were tuned such that the calculated results from SCANAIR-7.6-SSM agreed with measured data from the PBF RIA 1-2 test. The first of these parameters, FLUFRIC-MUL, is a multiplier for the wall friction loss coefficient (friction factor) for the coolant. The second parameter, FILM-MUL, is a multiplier for the clad-to-coolant heat transfer coefficient in the film boiling heat transfer regime. Both parameters are used as constant, user-defined multipliers, which are applied to the coefficients calculated through best-estimate correlations in the QT-COOL coolant channel module [13]. All analyses presented in this report were done with FLUFRIC-MUL=10 and FILM-MUL=2.3; see appendix C.
4 Results and discussion
4.1 Analyses of fuel rod pre-irradiation
Key results from the simulated pre-irradiation of the test fuel rods are summarised in Table 2. The calculated results pertain to both rod 802-1 and 802-2, since they had identical design and were subjected to identical irradiation conditions in our analyses. For comparison, available measured data from pre-test examinations of the test rods are included in the table.
Table 2: Calculated fuel rod properties at end of pre-irradiation in the Saxton reactor. Measured data are given for comparison, when available [14, 15].
Property Calculated Measured
Fuel pellet average burnup [ MWd(kgU)-1 ] 4.90 5.1–5.2
Cladding oxide layer thickness [ µm ] 0.8–1.5 < 5 Cladding hydrogen concentration [ wppm ] 16–21 ~ 40 Cladding inward creep strain [ % ] 0.13–0.65 < 0.84
Rod average fission gas release [ % ] 5.68
-Pellet-cladding radial gap width [ µm ] 29–63
-The calculated cladding oxide layer thickness and hydrogen concentration are lower than the measured values, but it should be borne in mind that the calculations are done with zero oxide and hydrogen as initial values. In reality, cladding in as-fabricated condition usually has 1-2 µm thick oxide and about 10 wppm hydrogen. The calculated end-of-life fuel fission gas release ranges from virtually zero at the fuel rod ends to about 12.5 % in the central peak power region of the test rod. Thermal fission gas release is calculated in the central two thirds of the rod.
Also the calculated end-of-life pellet-cladding gap width varies significantly along the test rod. This is illustrated in Figure 7, which shows the axial variation of the end-of-life, zero-power, room-temperature radial gap width, as calculated by FRAPCON-3.3-SKI. Also shown in the figure is the modified gap width that is used as input to the analyses with SCANAIR-7.6-SSM. The gap width in the central part of the rod has been reduced in this input, with the purpose to:
Compensate for modelling differences between FRAPCON and SCANAIR with regard to fuel pellet cracking and deformation of the cracked fuel material;
Reproduce gaseous swelling of the fuel pellets, which is a high-temperature phenomenon not modelled by FRAPCON-3.3-SKI.
The cold gap of 10 µm shown in Figure 7 corresponds to the differential defor-mation of the cladding tube and the fuel pellet column when downrating from steady-state conditions of pellet-cladding interaction at high power; see Figure A.1 in appendix A.
Figure 7: Axial variation of the end-of-life, zero-power, room-temperature radial gap width, as calculated by FRAPCON-3.3-SKI and
as defined in input to SCANAIR-7.6-SSM.
4.2 Analyses of pulse reactor test
Times reported in the following are counted from the time of peak power during the test, i.e. t = 0 refers to the peak of the power pulse, as shown in Figure 1. Moreover, the fuel enthalpy, Hf, discussed throughout this report is the radial average fuel
specific enthalpy, defined by
(1) where Rp is the fuel pellet radius, ρf is the fuel density, and hf is the local specific
enthalpy of the fuel material. The integrals in eq. (1) are evaluated at a specific axial position of the fuel pellet column; in this report at the peak power position of the test rod, unless otherwise stated.
As long as the fuel is in solid state, hf is simply calculated from the local fuel
temperature, Tf, through (2) Rp Rp H f =
h fρ f r dr
ρ fr dr , 0 0 Tf h (T ) f f =
c (T ) dT f , Towhere cf is the specific heat capacity of the solid fuel, and To is a reference
temperature at which hf = 0 by definition. In this report, we use To = 293.15 K,
which is the reference temperature used in SCANAIR V_7_6 [26]. It should be
remarked that other values for To are used in different literature sources, usually
without clearly defining the value.
4.2.1 Fuel pellet enthalpy and temperature
Table 3 shows the peak values of fuel pellet enthalpy, Hf, and temperature, Tf.
calculated with SCANAIR-7.6-SSM. The results refer to the peak power axial position of test rods 802-1 and 802-2. The fuel enthalpy in Table 3 is defined as the peak fuel pellet radial average value, calculated with respect to a reference temperature of 293 K. With this reference temperature, the calculated initial (pre-pulse) fuel enthalpy was 68.8 J(gUO2)-1 in the considered tests. For comparison, the
peak fuel enthalpy reported in [15] is 185 cal(gUO2)-1 for all rods, which
corresponds to 774 J(gUO2)-1. Hence, the difference between the calculated and
reported peak fuel pellet radial average enthalpies is less than 3 %.
The calculated times at which the peak fuel enthalpy is reached are also indicated in Table 3. The peaks are reached 24.5 and 24.6 ms after peak power, which means that the time lag is 50 % longer than the width of the power pulse (16 ms).
The peak fuel temperatures in Table 3 are the local maximum temperatures with regard to both space and time. According to the calculations, these maxima are obtained at a distance of about 0.5 mm from the fuel pellet surface for the considered test rods. We note that the UO2 melting point (solidus temperature) is
typically 3100 K for the fuel burnup considered here [27]. The calculated peak fuel temperatures thus suggest that there is a considerable margin to fuel melting in the PBF RIA 1-2 test. From Table 3, it is clear that the calculated differences between the two test rods with regard to peak fuel enthalpy and temperature are small.
Table 3: Calculated peak fuel enthalpies and temperatures for the PBF RIA 1-2 test rods 802-1 and 802-2.
Property 802-1 802-2
Calculated peak radial average
fuel pellet enthalpy, Hf [ Jg
-1 ] 755.1 752.1
Calculated time lag between peak power and peak fuel enthalpy Calculated peak fuel temperature, Tf
Calculated time lag between peak power and peak fuel temperature
[ ms ] [ K ] [ ms ] 24.5 2590 26.0 24.6 2587 25.6
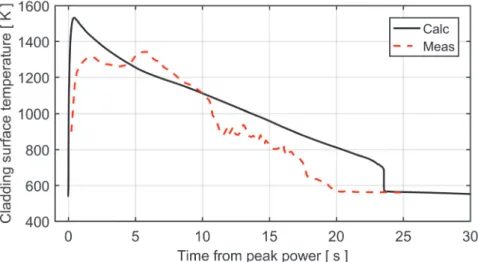
4.2.2 Cladding tube surface temperature
The calculated temperature evolution for the cladding tube outer surface (oxide-water interface) is compared with measured data from the cladding surface thermo-couples in Figure 8 to Figure 11. The calculated temperatures pertain to the axial
centre positions of axial segments 10 and 16 in the discretized rod geometry, which are located 0.482 and 0.787 m from the bottom of the fuel pellet column. The thermocouple positions are similar but not identical; 0.46 and 0.79 m, respectively. The peak power position of the rods is slightly below the lowermost thermocouple; see Figure 2.
Figure 8: Calculated temperature for the cladding tube outer surface of test rod 802-1, in comparison with data from the lower thermocouple (0.46 m).
Figure 9: Calculated temperature for the cladding tube outer surface of test rod 802-2, in comparison with data from the lower thermocouple (0.46 m). From the figures, it is clear that a boiling crisis occurs at both thermocouple locations for both rod 802-1 and rod 802-2. The boiling crisis occurs within about 25 ms after peak power and results in a phase with film boiling and high cladding temperature. The duration of the film boiling phase is shorter at the upper thermo-couple location, and so is the peak cladding temperature reached during the film
boiling. The observed differences between the two test rods are small, considering the scatter normally seen in thermocouple measurements of this kind [28].
Figure 10: Calculated temperature for the cladding tube outer surface of test rod 802-1, in comparison with data from the upper thermocouple (0.79 m).
Figure 11: Calculated temperature for the cladding tube outer surface of test rod 802-2, in comparison with data from the lower thermocouple (0.79 m). Details of the calculated results for the film boiling phase at the two different thermocouple locations are given in Table 4 and Table 5. The calculated critical heat flux, i.e. the clad-to-coolant heat flux at which the boiling crisis is assumed to start, ranges from 7.6 to 9.4 MWm-2. Two comments should be made on these results: (i)
the numbers are similar for the two axial locations, and the differences between the two test rods are moderate; (ii) the calculated values are significantly higher than critical heat fluxes that are typical for quasi-stationary conditions and mild transients. This is not surprising, since separate effect tests have revealed that there
are significant kinetic effects involved in the clad-to-water heat transfer under fast power transients, and the boiling crisis under RIA therefore differs from that under quasi-stationary conditions [7, 29, 30]. The data at hand from pulse reactor tests and separate effect tests under RIA-like conditions indicate that the energy deposition to the fuel, the coolant subcooling, the thermal conductance of the pellet-cladding gap, and the cladding oxide layer thickness and surface properties decide whether a boiling crisis will occur or not [7, 29, 31, 32].
The observed effect of pellet-cladding gap conductance is relevant for the differences between test rods 802-1 and 802-2 in our calculations. It is known from parametric experimental studies that a pellet-cladding gap with high thermal conduc-tance, e.g. a narrow or closed gap, promotes the boiling crisis [33]. This is consistent with our calculated results, which shows that the boiling crisis occurs earlier in rod 802-2 than in 802-1, and that the film boiling phase lasts somewhat longer. In our calculations, the only difference between the two test rods is the rod internal fill gas pressure, which results in a higher gap conductance for the high-pressure rod 802-2.
Table 4: Calculated results for the film boiling phase at the lower thermo-couple location, 0.46 m above the bottom of the fuel pellet column.
Calculated property 802-1 802-2
Time at onset of boiling crisis [ ms ] 4.30 3.47 Cladding surface temperature at ǁ
-Critical heat flux
[ K ] [ MWm-2 ] 592 7.60 592 7.78 Time at cladding re-wetting [ s ] 23.6 25.0 Cladding surface temperature at ǁ
Cladtocoolant heat flux at ǁ
-[ K ] [ MWm-2 ] 680 21.1 680 20.0 Peak cladding surface temperature
Time of ǁ -[ K ] [ s ] 1532 0.434 1443 0.581 Table 5: Calculated results for the film boiling phase at the upper
thermo-couple location, 0.79 m above the bottom of the fuel pellet column.
Calculated property 802-1 802-2
Time at onset of boiling crisis [ ms ] 21.8 21.3 Cladding surface temperature at ǁ
-Critical heat flux
[ K ] [ MWm-2 ] 597 8.75 598 9.45 Time at cladding re-wetting [ s ] 11.2 13.6 Cladding surface temperature at ǁ
Cladtocoolant heat flux at ǁ
-[ K ] [ MWm-2 ] 648 19.6 648 19.9 Peak cladding surface temperature
Time of ǁ -[ K ] [ s ] 1105 0.376 1136 0.385 22
Results from pulse reactor RIA simulation tests generally show that the peak cladding temperature reached under conditions of film boiling is correlated to the energy deposition, and the same is true for the duration of the film-boiling phase [33-35]. The differences in calculated results for the two axial positions fully agree with this observation.
It should be remarked that the in-reactor surface temperature measurements on pre-irradiated fuel rods in pulse reactor tests suggest that film boiling under RIA is a
local phenomenon. Measured temperatures often differ by several hundreds of
kelvin between thermocouples, although their spacing is just a few centimetres. Post-test measurements of Vickers hardness for the cladding also bear witness to large axial and circumferential variations in peak cladding temperature during the transient [36]: since softening of irradiated cladding by annealing of radiation damage occurs within less than 10-15 s at temperatures above 600 °C [37], it is possible to determine whether a boiling crisis has occurred during the test by detecting changes in Vickers hardness. In the PBF RIA 1-2 test, this method was combined with post-test metallography (measurements of cladding oxide layer thickness and past α/β-phase composition) for estimating the peak temperatures experienced by the cladding samples during the test. The results of these post-test examinations suggested that the true peak cladding surface temperature for rods 802-1 and 802-2 during the film boiling phase would have been about 100 K higher than the temperatures recorded on-line by the thermocouples that were welded to the cladding surface. This result is consistent with other studies of the so-called thermocouple fin effect [38].
The calculated variation of cladding surface temperature along the test rods at various points in time is shown in Figure 12 and Figure 13. It is clear that film boiling, leading to high cladding temperatures, takes place along most of the rods: according to the calculations, only a 5-10 cm long section at each end of the rods maintains low cladding temperature throughout the test. Somewhat surprisingly, the highest cladding temperatures are reached well below the peak power position of the test rods. We also note that the axial variation in cladding surface temperature is more strongly peaked to the lower part of the rod for test rod 802-2 than for 802-1. As will be shown below, this calculated difference can be understood from differences in the evolution of coolant properties and cladding deformation between the two test rods.
Figure 12: Calculated space-time variation of the cladding tube outer surface temperature for test rod 802-1.
Figure 13: Calculated space-time variation of the cladding tube outer surface temperature for test rod 802-2.
4.2.3 Coolant properties
Calculated time histories for the coolant pressure at the inlet and outlet position1 of
the flow shroud for test rod 802-1 are shown in Figure 14, together with measured data from the shroud outlet position. In the calculations, the coolant pressure was prescribed to a constant value of 6.45 MPa about one meter downstream of the shroud outlet; see appendix B. With this boundary condition for the pressure, the coolant channel wall friction loss coefficient was tuned, such that the calculated and measured outlet peak pressures agreed; see section 3.4.3.
1 Henceforth, the shroud outlet position in the calculation refers to the upper end of
the active part of the test rod, i.e. to the 18:th axial segment of the discretized rod; see Figure B.1 in appendix B.
The calculated as well as the measured coolant pressure increases by about 0.4 MPa as a result of rapid steam generation during the pressure pulse. The calculated axial pressure drop along the flow shroud reaches a maximum value of about 0.1 MPa just after the power pulse, when the void (steam) fraction reaches its peak value: the pressure drop increases significantly with the void fraction, according to the correlation for frictional loss in QT-COOL [13].
After the power pulse, the measured outlet pressure first drops below the loop nominal pressure of 6.45 MPa, after which it slowly starts to increase significantly at
t > 15 s. This behaviour, which is probably related to the response of remote parts of
the test loop to the generated steam, is not captured by our model. Instead, the calculated pressures gradually return to their pre-pulse values. The calculated curves in Figure 14 exhibit small peaks, which are related to puffs of steam that are generated when axial segments in the discretized fuel rod geometry are re-wetted: from Table 4 and Table 5, it is clear that re-wetting involves a very high clad-to-coolant heat flux, which results in sudden steam generation. These calculated bursts of steam are artefacts, caused by the discretizaton of the test rod into a finite number of axial segments: in reality, the re-wetting progresses gradually along the test rod.
Figure 14: Calculated versus measured coolant pressure evolution for test rod 802-1.
Figure 15 shows the calculated evolution of coolant temperature at the shroud outlet position for test rod 802-1, in comparison with measured data. After the power pulse, the calculated coolant temperature increases rapidly from 538 K and then follows the saturation temperature as the pressure slowly decreases. At t = 22 s, the coolant temperature starts to drop below the stauration value. First, this occurs inter-mittently, as slugs of subcooled water passes through the outlet, but beyond t = 26 s, the water remains in subcooled state. The calculated temperature evolution agrees fairly well with the measured data. Very similar, although not entirely identical, time histories for coolant pressure and temperature are calculated for test rod 802-2.
Figure 15: Calculated versus measured coolant temperature
evolution at the shroud outlet position for test rod 802-1.
The calculated coolant mass flux at the shroud outlet position is plotted versus time in Figure 16 for the two considered test rods. For both rods, there is a major peak just after the power pulse, caused by excessive steam generation along the rod. Later in the transient, there are smaller peaks in the calculated outlet mass flux. These peaks are caused by puffs of steam that are generated when axial segments in the discretized fuel rod geometry are re-wetted; compare the calculated pressure curves in Figure 14. There are differences in the calculated timing of these re-wetting events between the two test rods, but the general behaviour is similar.
Figure 16: Calculated coolant mass flux vs time at the shroud outlet position. The first second of the transient is shown in more detail in Figure 17, which reveals surprisingly large differences between the two test rods: we recall that, in the calculations, the rods differ only by their internal gas pressure. To understand these differences in calculated mass flux, it is necessary to compare how the steam (void) fraction evolves along the two test rods shortly after the power pulse.
Figure 17: Close-up of Figure 16, showing the first second of the transient. Figure 18 and Figure 19 show the calculated distribution of steam/void along the two rods for selected points in time. Also the downstream coolant channel that is considered in the analyses with SCANAIR-7.6-SSM is included in the figures; see appendix B.
From these figures, it is clear that in rod 802-1, significant steam formation is calculated to occur, not only at the high-power central part of the rod, but also at the lower end of it. In rod 802-2, on the other hand, the steam generation evolves from the central and upper parts of the rod only. This is because a boiling crisis is calculated to occur at the lower end of rod 802-2 early in the transient, which effectively limits the clad-to-coolant heat transfer; compare with Figure 13.
Figure 18: Calculated evolution of coolant void fraction along test rod 802-1 and the downstream coolant channel included in the analyses.
Figure 19: Calculated evolution of coolant void fraction along test rod 802-2 and the downstream coolant channel included in the analyses. The calculated steam generation at the lower end of test rod 802-1 has a strong effect on the evolution of coolant mass flux along the rod. This is clear from Figure 20 and Figure 21, which show the calculated mass flux along the two rods for the same points in time as used in the above figures.
In conclusion, the difference in pellet-cladding gap conductance between the two considered test rods, which in our calculations is caused solely by the difference in rod internal gas pressure, has a surprisingly strong effect on the calculated clad-to-coolant heat transfer and the response of the clad-to-coolant for the considered experiment.
Figure 20: Calculated evolution of coolant mass flux along test rod 802-1 and the downstream coolant channel included in the analyses.
Figure 21: Calculated evolution of coolant mass flux along test rod 802-2 and the downstream coolant channel included in the analyses.
4.2.4 Fuel rod internal pressure and fuel fission gas release
The calculated evolution of rod internal gas pressure is shown in Figure 22 for test rod 802-1 and in Figure 23 for 802-2. For rod 802-1, the calculated gas pressure remains well below the coolant pressure (~6.5 MPa) during the entire test, notwith-standing significant transient fission gas release from the fuel: the calculated rod average release during the test is 10.2 % for rod 802-1. The pressure difference results in inward creep deformation of the cladding during most of the high-temperature phase, leading to partial collapse of the cladding tube: see section 4.2.5.
Figure 22: Calculated rod internal pressure versus time for test rod 802-1. For rod 802-2, the calculated gas pressure exceeds the coolant pressure for t < 0.5 s. The gas pressure drops rapidly after the power pulse, because of cladding expansion and cooling of the gas within the pellet-cladding gap and the fuel rod plenum volume. Moreover, no transient fission gas release is calculated for rod 802-2,
indicating that the fission gas release model in SCANAIR-7.6-SSM is sensitive to the rod internal gas pressure.
Figure 23: Calculated rod internal pressure versus time for test rod 802-2. The gas pressure measured in the rod plenum is included for comparison. From Figure 23, it is clear that the calculated internal gas pressure evolution for rod 802-2 is much different from the pressure history recorded by the pressure trans-ducer in the rod plenum volume. In the calculations with SCANAIR-7.6-SSM, we used the default model (‘model1’; see appendix C) for calculating fuel fission gas release and rod internal gas pressure. With this model, the rod internal gas pressure is calculated from the equation of state for an ideal gas, on the assumption that the pressure is uniform within the fuel rod. From this assumption, it follows that the rod internal gas pressure, Pg, can be calculated through
(3)
Pg = n R ,
V Ti ii
where n [mol] is the total amount of gas within the rod free volume, R is the universal gas constant, and Vi and Ti are the volume and absolute temperature of the
gas within the i:th partial free volume of the fuel rod. In our analyses, these partial volumes are the pellet-cladding gap in each of the 30 computational axial segments, and the rod upper plenum. The gap gas temperature is in SCANAIR-7.6-SSM calculated from the arithmetic average of the pellet and cladding surface temperatures, and the plenum gas temperature is in our analyses calculated through equation (B.1) in appendix B.
Equation (3) is based on the assumption that axial gas flow within the pellet-cladding gap along the fuel rod is unrestricted, and that there is no delay in gas pressure equilibration between different axial segments of the rod. Considering the weak pressure peak recorded by the gas plenum pressure transducer in rod 802-2, it seems that this assumption is incorrect. The transducer data clearly suggest that the rod plenum was isolated from (most of) the heated section of the rod during the
power pulse, due to closure of the pellet-cladding gap. There is a model for restricted axial gas flow in SCANAIR V_7_6, by which the inner gas pressure can be calculated with higher fidelity than by equation (3). However, this model was not used in our analyses, since the fuel rod gas plenum was modelled at a significant distance from the hot part of the test rod; see Figure B.1 in appendix B.
Finally, there is another remark to be made about Figure 23: After the pellet-cladding gap has opened, the calculated gas pressure decreases slowly from about 6.5 MPa at t = 1 s to 4 MPa at t = 25 s. The measured plenum gas pressure, on the other hand, remains more or less constant at 6 MPa during this period. The nearly constant gas pressure is difficult to understand in light of the measured decrease in cladding outer surface temperature for the test rod; see Figure 9 and Figure 11. Unfortunately, the fission gas release from the fuel during the PBF RIA 1-2 test was not measured, so it is impossible to know whether transient fission gas release may have played a role in maintaining the rod internal gas pressure.
4.2.5 Circumferential deformation of the cladding tube
During the power pulse in the PBF RIA 1-2 test, the cladding tubes of the four test rods are mechanically loaded mainly by contact with the thermally expanding fuel pellets. This loading, in combination with a lowering of the cladding yield strength by the rapidly increasing temperature, results in plastic deformation of the cladding during the early part of the test. According to our calculations with SCANAIR-7.6-SSM, the mechanical loading from the pellets ceases about 50 ms after the peak of the power pulse. After this point, the cladding tube experiences a load reversal: for the rest of the transient, it is loaded by external overpressure, which makes it deform gradually inward by high temperature creep.
The deformation process is illustrated for rods 802-1 and 802-2 in Figure 24 and Figure 25. The calculated results are the cladding tube hoop total (elastic, thermal, plastic and creep) strains, evaluated at the metal-oxide interface, whereas the post-irradiation examination (PIE) data are residual (plastic and creep) strains, deter-mined by cladding diameter measurements after the test.
The calculated cladding strains at t = 0.1 s are caused mainly by the pellet-cladding mechanical interaction (PCMI). At this point in time, the magnitude and the axial variation of the cladding hoop strain largely reflect the axial power distribution along the test rods; see Figure 2. Since the power distribution is identical, the differences between the two rods are insignificant with regard to cladding hoop strain. Later in the transient, however, the calculated deformation behaviour of the two rods differs. More precisely, in the high pressure rod 802-2, there is a short (~0.4 s) period of internal gas overpressure after the PCMI loading has ceased, which leads to additional outward deformation of the cladding in the central, most heated, part of the rod. This deformation does not occur in rod 802-1, in which the calculated internal gas pressure is always below the coolant pressure; see section 4.2.4.
Figure 24: Calculated and measured circumferential (hoop) strain of the cladding tube for rod 802-1. Calculated results pertain to total strain,
whereas PIE measurements are residual (plastic+creep) strain.
Figure 25: Calculated and measured circumferential (hoop) strain of the cladding tube for rod 802-1. Calculated results pertain to total strain,
whereas PIE measurements are residual (plastic+creep) strain. For times beyond about 0.5 s, the internal pressure dops below the coolant pressure also in rod 802-2, leading to reversed cladding deformatin by inward creep. The high-temperature creep rate, as calculated by the applied ’zr-vp’ model in SCANAIR-7.6-SSM, depends on the α/β-phase composition of the material, which in turn depends on the cladding temperature and heating/cooling rate [26]. For rod 802-2, the modelling leads to a complex axial variation of cladding hoop strain at end of the test (t=∞). Likewise, the measured post-test strain distributions for the two rods are complex, with dips that suggest partial collapse of the cladding over axial segments that are about 5 to 10 centimetres in length. These strain dips are
probably a result of the significant local temperature variations that are known to occur under film boiling in RIA simulation tests; see section 4.2.2.
4.2.6 Parametric studies
As mentioned in section 3.4.3, the multiplier for the clad-to-coolant heat transfer coefficient in the film boiling regime, FILM-MUL, was used as a fitting parameter in the presented simulations of the PBF RIA 1-2 test with SCANAIR-7.6-SSM. Reasonable agreement between calculated and measured cladding outer surface temperatures was achieved with FILM-MUL=2.3, and this value was used in all analyses in this report.
This best-estimate value is significantly lower than 12, which was the best-estimate value for FILM-MUL used in earlier analyses of RIA simulation tests FK-1, FK-2 and FK-3 in the Nuclear Safety Research Reactor, Japan, with the original two-phase coolant channel model in SCANAIR [4, 5]. A likely reason for the difference is that these NSRR tests were conducted under very different cooling conditions: the coolant water was at room temperature and atmospheric pressure, there was no forced flow, and the coolant-to-fuel volume ratio was nearly two orders of magnitude larger than in the PBF RIA 1-2 test. These differences in cooling conditions, together with the fact that the power pulse widths in the NSRR were merely 4.4–6.7 ms, are likely to cause the differences in best-estimate values of FILM-MUL. Put it differently, the Groeneveld-5.7 heat transfer correlation that is used for the film boiling regime in QT-COOL [13] gives significantly better results for the PBF cooling conditions than for the conditions in the NSRR room tempera-ture test capsule.
Figure 26 shows the cladding surface temperature at the lower thermocouple position for rod 802-1, in comparsion with calculated results for three different values of FILM-MUL. From the figure, it is evident that this fitting parameter has a strong impact on the calculated cladding temperature and the duration of the film boiling phase in the PBF RIA 1-2 test.
As explained in section 1, the most important differences between the updated [13] and original [3] versions of the QT-COOL coolant channel module are related to the modelling of the two-phase fluid: the updated model accounts for velocity differen-ces (slip) between steam and liquid, and it also calculates the axial pressure distribution along the coolant channel by solving the one-dimensional conservation equation for momentum. To investigate the impact of these differences on calculated fuel rod and coolant properties, parametric studies were carried out with SCANAIR-7.6-SSM. The PBF RIA 1-2 test rod 802-1 was used as a baseline case in these studies, where the updated model applied throughout this report (nominal case) was compared with the cases of: (i) no modelling of velocity slip; (ii) no local pressure calculation. Except for these differences, the calculations were done with identical models and input.
![Table 1: Specifications of the MAPI test fuel rod design [14, 15]. TD denotes the UO 2 fuel theoretical density (10 960 kgm -3 )](https://thumb-eu.123doks.com/thumbv2/5dokorg/3335534.18285/17.892.212.676.691.995/table-specifications-mapi-test-design-denotes-theoretical-density.webp)
![Figure 2: Typical axial power profile in the PBF with a water-filled IPT [18].](https://thumb-eu.123doks.com/thumbv2/5dokorg/3335534.18285/20.892.216.679.704.964/figure-typical-axial-power-profile-pbf-water-filled.webp)
![Figure 3: Axial cross section of the PBF in-pile tube (IPT) [21]. The four test rods in the PBF RIA 1-2 test were individually shrouded and installed in a support structure termed the test assembly; see Figure 5](https://thumb-eu.123doks.com/thumbv2/5dokorg/3335534.18285/21.892.191.696.549.806/figure-section-individually-shrouded-installed-structure-assembly-figure.webp)
![Figure 4: Experiment loop in the PBF [18]. Solid lines indicate parts of the loop that are relevant for the considered RIA simulation tests](https://thumb-eu.123doks.com/thumbv2/5dokorg/3335534.18285/22.892.208.684.253.567/figure-experiment-solid-lines-indicate-relevant-considered-simulation.webp)