Developing a line balancing
tool for reconfigurable
manufacturing systems
A tool to support investment decisions
Postadress: Besöksadress: Telefon:
This final thesis has been carried out at School of Engineering in Jönköping within the subject area production systems. The work is a part of the Master of Science program Production Development and Management. The authors take full responsibility for the opinions, findings and conclusions presented.
Examiner: Carin Rösiö Supervisor: Gary Linnéusson Scope: 30 credits (second cycle) Date: 2021-06-03
Abstract
Abstract
Purpose This thesis aims to developing a decision-making tool which fits in a reconfigurable manufacturing system (RMS) milieu used to identify whether to introduce and produce a new product into an already existing assembly line or to invest in a new assembly line. To fulfil the purpose, four research questions were developed. Method Literature studies were performed in order to create a theoretical
foundation for the thesis to stand upon, hence enabling the possibility to answer the research questions. The literature studies were structured to focus on selected topics, including reconfigurable manufacturing systems, line balancing, and assembly line investment costs. To answer the third research question, which involved creating a decision-making tool, a single-case study was carried out. The company chosen was within the automotive industry. Data was collected through interviews, document studies and a focus group.
Findings & Analysis
An investigation regarding which line balancing solving-techniques suit RMS and which assembly line investment costs are critical when introducing new products has been made. The outputs from these investigations set the foundation for developing a decision-making tool which enables fact-based decisions. To test the decision-making tool’s compatibility with reconfigurable manufacturing systems, an evaluation against established characteristics was performed. The evaluation identified two reconfigurable manufacturing system characteristic as having a direct correlation to the decision-making tool. These characteristics regarded scalability and convertibility. Conclusions The industrial contribution of the thesis was a decision-making tool
that enables fact-based decisions regarding whether to introduce a new product into an already existing assembly line or invest in a new assembly line. The academic contribution involved that the procedure for evaluating the tool was recognized as also being suitable for testing the reconfigurable correlation with other production development tools. Another contribution regards bridging the knowledge gaps of the classifications in line balancing-solving techniques and assembly line investment costs.
Delimitations One of the delimitations in the thesis involved solely focusing on developing and analysing a decision-making tool from an RMS perspective. Hence, other production systems were not in focus. Also, the thesis only covered the development of a decision-making tool for straight assembly lines, not U-shaped lines.
Acknowledgment
Acknowledgment
We would like to grasp the opportunity to show our gratitude to the people who have supported and helped us during this master thesis. First of all, we would like to thank the case company for enabling us to be a part of their project and for providing valuable data and information. Also, we would like to send a special thanks to our contact person and supervisor Tobias, for all your help and support.
We would also like to address our greatest appreciation for our supervisor Gary Linnéusson at School of Engineering in Jönköping. Especially for your fantastic ability to constantly provide us with new ideas and suggestions. We have learned a great deal from you.
Lastly, we would also like to thank Simon Boldt for introducing the thesis proposal to us, ensuring we would get a very valuable head start in writing the thesis during these uncertain times.
Contents
Table of Contents
1 Introduction ... 1
1.1 Background ... 1
1.2 Problem description ... 2
1.3 Purpose & research questions ... 3
1.4 Delimitations ... 4
1.5 Thesis outline ... 4
2 Theoretical Framework ... 6
2.1 Reconfigurable manufacturing systems... 6
2.1.1 RMS classification ... 7
2.1.2 RMS characteristics ... 7
2.1.3 RMS characteristics and improvement levels ... 10
2.2 Single-, mixed- & multi-model assembly lines ... 11
2.3 Line balancing problems ... 12
2.4 Decision-making tools in line balancing ... 13
2.5 Line balancing models and computation... 14
2.6 Key performance indicators in line balancing ... 15
2.7 Assembly line investment costs ... 15
2.8 Monte Carlo simulations ... 15
3 Methodology... 17 3.1 Research design ... 17 3.2 Literature studies ... 18 3.3 Case study... 20 3.3.1 Interviews ... 20 3.3.2 Document studies ... 20 3.3.3 Focus group ... 21
3.4 Case company context ... 22
3.5 Model validation and testing ... 22
3.6 Trustworthiness ... 23
3.7 Ethical and moral perspective ... 24
4 Theoretical findings ... 25
4.1 RQ1 - Which line balancing problem-solving techniques exist in the literature? ... 25 4.2 RQ2 – Which investment costs can be considered vital for new assembly lines as a
Contents
5 Decision-making tool design ... 31
5.1 Decision-making tool outline ... 31
5.2 Decision-making tool structure & process steps ... 34
5.3 Evaluation of the decision-making tool ... 39
6 Analysis & discussion ... 40
6.1 Analysis and discussion of findings ... 40
6.2 Discussion of method... 52
7 Conclusions ... 54
7.1 Industrial contribution ... 54
7.2 Academic contribution ... 54
7.3 Limitations and future research ... 55
8 References ... 56
9 Appendices ... 63
Abbreviations
RMS Reconfigurable Manufacturing System
FMS Flexible Manufacturing System
DMS Dedicated Manufacturing System
DMT Decision-Making Tool
VSM Value Stream Mapping
SMED Single Minute Exchange of Die
SALBP Single Assembly Line Balancing Problem MMAL Mixed-Model Assembly Line
MMALBP Mixed-Model Assembly Line Balancing Problem
RPW Ranked Positional Weight
KWC Kilbridge and Wester Column
Contents
Figure List
Figure 1 - Thesis structure and outline ... 5
Figure 2 - DMS, FMS and RMS, adapted from Koren (2006). ... 6
Figure 3 - RMS soft and hard classification, based on ElMaraghy (2006). ... 7
Figure 4 - Reconfigurability in assembly production, based on Napoleone et al. (2018). ... 10
Figure 5 - Different assembly lines types, adapted from Olhager (2013). ... 11
Figure 6 - Assembly line balancing problems’ assumptions and constraints... 13
Figure 7 - Research design, adapted from Kovács & Spens (2005)... 17
Figure 8 - The applied process for the literature studies ... 18
Figure 9 - Line balancing technique classification ... 27
Figure 10 - Assembly line investment costs classification... 29
Figure 11 - Decision making tool outline ... 31
Figure 12 - Information flow and step connection ... 34
Figure 13 - Decision-making tool steps and task linkage ... 35
Figure 14 - Task input data... 35
Figure 15 - General information input ... 36
Figure 16 - Investment input data... 36
Figure 17 - Calculation of weighted task time and max task time ... 37
Figure 18 - Monte Carlo simulation ... 38
Figure 19 - Final result display... 38
Figure 20 - Combined assembly line investment cost categorization ... 42
Figure 21 - RMS characteristic and DMT connection, based on Napoleone et al. (2018) ... 50
Table List
Table 1 - RMS characteristics ... 8Table 2 - RMS sub-characteristics and descriptions, adapted from Rösiö et al. (2019). ... 9
Table 3 - Applied keywords and search results in the literature studies ... 19
Table 4 - Documents studied ... 21
Table 5 - RMS and DMT correlation, modified from Rösiö et al. (2019). ... 46
Table 6 - RMS characteristics and DMT correlation summary ... 48
Glossary
Task / Activity required to produce or assemble products or parts of a product operation
Station Workplace within the assembly line where one or several tasks are performed Task time Required time to perform a task. Also referred to as cycle time.
Takt time The rate in which a product needs to be completed in order to meet the customer demands
Introduction
1 Introduction
The first chapter introduces the reader to the thesis background and problem description, which involves rapid changes in customer demand, forcing companies to re-evaluate their production systems to keep up with the increased product introduction rate. Based on this challenge, the purpose and research questions have been created. The later part in this chapter presents the thesis delimitations and outline.
1.1 Background
We are living in a dynamic world driven by globalization and rapid economic growth. Customer needs are changing fast, resulting in shorter product life cycles and a higher product introduction rate. This puts production systems into a tough competitive environment in responding to the fluctuation of market demand and consumption trends. To survive this thought-provoking situation, production systems adopt different strategies (Ulrich & Eppinger, 2016). Companies may rely on platform-based product strategy and product families by applying flexible manufacturing systems (FMS) through robots and computer numerical control (CNC) machines. However, these machines tend to be very expensive, have a high level of capital investment and are not capable of mass manufacturing (Dhandapani et al., 2015). As a response to price competitiveness, firms tend to pursue a low-cost strategy by using optimization tools that improve the system's productivity and performance. Production development tools such as lean production, value stream mapping (VSM), single-minute exchange of die (SMED) and line balancing have been used as drivers for companies’ competitive advantage to thrive in the competition (Hallgren & Olhager, 2009; Jebaraj et al., 2013; Naor et al., 2010).
Reconfigurable manufacturing systems (RMS) have been presented as an approach to deal with the two-folded production capacity-product variety dilemma. The definition of RMS has been controversial. For instance, Koren et al. (1999) consider these as systems with the ability for rapid change of the production system, while Mehrabi et al. (2000) describe RMS as a stage between dedicatedmanufacturing systems (DMS) and flexible manufacturing systems (FMS). Nevertheless, researchers have agreed to describe RMS with some common characteristics. These regard scalability, customization, convertibility, modularity, integrability, diagnosability and mobility (Koren & Shpitalni, 2010; Maganha et al., 2019; Wiendahl et al., 2007). These characteristics support the production system's ability to respond to an increased product introduction rate. This can be achieved through a combination of changes, either in hardware, such as layout and equipment, or in logical planning and augmentation (Wiendahl et al., 2007). The second part of the dilemma regards cost reduction and productivity fluctuation. Line balancing has been used as a mathematical tool to design and calculate the efficiency of sequential operations for an assembly line. The operations in the assembly line are grouped within stations. The grouping is performed in order to distribute the workload by arranging tasks among production system’s resources, which enables the possibility of coping with variation between machine capacities to match the overall production rates (Baybars, 1986; Hoffmann, 1963).
The early model for line balancing, developed by Salveson (1955), was created with the purpose of reducing waste, waiting time, inventory, and absorb irregularities within the system. Several mathematical models have since then been developed to solve the line balancing optimization problems. These models usually include calculating the number of stations and layout based on the line cycle time and task (operation) time for every operation. Line balancing facilitates an understanding of the dependency between processes and the identification of the bottleneck
Introduction
operation, which is needed in order to make assembly lines more efficient. Consequently, applying line balancing can lead to the relocation of resources and merging operations or modification of the layout (Hoffmann, 1963; Nallusamy, 2016).
1.2 Problem description
RMS has been gaining more attention during the last few years (Andersen et al., 2017). However, thus far the majority of RMS literature has primarily focused on configurations, constellations, concept development and technological aspects (Napoleone et al., 2018). Even though RMS was found able to deal with the issues with DMS and FMS, some concerns still exist with this type of production system, such as, optimization problems (Yelles-Chaouche et al., 2020). Hitherto this has been neglected in academia, and only a few mathematical models for streamlining line efficiency of RMS have been established in the literature. For instance, Saxena & Jain (2012) present a three-phased methodology to decide RMS configuration for a specific time period, and Jianping et al. (2007) adopts an economic perspective in RMS line configurations and presents a novel optimization model. The lack of optimization tools might derive from the relative newness of RMS and the complexity of these types of production systems.
Instead of developing completely new production development tools, updating and adapting already existing tools to fit in new production settings is an alternative. One of the most common tools in production is the renowned line balancing (Erel & Sarin, 1998). However, previous line balancing models and techniques have foremost been related to DMS, especially for a single product, and not developed specifically for RMS (Son et al., 2001). For example, in Bortolini et al. (2018), who conducted an extensive literature study on the research trends of RMS, found the optimization aspect in line balancing to be neglected entirely. Nonetheless, Yuan et al. (2019) have actually directly addressed the issue by developing a reconfigurable assembly line balancing optimization model, specifically for cloud manufacturing systems. However, as the focus in Yuan et al.’s (2019) research has been on cloud manufacturing, which many companies have not yet adopted, it cannot be applied to the overarching mass of companies. Hence the issue of non-existing line balancing optimization models still exists. Nevertheless, some improvements have been made, for instance, as a response to the aforementioned growing customer trend for a higher level of product variability, as well as the shorter product life cycles, the mixed-model assembly line balancing methods was developed (Bukchin et al., 2002; Cevikcan et al., 2009). This comparatively new type of line balancing is taking the production of several products from the same product family into consideration when enhancing the line efficiency (Olhager, 2013; Şeker et al., 2013), hence it can be recognized as suitable to use in RMS settings.
Even though the production efficiency dilemma might be solved through utilizing line balancing, and the second part of the dilemma, namely, how to tackle an increased product introduction rate can be resolved through the implementation of RMS, some issues still exist. Because, an increased introduction rate also forces decision-makers to more frequently make rapid and accurate decisions. One of these decisions, which is recurrently taken during the early phase of the new product development process, includes deciding how and where to produce new product variants (Wouters et al., 2009). These complications are creating uncertainties within investment decisions. Thus, during the early stages of the product development process,
Introduction
In order to simultaneously evaluate the compatibility of product variants through line balancing, whilst also investigating the potential investment costs of upgrading or investing in new production systems, the aforementioned two-folded dilemma would be solved. Hence, there is an apparent need for a tool which simultaneously integrates line balancing with investment cost calculations while operating in a RMS milieu. Such a tool would enhance the decision-making regarding whether a new product should be produced in an already existing assembly line or if investing in a new assembly line is the most economically beneficial option. Thus far, such a decision-making tool that combines these two perspectives has not previously been investigated in academia.
1.3 Purpose & research questions
Given the problem stated above, the purpose of this thesis is to:
Develop a decision-making tool which fit in a RMS milieu used to identify whether to introduce and produce a new product into an already existing assembly line or to invest in a
new assembly line
To be able to fulfil the purpose, four research questions have been developed. The first research question is necessary in order to explore the theory regarding existing line balancing techniques:
1) Which line balancing problem-solving techniques exist in the literature?
In order to add the investment perspective when deciding whether to introduce a new product in an already existing assembly line or invest in a new assembly line, the second research question was developed. This was formulated as follows:
2) Which investment costs can be considered vital for new assembly lines as a consequence from new product introductions?
The third research question investigates the possibility of developing a decision-making tool which takes both the line balancing perspective and investment perspective into consideration. This was achieved by combining the theoretical knowledge gained from the previous research questions with data collected in the case study. Hence, the following research question was formulated:
3) Can a decision-making tool be designed to evaluate new product introductions which considers both line balancing KPIs and investment costs in an assembly line?
Lastly, as a means to evaluate the model and its connection to RMS characteristics, and thereby being able to discuss the primary academic contributions from this thesis, a fourth research question was developed:
4) To what extent can criteria in the RMS theory be linked with the attributes of the designed decision-making tool to support its applicability?
Introduction
1.4 Delimitations
This thesis will solely focus on developing and analysing a decision-making tool from an RMS perspective. Hence, other major production systems, i.e. DMS and FMS, will not be in focus. Also, this thesis is only covers the development of a decision-making tool for straight line layout assembly lines. Other types of assembly lines, such as U-lines are thereby excluded. This delimitation was necessary since line balancing techniques and algorithms adapted for U-lines are not identical to the ones for straight assembly lines. Furthermore, the validation and testing of the decision-making tool (DMT) is based upon data provided from the case company. Thus, the authors will not collect any time measurements by themselves and solely rely on the basis that these are correct. Also, the decision-making tool will not be tested in a wider setting, with input from other companies. Further delimitations regard that the report only covers KPIs connected to line balancing and investment costs on an overarching level. This delimitation exists since the decision-making tool is intended as being modular, whereas users have the possibility to insert the most relevant KPIs and investment costs in their situation.
1.5 Thesis outline
The thesis consists of seven chapters, see Figure 1 below. The first chapter has served as an introduction of the topic and clarified the existing knowledge gap, presenting the thesis aim and research questions.
The second chapter covers the theoretical framework, beginning with describing the outlines of RMS, assembly line types and line balancing classifications. Thereafter, a generic procedure for developing a spreadsheet decision-making tool is touched upon. Lastly, the economic perspective in the form of key performance indicators, production investment costs and Monte Carlo simulation is presented.
The third chapter explains the methodological angle. Beginning in a wider setting and clarifying the research design. Thereafter the data collection methods used are presented. These includes literature studies, case study, interviews, document analysis and focus group. Furthermore, the procedure for testing and validating the DMT as well as how trustworthiness is taken into consideration, is clarified. Lastly, an explanation of how the ethical and moral perspective is taken into consideration in the thesis is presented.
The fourth chapter is presenting the theoretical findings for RQ1, RQ2 and RQ4. Whereas the former two are creating the foundation for developing the decision-making tool, and the latter necessary for understanding the correlation between RMS and the decision-making tool. The fifth chapter in presenting the decision-making tool, i.e. the result from RQ3. This is initiated with a description of the decision-making tools outline, framework, applicability, and assumptions. Thereafter, a detailed declaration of the decision-making tool’s structure, computations and calculations are described. The chapter ends with a description of the feedback on the decision-making tool gained during the focus group.
The sixth chapter is commencing with an analysis and discussion of the four research questions. This is followed by a discussion of the applied method.
Introduction
Theoretical Framework
2
Theoretical framework
The second chapter covers the thesis theoretical framework, beginning with describing RMS and associated classifications and characteristics. Thereafter, the line balancing and investment costs theory is presented.
2.1 Reconfigurable manufacturing systems
The complexity of modern industrial processes motivates the need to adapt a holistic perspective when designing or operating production systems. The main concern is that many researchers have underlined the interrelated relationship between the components and levels of the system (Bellgran & Säfsten, 2009). For instance, Groover (2016) highlighted that the production system consists of two core levels. One of these regard facilities, which include factories, machinery, material handling tools and so on. The other level regards the manufacturing support system, focusing on the soft part of the system. This includes standards, procedures, product design, and working schedules, etc. Manufacturing systems can further be categorized based on the systems’ flexibility to handle changes in demand. According to Koren et al. (1999), manufacturing systems can be divided into three categories; DMS, FMS and RMS. DMS are prepared with a set of machining and other material handling equipment which facilitates delivery of a product with specific features. Such a system targets to produce in mass capacity with very low variation in products or manufacturing process. The simplicity of the system requires workers with a minimum degree of skill. As a result of this, dedicated manufacturing systems are typically cost-effective when high demand with low product variety is expected (Bellgran & Säfsten, 2009). On the other hand, FMS are equipped with machinery which are able to handle products with a wide difference in features. This ability facilitates the possibility to produce complex products, which is not easily accomplished in DMS. The FMS usually contains CNC machines and a high level of automation. However, several drawbacks related to FMS have appeared. These drawbacks primarily regard long setup time to change between products and an extensive time-consuming maintenance (Koren et al., 2018). Nevertheless, improvements have been introduced to both DMS and FMS in order to avoid the lack of flexibility of the DMS and to increase the production capacity of FMS. These improvements created a space of solutions that are defined as RMS, as illustrated in Figure 2 (Koren, 2006; Wiendahl et al., 2007).
Theoretical Framework
RMS has further been presented as the hybrid system between DMS and FMS. This since RMS brings together the benefits of having cost-effectiveness as a result of mass production and responsiveness to change in features of the products within a product family (Koren & Shpitalni, 2010).
2.1.1 RMS classification
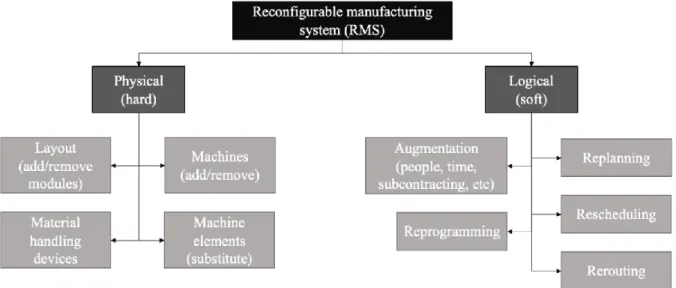
The competitiveness among industrial companies puts pressure on manufacturers to stay viable and respond to customer demands. This in turn creates the necessity to frequently introduce new products in existing production systems (Bellgran & Säfsten, 2009). Many researchers have associated the development or change of the production system to match product introductions, particularly RMS. For instance, Säfsten & Aresu (2000) conducted a survey on 15 companies. In the research, Säfsten & Aresu (2000) linked introducing new products to the changes in assembly lines that give the companies the advantage of launching new products before their competitors. Also, Surbier (2014) emphasized on the relation between production ramp-up for new products and disturbances in product quality and assembly line performance. Both studies can connect to the works of ElMaraghy (2006) and Koren & Shpitalni (2010) on reconfigurability enablers. ElMaraghy (2006) identified two types of flexibility: physical and logical. The physical aspect includes production layout, machines, and material handling equipment, while the logical aspect includes for instance, production planning, human resources, and rerouting (Figure 3).
Figure 3 - RMS soft and hard classification, based on ElMaraghy (2006).
Considering the abovementioned classifications, RMS can be supported through both physical and logical aspects. For example, scaling up the production capacity can be achieved by adding more machines to an existing production system. However, changing production planning or product mix can lead to an increase in the volume without changing the physical structure of the production system (ElMaraghy, 2006; Lohse et al., 2006; Mehrabi et al., 2000). Furthermore, Wiendahl et al. (2007) argue that soft reconfigurability can be valuable to increase cost efficiency and respond to the demand without investing in the new line features.
2.1.2 RMS characteristics
Researchers have identified seven characteristics that enable the manufacturing system to achieve reconfigurability, these are presented in Table 1 below based on (Koren et al., 1999; Koren & Shpitalni, 2010; Maler-Speredelozzi et al., 2003; Naor et al., 2010; Rösiö et al., 2019; Wiendahl et al., 2007; Youssef & Elmaraghy, 2006). However, it is important to note that
Theoretical Framework
researchers have identified RMS characteristics using different terms. For example, Wiendahl et al. (2007) found mobility to be one of RMS characteristics , while Napoleone et al. (2018) and Rösiö et al. (2019) did not acknowledge the term mobility but instead covered mobility within other characteristics, namely as modularity and integrability.
Table 1 - RMS characteristics
Characteristic Definition
Scalability Scalability of the system's production rate is required to respond to changes in demand in a timely manner. Scalability encompasses both system scalability and capacity scalability. The former, i.e., system scalability, refers to meeting market demand with the least amount of system capacity growth. Capability flexibility, on the other hand, has two components. One of these components is the physical flexibility of attaching and disconnecting machines and material handling equipment to the production system. The other component is logical flexibility and refers to the ability to extend production time and increasing working shifts or manpower.
Customization The ability of a production system to respond to differences within the same product family is referred to as customization. It is possible to use the same software to create different features within the same product family using a customized configuration. To allow system customization, there is also a need for software to track running mixed products within the same line.
Convertibility Convertibility refers to a manufacturing system's ability to convert between various configurations in order to meet fluctuating demand. When switching between product variants and future models, a convertible development system requires the least amount of setup time.
Modularity Production system modularity refers to the standardization of system components and functions. Modularity allows for the replacement, removal, and addition of modules without disrupting other components of the system. Modularity enables the construction of complex systems that can react to changes in product features or fluctuating demand.
Integrability Production system integrability, also known as compatibility, refers to the compatibility of various applications, materials, and interfaces within the various components of a production system. Integrability is critical for ensuring coordination between all production system components at various stages of production. When a new component is added to an existing system, it is critical to connect it logically and physically to the current control system and production infrastructures. On a physical basis, integrability enables newly connected components to send and receive goods and materials with ease. Physical integrability involves exchanging data and control signals with other elements of the production system, while logical integrability entails exchanging data and control signals with other parts of the production process.
Diagnosability Diagnosability enables the manufacturing system to diagnose performance disturbances rapidly and accurately within the production system. The system must quickly diagnose equipment and material handling errors and assess their effect on the rest of the system. Furthermore, diagnosability in manufacturing systems entails tracing product quality issues and investigating root causes.
Mobility The freedom to transfer production system elements is referred to as mobility in the RMS. This covers machines, facilities, and infrastructure. Mobility contributes to the system's flexibility; unrestricted equipment can be quickly transported within the factory to expand production capacity wherever there is a lack of production resources.
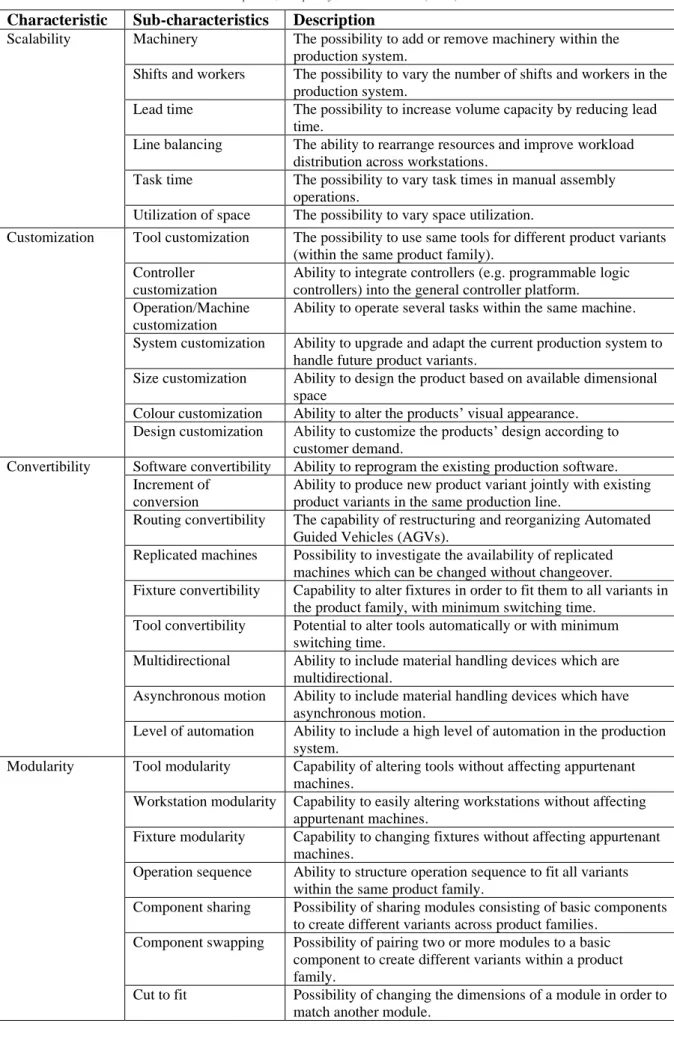
In an attempt to break down reconfigurability characteristics on a more detailed level, Rösiö et al. (2019) presented a total of 37 assessment criteria connected to the seven characteristics of RMS (see Table 2 below).
Theoretical Framework
Table 2 - RMS sub-characteristics and descriptions, adapted from Rösiö et al. (2019).
Characteristic Sub-characteristics Description
Scalability Machinery The possibility to add or remove machinery within the production system.
Shifts and workers The possibility to vary the number of shifts and workers in the production system.
Lead time The possibility to increase volume capacity by reducing lead time.
Line balancing The ability to rearrange resources and improve workload distribution across workstations.
Task time The possibility to vary task times in manual assembly operations.
Utilization of space The possibility to vary space utilization.
Customization Tool customization The possibility to use same tools for different product variants (within the same product family).
Controller customization
Ability to integrate controllers (e.g. programmable logic controllers) into the general controller platform. Operation/Machine
customization
Ability to operate several tasks within the same machine. System customization Ability to upgrade and adapt the current production system to
handle future product variants.
Size customization Ability to design the product based on available dimensional space
Colour customization Ability to alter the products’ visual appearance. Design customization Ability to customize the products’ design according to
customer demand.
Convertibility Software convertibility Ability to reprogram the existing production software. Increment of
conversion
Ability to produce new product variant jointly with existing product variants in the same production line.
Routing convertibility The capability of restructuring and reorganizing Automated Guided Vehicles (AGVs).
Replicated machines Possibility to investigate the availability of replicated machines which can be changed without changeover.
Fixture convertibility Capability to alter fixtures in order to fit them to all variants in the product family, with minimum switching time.
Tool convertibility Potential to alter tools automatically or with minimum switching time.
Multidirectional Ability to include material handling devices which are multidirectional.
Asynchronous motion Ability to include material handling devices which have asynchronous motion.
Level of automation Ability to include a high level of automation in the production system.
Modularity Tool modularity Capability of altering tools without affecting appurtenant machines.
Workstation modularity Capability to easily altering workstations without affecting appurtenant machines.
Fixture modularity Capability to changing fixtures without affecting appurtenant machines.
Operation sequence Ability to structure operation sequence to fit all variants within the same product family.
Component sharing Possibility of sharing modules consisting of basic components to create different variants across product families.
Component swapping Possibility of pairing two or more modules to a basic component to create different variants within a product family.
Cut to fit Possibility of changing the dimensions of a module in order to match another module.
Theoretical Framework
Bus modularity Possibility to match disparate modules to a basic component. Integrability Tool integrability Capability to integrate new tools in existing machines in the
production system.
Control software Capability to integrate already existing control software into new tools and machines.
Information handling integrability
Capability to integrate information with new work tasks in the production system.
Diagnosability Poka yoke The capability to detect the usage of correct tool and components for the product family variants.
Information board The ability to display the upcoming operation on the focal machine or assembly line.
Traceability The ability to trace the product’s current production stage/operation.
Quality assurance The ability to immediately detect unsatisfactory product quality through visual technology (e.g. cameras and sensors).
2.1.3 RMS characteristics and improvement levels
As a way of explaining the relationship between RMS characteristics and the system’s lifecycle, Napoleone et al. (2018) present a framework approach, as illustrated in Figure 4 below. According to Napoleone et al. (2018) there is a logical relationship connecting the RMS characteristics. For instance, the characteristics modularity and integrability are required on a lower level than their dependent characteristics, i.e. diagnosability, scalability, convertibility and customization. The latter is, compared to the other characteristic, a strategic perspective. It has the capability to create a possibility to either proactively or reactively implement reconfigurability. Due to this ability, customization is recognized as having a final connection to all other RMS characteristics (Napoleone et al., 2018).
Napoleone et al. (2018) are also arguing that RMS characteristics can be further divided into three classes, which is based on their correlation in the system lifecycle. The classes regard configuration, reconfiguration, and change-driver/change-driven characteristics. Whereas for instance, the characteristics scalability and convertibility are associated with the reconfiguration characteristics. This since they are essential for achieving capacity or functionality changes in the production system (Napoleone et al., 2018). Hence scalability and convertibility are recognized as being a part of the period typified when making decisions regarding system changes, in other words, the reconfiguration period (Napoleone et al., 2018; Rösiö, 2012).
Theoretical Framework
Napoleone et al. (2018) also describe that the lowest level to find the RMS characteristics modularity, integrability and diagnosability is on an assembly station level. Due to the position of these characteristics being at a workstation level (e.g. assembly station), i.e. the most concrete level, the characteristics convertibility and scalability are at the possible to achieve on a system level (e.g. cells, production lines or assembly systems). This enables a possibility to achieve customization on both system and factory levels (Napoleone et al., 2018).
2.2 Single-, mixed- & multi-model assembly lines
Assembly lines were famously introduced by Henry Ford in the beginning of the twentieth century. Assembly lines are setups for manufacturing processes where value is added to products, for instance in terms of operations performed or subparts added. Traditionally, workstations where these operations occur are logically placed in a predetermined sequence and placed in proximity to each other. However, conveyor belts or similar transportation systems are also solutions frequently used when necessary. At the workstations, humans or machines are to perform a predetermined set of operations which they complete before the product is transported to the subsequent workstation (Fortuny-Santos et al., 2020). Since assembly lines can be comprised of machines, tools and human labour, while being quite extensive, they are associated with a high level of investment costs (Alghazi & Kurz, 2018; Fortuny-Santos et al., 2020). This puts an emphasis for companies on establishing a proper configuration of assembly lines (Alghazi & Kurz, 2018).
Originally, assembly lines were implemented as a means for companies to accomplish mass production of identic products while staying cost-efficient (Alghazi & Kurz, 2018; Fortuny-Santos et al., 2020). However, in line with organisational and technological development, assembly lines have developed and nowadays several products can be assembled in the same assembly line (Fortuny-Santos et al., 2020). The configurations of product and assembly lines can be divided into three main categories; single-model assembly lines, mixed-model assembly lines and single-model assembly lines (see Figure 5 below) (Güden & Meral, 2016; Olhager, 2013; Şeker et al., 2013).
Single-model assembly lines are the least complex assembly line. These are commonly implemented in mass production facilities. Primarily since they traditionally enable the possibility of having operators with little training to manually assemble complex and detailed products (Cevikcan et al., 2009).
Figure 5 - Different assembly lines types, adapted from Olhager (2013).
Mixed-model assembly lines (MMALs), on the other hand, are used to manufacture several products within the same product family (Akpinar et al., 2017; Olhager, 2013). These are simultaneously assembled on the same line (Mirzapour Al-E-Hashem et al., 2009). In MMALs, each specific product variant has its own task precedence rules, which are combined into a
Theoretical Framework
precedence diagram of the entire product family (Akpinar et al., 2017). MMALs are frequently used in car-manufacturing facilities as these tend only to produce a limited fixed set of product families. Normally, these do not require any machine- or tool setup between different product variants. However, there is a higher level of complexity in material- and component handling in MMALs as they need to serve the needs of several models simultaneously (Olhager, 2013). The third category of assembly lines is multi-model assembly lines. If the products assembled in the production line are of comprehensive difference, setup time might be required between producing the products in sequence. Thus, the key question when producing in multi-model assembly lines regards whether the products have a sufficient similarity level in terms of components and production resources in order to be economically beneficial (Olhager, 2013).
2.3 Line balancing problems
Assembly lines were initially intended to produce a limited variety of products in large quantities. A setup like this allows low production costs, short cycle times, and high quality. However, due to the high capital cost needed to build and operate an assembly line, manufacturers produce one product with various features or several products within the same product family on a single assembly line simultaneously (Bellgran & Säfsten, 2009). Producing or assembling of a product often requires several operations. Seldom are these operations unidentical and require various time for completion, a workload varies among employees and stations due to the different operating times. As a result, the aim is to delegate the same workload to all employees or computers. To provide a smooth work distribution within assembly lines, two aspects need to be considered: 1) The total number of workstations must be kept to the minimum, 2) The logical precedence constraints that must be followed. The latter aspect is required since some of the processes cannot be performed before their predecessors (Groover, 2016; Watanabe et al., 1995). Furthermore, there is a set of assumptions that need to be considered in solving assembly line balancing problems (ALBP), the assumptions decide the input data, techniques, and the final solutions for the problem. Although the final goal for all ALBP is to reach a feasible work distribution, the method is different based on the line characteristics, such as the number of products per line, the pre-determined number of workstations, or task time (Battaïa & Dolgui, 2013).
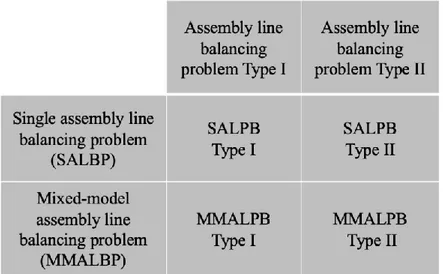
When deciding which strategy to use to solve ALBP, some assumptions about the assembly line must be considered. As an example, assumptions on the number of models to be manufactured are referred to as single assembly line balancing problems (SALBP) in the case of a single model product, while mixed-model assembly line balancing problems (MMALBP) are problems with two or more products produced on the same line (Mirzapour Al-E-Hashem et al., 2009).
Another assumption to note is the objective of the balancing, whether it is to minimize the number of stations or to increase throughput by reducing the cycle times of the assembly activities. Thus, ALBP type I aims to reduce the number of stations or staff needed to meet the output demand where the process time is set. ALBP Type II, on the other hand, aims for the maximum output rate and the shortest cycle time while maintaining a constant number of workstations. Regardless of the distinction between the two, both assume that the operating time allotted to stations does not exceed the cycle time of the assembly line (Becker & Scholl,
Theoretical Framework
assembly line balancing is by definition strategic. When confronted with such a challenge, planners often strive for a decision that will have a long-term productive effect (Xu & Xiao, 2009).
Figure 6 - Assembly line balancing problems’ assumptions and constraints
2.4 Decision-making tools in line balancing
Today’s decision-makers need to frequently make important decisions in a highly competitive environment. The need to evaluate various alternatives has become even more complicated in recent decades, leading to an increased use of digital spreadsheets as a support tool for making more accurate decisions. This primarily since they are a workable solution for many users, especially in management and operations research applications (Caine & Robson, 1993; O’Donnell, 2001). The process structure described by Ragsdale (2008) for decision-making can briefly be described in three steps. The first step involves identifying decision variables representing the quantities that the user can control and changing the model’s outputs. The second step covers identifying model constraints that include the acceptable values for decision variables. The final step involves identifying the desired model objectives. For instance, objectives can include a predetermined maximum or minimum value, or a decision which guarantees a result within a certain range. Several researchers have described different ways to create decision-making models in Microsoft Excel (Caine & Robson, 1993; Coles & Rowley, 1996; Nogoud et al., 2017; Ragsdale, 2008). Even though these models might be differently structured, they all followed similar steps with only minor differences. These steps have been identified as:
1) Understand the problem variables in order to organize the data for the model in the spreadsheets. The relation between data and dependences decides both the data entry and output requirements.
2) Replace the spreadsheet’s cells to corresponding decision variables and use labels to explain the meaning of every set of data.
3) Establish the formulas that link the cells in order to achieve the objective of coping with model constraints.
4) Validate the model’s ability, accuracy, and usability. Validation of the model using unexpected data such as negative numbers or unexpected data can examine the model's robustness. Also, by using simple data with known results, it is possible to test if the model delivers expected outputs.
5) Document the model procedure and provide clear guidelines for the user. These should include, but be limited to, labeling the data and equations used, drawing a spreadsheet
Theoretical Framework
map, and clarifying the formulas.
6) Implement the model and receive early feedback from the users to optimize the model in order to reach the desirable results.
2.5 Line balancing models and computation
Microsoft Excel spreadsheets have been the most widely used tools in recent decades when it comes to operation analysis and solving project management network problems (Caine & Robson, 1993). Ragsdale and Brown (2004) created one of the first models which use Microsoft Excel spreadsheets to explain and solve predecessor relations between tasks. About a decade later, both Weiss (2013) and Wellington & Lewis (2018) extended the previous work in a new area of application through the use of a heuristic approach to solve line balancing problems for a single model product. Their work shares the same basic structure, which can be divided into two major steps. The first step regards identifying the assembly line parameters in the form of a table. This table includes inserting the values of task names, task times (operations time), required cycle time (operations time) and immediate predecessors between tasks (Weiss, 2013; Wellington & Lewis, 2018).
The second step is to identify the workstations’ feasibility based on two requirements. Firstly, all previous operations have been assigned to the available stations. Secondly, the sum of task times is less than or equal to the theoretical maximum time required to produce one product through the assembly line. Following that, the task is allocated in accordance with the existing priority rule. For every iteration, a single task is considered at a time. The computation of the process is achieved through combinations of built-in functions in Microsoft Excel. The coding system is structured in such a way that it automatically allocates tasks to stations by assigning 0 for tasks which have not been assigned yet, and -1 to tasks which have been assigned to previous stations. This allows the spreadsheet to identify the first task to start with it and to stop the computation when no more task is available. The spreadsheet checks if the activity code is 0 and then checks if the available time in the station is less than the operating time using the built-in Microsoft Excel IF functions. In the case when all conditions are met, the sheet subtracts the task (operation) time from the station time and keeps the remaining time to be set as the current overall available time. Thereafter the sheet changes the code of the task to be -1 or less. Once this has been accomplished, a new iteration starts by checking if the next task code is equal to 0. (Weiss, 2013; Wellington & Lewis, 2018). Some common Microsoft Excel formulas frequently used by Caine & Robson (1993), Ragsdale & Brown (2004) and Wellington & Lewis (2018) are:
- IF: check the logical conditions for a priority rule and station availability through the mathematical denotations “<” “>” “=”.
- SUM: at each iteration, the SUM-function is used to count the number of tasks that fulfil the requirement and thereafter returns the task code for the new iteration.
- SEARCH: maintain the task code with a combination of IF conditional functions. - VLOOKUP: searches for a certain task name and time with the task code in the inputs. - OFFSET: used for dynamic functions where there is a need to return a value based on a
reference cell. The OFFSET-function is used in order for tasks to be assigned based on the line balancing priority rules.
Theoretical Framework
2.6 Key performance indicators in line balancing
A key performance indicator (KPI) is defined as a comparable value or number which is used to gain insight into a certain performance. The KPI can be compared to either a selected internal target or an external target. The number or value in the KPI consists of either collected or calculated data (Ahmad & Dhafr, 2002). In regard to assembly lines, there are two main types of KPIs. These differ based upon time perspective. The KPIs which are reporting an assembly line’s current status and performance is referred to as online KPIs. Operators and managers frequently use these to ease decision-making regarding assembly line improvements or problems in need of instantaneous alteration. On the other side of the time perspective, offline KPIs are indicators of an assembly line’s performance calculated or collected based on historical data. Hence offline KPIs are more frequently used by managers when the aim is to proactively identify problems in the assembly lines and thereby enable the possibility of constructing action plans to avoid the identified problems in the future (Mohammed & Bilal, 2019).
Hitherto, many authors have tried to solve the issues in line balancing. Both regarding the simple assembly line balancing problems or more complicated assembly line which produces multiple products within the same line, for instance McMullen & Tarasewich (2003), Su et al. (2014) and Samouei (2019). With this, new algorithms and techniques have been developed. Consequently, the usage of KPIs has also been developed. When Salveson (1955) first introduced line balancing, the KPIs used were cycle time, throughput time, idle time, machine utilization and balancing loss. Nowadays the KPIs tend to be more advanced, for instance taking shape in the form of flexibility of staff, process planning, market requirements (März, 2012) and planned order execution time (Ferrer et al., 2018).
2.7 Assembly line investment costs
Investments, for instance regarding production and assembly line, is a critical factor of a company's long-term economic performance. Once a decision has been made, it is seldom possible to reverse the actions taken (Nickell, 1978). However, many organisations, both within the public and private sectors, still base their investment on the initial purchase costs, without any consideration of the assets’ life span and discount rate. In order to cope with these factors, and thus facilitate a more realistic financial outcome, investment calculation methods such as Life Cycle Cost (LCC) techniques and calculations have been developed (Woodward, 1997). LCC techniques are particularly widespread as they optimize the total cost of ownership by taking a wide range of technical data into consideration (Tosatti, 2006; Woodward, 1997) Similar to the principle of LCC calculations, the Net Present Value (NPV) method is also taking the discounting cash flows over a certain time-line into consideration in the investment decision. Although, in contrast, NPV is typically used in business planning and for making strategic decisions. In contrast, LCC techniques on the other hand are intended for enabling a comparison of the anticipated economic lifecycle performance of investment alternatives, for instance regarding production systems (Tosatti, 2006; Woodward, 1997).
2.8 Monte Carlo simulations
The Monte Carlo simulation method’s origin dates back to the 1940s (Platon & Constantinescu, 2014). However, it was not until 40 years later when Monte Carlo simulations started receiving concentrated attention from academia (Kelliher & Mahoney, 2000). Since then, they have been used by professionals in a wide arrange of settings, for instance, in finance, project management and production (Khalfi & Ourbih-Tari, 2020; Wang, 2012). The Monte Carlo method is a computerized simulation technique which allows the user to analyze the entire range of possible
Theoretical Framework
outcomes and the impact of existing risks and uncertainties. Hence, the user is able to identify key insights regarding the relationship between inputs and outcomes and thus enable better decision making when uncertainty is present (Kelliher & Mahoney, 2000; Khalfi & Ourbih-Tari, 2020; Saipe, 1977). Monte Carlo simulations are primarily useful since they are easy to perform, but also due to their ability to provide the user with the possibility of running thousands of iterations very quickly. (Kelliher & Mahoney, 2000; Platon & Constantinescu, 2014).
As aforementioned, Monte Carlo simulations are useful in many situations, none the least in investment calculations. This since the key difference between Monte Carlo simulations and other modeling techniques is their ability to not require certainty or normality in the inputs (Kelliher & Mahoney, 2000), which is a frequent issue in investment decision making (Platon & Constantinescu, 2014). In investments, Monte Carlo simulations can be used to calculate possible outcomes when uncertainty in input values has a great impact on the final results (Kelliher & Mahoney, 2000). According to Platon and Constantinescua (2014), one of the most interesting research on Monte Carlo simulations was conducted by Dienemann in 1966 and regarded cost estimating the uncertainty of investment projects. In more recent days, Monte Carlo simulation to calculate investment decisions with an intrinsic uncertainty has been, for instance, tested by Hacura et al. (2001). In their research, they used investment expenditures connected to purchasing a new production facility, including building costs, technical equipment, assembly work, and current assets (Hacura et al., 2001). Which showed how the performance is influenced by the variation of certain cost and demand scenarios (Renna, 2017). Furthermore, the number of iterations required to run Monte Carlo simulations is significant in order to get viable results. Hauck & Anderson (1984) argued that the majority of studies on Monte Carlo simulations have chosen to run between 500 and 1000 iterations. This argumentation corresponds to, for instance, Caralis et al. (2014), who run several Monte Carlo simulations in their research, whereas the most extensive consisted of 1000 iterations.
Methodology
3
Methodology
The third chapter covers the methodology, beginning with explaining the research design. Afterward follows a description regarding the usage of literature studies, case study, interviews, document analysis and focus group in the thesis. Thereafter, the model validation procedure is presented. Lastly, the trustworthiness, ethical- and moral perspective is declared for.
3.1 Research design
The thesis purpose was to “Develop a decision-making tool which fit in a RMS milieu used to identify whether to introduce and produce a new product into an already existing assembly line or to invest in a new assembly line”. Given the purpose, the nature of the thesis is equivalent to exploring and explaining. These attributes correspond to a qualitative research approach (Leedy et al., 2019). The qualitative approach is namely characterized as having flexible guidelines which were necessary since the outcomes were not predetermined, but instead explorative. Also, the data necessary to answer the research questions was collected in a small sample and through, for instance, non-standardized interviews and document studies, which corresponds well to the natural characteristics of a qualitative approach (Leedy et al., 2019).
In order to fulfil the purpose, four research questions was created. RQ1 and RQ2 were necessary to answer in order to create the theoretical foundation for creating the decision-making tool. Whilst in RQ3 the theoretical knowledge was combined with empirical data and thus enabled the possibility to secure the applicability of the decision-making tool in an industry setting. In order to validate the decision-making tool from an RMS perspective, and thereby illustrate how the decision-making tool is supporting RMS, RQ4 was created. The connections between research questions and methods used are depicted in Figure 7.
Methodology
3.2 Literature studies
Since this thesis is covering a topic which thus far has been overlooked by academia, the need to create a theoretical foundation for the DMT to stand upon is crucial. Therefore, several extensive literature studies have been conducted. The literature studies have been structured to focus on certain topics, these regarded RMS, line balancing, and assembly line investment costs. By doing this, sufficient knowledge regarding the topics to create and evaluate the DMT was gained. The literature studies took place in the shape of systematic reviews. This due to the fact that a systematic review is appropriate to use when the goal is to draw a conclusion regarding what is both known and unknown within a particular topic (Denyer & Tranfield, 2009; Saunders et al., 2016). This is corresponding well to the limited research previously conducted on RMS and line balancing, as seen in Table 3 below. Besides, the systematic literature review also has an increased internal validity due to its ability to minimize potential biases such as selection bias and publication bias. The former regards researchers tend to choose articles which correlate with his or her existing belief (Booth et al., 2016). The latter occurs when, for instance, reviewers or editors act indifferently dependent on the direction or strength of the focal article's findings (Booth et al., 2016; Gilbody & Song, 2000).
The literature studies were carried out through a five-step process, inspired by Booth et al. (2016). The process is depicted in Figure 8 below. All searches were carried out in the abstract and citation database Scopus. The initial searches were based on carefully selected combinations of keywords. In order to exclude non-relevant papers, search filters were used. The filters primarily involved limiting the searches to papers written in English and excluding non-relevant fields such as environmental science, physics, and chemical engineering. The filters also included limiting the searches to document types such as articles, books, and conference papers. Once the filters were applied, the process was initiated with the first reading round, where the abstract was read, and the papers reckoned relevant were selected. The second reading round incorporated quickly reading the papers, and thereafter selecting the most relevant papers to the third and final selection round. This round included reading the articles once more in detail, while taking notes, excerpting quotes, and highlighting relevant findings.
Methodology
In total, three literature studies were conducted. One of the literature studies covered the hitherto conducted research on RMS and line balancing. This literature study was performed with the aim of gaining full insight into the current research on RMS and line balancing. In particular how other researchers have adapted line balancing tools to fit RMS. However, as seen in Table 3below, the hits of searching for RMS and Line balancing were very few, proving the limited research within the areas. This literature study also covered searching for typical characteristics related to RMS, as a way of enabling the possibility to test the correlation between RMS and the developed decision-making tool.
A literature study covering line balancing was also conducted. This was performed to create a theoretical foundation for the thesis, as well as finding possible line balancing techniques and algorithms necessary to create the decision-making tool. Even though there might be a clear knowledge gap about the application of line balancing in RMS, as aforementioned, the need to identify which line balancing techniques that can be used in RMS was necessary. A numerous amount of algorithms and techniques were identified, however, the majority of these were either too complicated to apply in a wider industry setting, or too mathematically complex to transfer into a Microsoft Excel file.
Lastly, a literature study focusing on assembly line investment costs was conducted. By identifying investment costs frequently used when estimating costs for new product introductions, the authors were able to design the decision-making tool with the possibility of including these in mind. As seen in Table 3, the initial search for assembly line investment costs only resulted in a single hit, which forced broader searches within the field.
Table 3 - Applied keywords and search results in the literature studies
Theoretical topic Keywords Hits Incl.
filters
RMS "Reconfigurable manufacturing system*" AND ("Characteristic*" OR "Criteria*" OR "Driver*" OR "Enabler*")
215 177
"Reconfigurable manufacturing system" OR "RMS" AND "Line balancing"
10 9
"Reconfigurable manufacturing system*" OR "RMS" AND "Mixed-model assembly line*"
4 4
Line balancing "Mixed model assembly line balancing" 140 118 "Mixed-model assembly lines" AND "Line balancing" 241 192
"Multi-model assembly line*" 32 29
"Line balancing" AND Algorithm* 1229 234 "Line balancing" AND Technique* 373 117 "Line balancing" AND "Decision making tool" 2 2
Assembly line investment costs
"Assembly line*" AND Investment* AND ("New product introduction*" OR NPI)
1 1
"Assembly line*" AND Investment* 214 156 Investment* AND Costs* AND Calculation* AND
(Production OR Manufacturing)
Methodology
3.3 Case study
The aim of this research was to develop a decision-making tool which provides companies with the possibility to scientifically calculate whether it is economically beneficial to produce the new product in an already existing assembly line, or to invest in a completely new assembly line. Hence, ensuring the industrial application of the tool is crucial for the research's relevance. In order to achieve this, a single case study was conducted. The case study method was chosen since it is an empirical method that is used when investigating an in-depth and realistic case (Yin, 2018), thus making it a suitable choice for developing, testing and validating the DMT. Also, by conducting the case study in parallel to designing the decision-making tool, the possibility of continuously validating the DMT’s industrial application existed.
Nevertheless, there are a few downsides with using case studies. For instance, case studies seldom have a distinct purpose. If studies have stated a clear purpose, then the problem instead frequently relates to authors not being able to describe how the purpose is addressed in the study (Corcoran et al., 2004). In order to deal with these issues, the purpose has been well-defined, and research questions have been formulated carefully to support the purpose. Another downside of case studies is that they require data from multiple sources. Therefore, the collected data needs to be congregated through triangulation (Yin, 2018). This has been accomplished by using three different data collecting methods in the case study: interviews, document analysis and focus group. Below follows a detailed explanation of how these methods have been utilized.
3.3.1 Interviews
In case studies, the interview method is one of the most significant information sources (Tellis, 1997; Williamson, 2002), hence it was used in this study. The interviews took place in the form of bi-weekly meetings with a production engineer at the case company. Since the focus of the interviews was to gain information about certain areas and topics, rather than about the respondent, the interview was a viable method (Alvesson, 2011). According to Patel & Davidson (2011), interviews can take place in different styles, primarily depending on their structure and level of standardization. The interviews in this research were conducted as discussions, whereas solely a few questions and the to be discussed topic was prepared beforehand. These discussions, characterized by a low level of standardization and structure, corresponds to unstructured interviews, as described by Patel & Davidson (2011). Performing unstructured interviews was chosen as they are typically used when aiming to gain a deeper understanding of a topic which a certain person possesses (Patel & Davidson, 2011). The information retrieved from the interviews was in turn used to develop the decision-making tool.
3.3.2 Document studies
Document studies were carried out through the process of extracting data and information from existing documents, and thus enabling the possibility to design, test and validate the decision-making tool from an industry point of view. Document studies were chosen since they are an adequate complement to other methods, for instance, literature studies and interviews (Skärvad & Lindahl, 2016). In total, two document studies were performed, and a total of 6 documents were reviewed. For both studies, the documents were sent via e-mail by a production engineer at the case company (see Table 4). The authors were thus able to study the documents in their own pace, potentially increasing the likelihood of properly understanding the data. This was crucial since it is significant to interpret internal documents carefully in document studies. The