Application of quantitative assessment of land use changes impact on water conservation for reservoir watershed, The
11
0
0
Full text
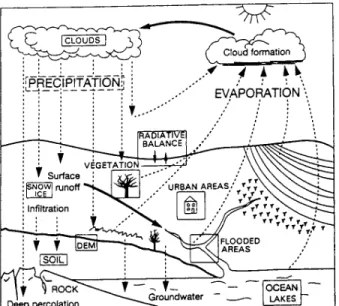
(2) Chou et al.. rush river flow, and inconsistent precipitation, the difficult in water storage and resources allocation reveals the importance of water conservation. In recent years, the remarkable industrial business and economics development in Taiwan have enhanced the urgent demand for water resources. The recent increased pressure on slope land development has changed the land use pattern in many reservoir watershed areas and affected the hydrologic cycle. Although there were many local researches examined this related issue, but none of that can fully describe the relationship between water conservation and land use patterns in watershed area. In this research, Geographic Information Systems (GIS) were adopted to build a digital database for reservoir area and to process hydrologic analysis. Remote Sensing (RS) and Global Positioning System (GPS) were performed to extract the surface vegetation details and land use changes information. The final goal of this study is through the assist of hydrologic model for water conservation capacity estimation; the outcome can provide an important reference for watershed management. This study is also built a GUI, integrate with GIS spatial analysis, database and models. It makes the hydro model easier to be used and solve the problem of data transmittal.. 2. Study Area The study area for model application is Dar-Pu reservoir watershed with 10,000 hectare in area, which locates at the upper stream of E-Mei River with discharges through the north western of Taiwan. The original construction purpose for this reservoir was to provide irrigation supply for neighborhood irrigation association at county level. Figure 1. The Study Area - DaPu Reservoir Watershed Location Map. 3. Methods and Results 3.1. Hydrologic Factors (Parameters) Analysis Most hydrological modeling for quantitative aspects of the water cycle (Figure 2.) is done using point information and aerial information as various input data and parameters. (PORTMANN, 1997). Hydrology Days 2003. 46.
(3) Assessment of Land Use Change Impact on Water Conservation. From previous research output, those factors affect water conservation capacity of reservoir watershed in Taiwan can be identified, which include the vegetation factors, topographic factor, soil factor, hydrometerological factor...etc. In this study, some general variables and data are used as shown in Table 1.. Figure 2. The hydrological cycle. (Based on WMO, 1994, altered by PORTMANN, 1997). Table1. Data requirements for water conversation capacity estimation Factor Vegetation Topography Soil Hydrometerology. Data requirements Land cover/use (forest type and density) Slope/aspect, elevation Soil moisture content, antecedent moisture content, soil profile Precipitation , water level and discharge volume at gauging stations. 3.2 GIS and RS Application 3.2.1 Environmental Database Establishment for Watershed Area. All parameters for hydrological model, include vegetation, topography, land cover/use, slope/aspect, elevation and gauge stations distributing map... etc., can be built into a physical Environment database by the assist of GIS and RS techniques (Teng et al,1995; Ho et al.,1995; Cheng et al, 1994; Nageshwr et al,1992; Mark et al,1992; Muzik,1996). This physical environmental database includes basic data such as geographical features, geological characteristics, Hydrology Days 2003. 47.
(4) Chou et al.. hydrological information, and land use/cover information. Among those data set, the geology, Digital Elevation Model (DEM) data, forest stands polygons and land use information were available in digital format. These data were transformed into Transverse Mercator two-degree projection, which is the coordination system currently used in Taiwan. 3.2.2 Land Use Changes. SPOT images were used to detect land use changes in this study due to their better spatial resolution. Three images from different seasons were chosen for this study, one was taken on December 8,1993, another was on April 17,1996, and the other was taken on November 19,1997. The land use classification process was focused in identifying vegetation and landslide area. First, unsupervised classification was used to group into a large categories. Then, candidate training sites for supervised classification were identified from aerial photos and topographic maps. Field observations were also performed to locate the ground truths and to select final training sites.Three SPOT satellite images were used to identify land use /cover changes in Dar-Pu watershed area. Through these temporal images, the land use changes output and land use distribution information can serve as the input parameters for the hydrological model of water conservation capacity estimation. Using satellite images to identify the land use patterns and land use changes for large area is efficiently in both time and cost. The results from image classification are shown in Table 2. 3.3 Hydrological Model Analsys 3.3.1 HSPF Model. This study use HSPF ( Hydrological Simulation Program - Fortran ), which developed by U.S. Environment Protection Agency and Hydrocomp Inc., to be the simulation model to estimate the water conservation amount. This model could be used to simulate the hydrology and water quality of watershed and is suitable for water resource management and planning. HSPF model is a Continuous Simulation computer program, input with rainfall, temperate, sunlight intensity, land use, soil property, and cultivation data. The result (output) of the model calculation is : sand, water volume change rate of ground surface, soil zone and ground water. It can forecast the runoff, sediment loads and pollutants amount. In conclusion, HSPF is a Continuous Simulation model that gathers hydrology, hydraulic, soil erosion, sediment loads, and water quality. Users would have detailed watershed data and through cautious certification,and then the simulation results will be accurate and reliable. The main function is to simulate total runoff from percolating area. This research focused on the simulation results from PERLND module for surface runoff and groundwater changes in reservoir watershed. The PWATER program structure is shown in figure 3.. Hydrology Days 2003. 48.
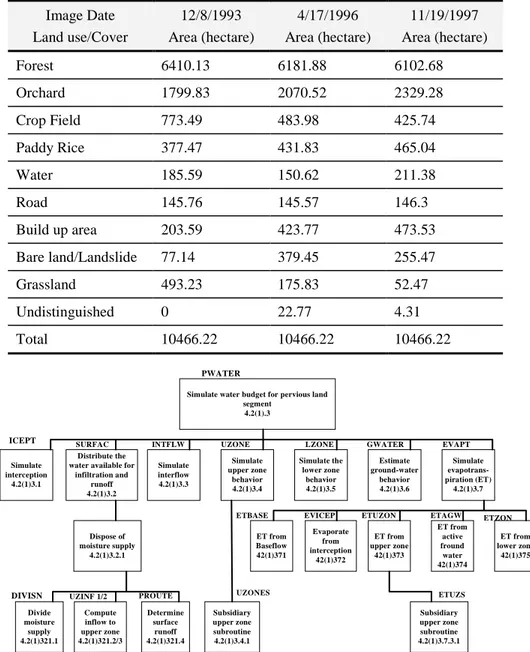
(5) Assessment of Land Use Change Impact on Water Conservation. Table 2. Land use/cover identification from satellite images classification Image Date Land use/Cover. 12/8/1993 Area (hectare). 4/17/1996 Area (hectare). 11/19/1997 Area (hectare). Forest. 6410.13. 6181.88. 6102.68. Orchard. 1799.83. 2070.52. 2329.28. Crop Field. 773.49. 483.98. 425.74. Paddy Rice. 377.47. 431.83. 465.04. Water. 185.59. 150.62. 211.38. Road. 145.76. 145.57. 146.3. Build up area. 203.59. 423.77. 473.53. Bare land/Landslide. 77.14. 379.45. 255.47. Grassland. 493.23. 175.83. 52.47. Undistinguished. 0. 22.77. 4.31. Total. 10466.22. 10466.22. 10466.22. PWATER Simulate water budget for pervious land segment 4.2(1).3. ICEPT Simulate interception 4.2(1)3.1. SURFAC Distribute the water available for infiltration and runoff 4.2(1)3.2. INTFLW Simulate interflow 4.2(1)3.3. UZONE. LZONE. Simulate upper zone behavior 4.2(1)3.4 ETBASE. Dispose of moisture supply 4.2(1)3.2.1. DIVISN Divide moisture supply 4.2(1)321.1. UZINF 1/2 Compute inflow to upper zone 4.2(1)321.2/3. ET from Baseflow 42(1)371. PROUTE Determine surface runoff 4.2(1)321.4. UZONES Subsidiary upper zone subroutine 4.2(1)3.4.1. Simulate the lower zone behavior 4.2(1)3.5 EVICEP Evaporate from interception 42(1)372. GWATER. EVAPT. Estimate ground-water behavior 4.2(1)3.6 ETUZON ET from upper zone 42(1)373. Simulate evapotranspiration (ET) 4.2(1)3.7 ETAGW ET from active fround water 42(1)374. ETZON ET from lower zone 42(1)375. ETUZS Subsidiary upper zone subroutine 4.2(1)3.7.3.1. Figure 3. Structure Diagram of PWATER subroutine from HSPF model. 3.3.2. Results from Hydrological model simulation. Hydrological simulation bases on the physical property of basin, the meteorological, hydrological, and geographical data to simulate hydrological reaction. HSPF simulates the surface ground runoff, interflow and active groundwater runoff, and then merge 3 runoff to get the total amount. The hydrological equation will be understudied when the model check: Outflow = Precipitation - Actual evaporation - Amount percolate to dead water zone - Soil moister change (1). Hydrology Days 2003. 49.
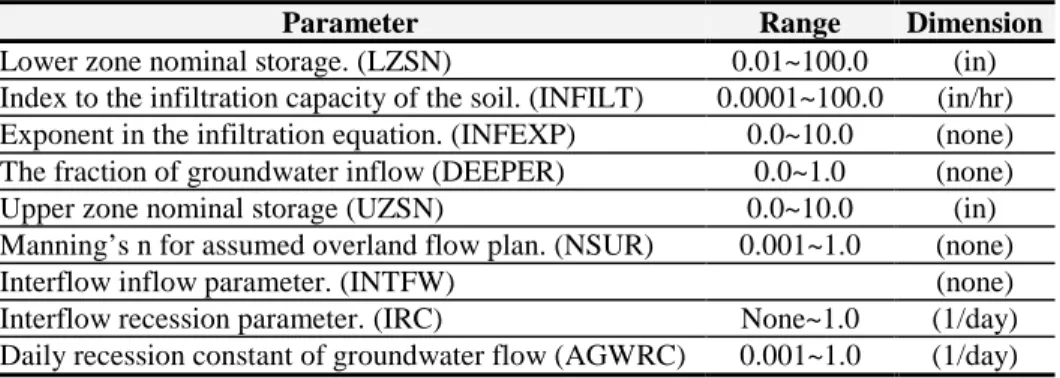
(6) Chou et al.. To verify this model, the observation and simulation value for the surface ground runoff, interflow and active groundwater runoff should be compared theoretically. Compare with observation discharge hydrograph and simulation discharge hydrograph because it is difficult to take 3 parts from observation value. The result showed nine main parameters, table 3 has direct effect on water conservation capacities in Dar-Pu reservoir watershed. Table 3. Highly related parameters from Pwater of HSPF model for Dar-Pu Reservoir watershed Parameter Lower zone nominal storage. (LZSN) Index to the infiltration capacity of the soil. (INFILT) Exponent in the infiltration equation. (INFEXP) The fraction of groundwater inflow (DEEPER) Upper zone nominal storage (UZSN) Manning’s n for assumed overland flow plan. (NSUR) Interflow inflow parameter. (INTFW) Interflow recession parameter. (IRC) Daily recession constant of groundwater flow (AGWRC). Range Dimension 0.01~100.0 (in) 0.0001~100.0 (in/hr) 0.0~10.0 (none) 0.0~1.0 (none) 0.0~10.0 (in) 0.001~1.0 (none) (none) None~1.0 (1/day) 0.001~1.0 (1/day). Select rainstorms in the hydrologic data that is fit the conditions to proceed HSPF simulation then use gene algorithm to get the parameters of the reservoir watershed area. Calculate the water conservation capacity and rate from the simulation results. The rainfall-runoff simulation results are showing in Figure 4. It showed the hydrological model can efficiently simulate the change trend of run-off volume from each observing data set.. 200 200 300. Simulated. 200. 50 100 75 0. 400 10. 20. 100 0. 50 40. 25 0. Run off(cms). 20. Rain fall(mm). Run off(cms). 80. Precipitation 0 Observed Simulated. 60 0. 10. 30. b.. Run-off simulation result for 8/16/1996. a. Run-off simulation result for 5/14/1996. 75. 20. Time(hr). Time(hr). 100. 10. 30. Precipitaion 0 Observed Simulated 10. 60 40. 20. 20. 30. 0. 20. Rain fall(mm). 0. 25. Rain fall(mm). 100. 400. 0. 0. Observed Run off(cms). Run off(cms). Precipitation. 300. 0. rainfall(mm). Precipitation Observed Simulated. 600. 0. Time(hr). c. Run-off simulation result for 6/24/1997. 10. 20. 30. Time(hr) d. Run-off simulation result for 1/14/1998. Figure 4. Runoff Simulation for four storm events. 3.4 Run off Estimation by Land Use Changes In HSPF rainfall-runoff simulation results, the discharge hydrograph typify the tendency of floe rate change. This study discusses the parameters change Hydrology Days 2003. 50.
(7) Assessment of Land Use Change Impact on Water Conservation. by different land use type. By LINDO, the linear programming program, this study finds out the best resolution of the relationship of every parameter and land use type. As the land use change, the new parameter set will input to the HSPF model to calculate the water conservation capacity of different land use. The flow chart is showing in Figure 5. Table 4 shows the run off volume and the effected coefficient influenced by the land use changes. The hydrological environment was also influenced by land use changes. From the sequence of run off coefficient by land use types are forest, orchard;crop field , paddy rice, grass land; bare land/ landslide, road, and build up area. It can get the runoff estimation from land use changes for study area after input these new parameters to HSPF model. Figure 6 shows results. This Study designs three rainstorm types to be choose. The rainfall hyetograph is shown as Figure 7 and the HSPF simulation results is shown as Figure 8. Effected Parameters Linear Programing (Lindo) Best Resolution of Parameters. Area of Landuse Type Calculate new Parameter Value. HSPF Simulation. Landuse vs.Water Capacity. Figure5. Flowchart of land use change vs. water capacities Table 4. Run off estimation from land use changes for study area Land use Run off Volume change (CMS) contrastive area 4260.22 Orchard 4347.16 Paddy Rice 4453.62 Crop field 4414.99 Grass land 4510.93 Bare land / 4543.38 landslide Road 4598.34 Build up area 4634.44. Hydrology Days 2003. Run off Coefficient 0.74 0.75 0.77 0.76 0.78 0.79 0.80 0.80. 51.
(8) Total Runoff Volume (cms). Chou et al.. 4800 4598 4600. 4511 4454. 4634. 4543. 4415. 4347. 4400 4260 4200. 4000. 3800 Original Land Use. Orchard. Paddy Rice. Crop Field. Grass Land. Bare land/Landslide. Road. Land Use Type. Figure 6. The diagram of run off estimation from land use changes. 0 5 10 15 20 25 30. Small rainstorm. 35. Middle rainstorm. 40. Big rainstorm. 45 50. 1. 2. 3. 4. 5. 6. 7. 8. 9 10 11 12 13 14 15 16 17 18 19 20 21 22 23 24. Figure 7. Designed rainstorm hyetograph. Small rainstorm Middle rainstorm. time(hr). Figure 8. Designed rainstorm simulation results. Hydrology Days 2003. 52. 46. 43. 40. 37. 34. 31. 28. 25. 22. 19. 16. 13. 7. 10. 4. Big rainstorm. 1. runoff(cms). Designed rainstorm Simulation 200 180 160 140 120 100 80 60 40 20 0. Buildup area.
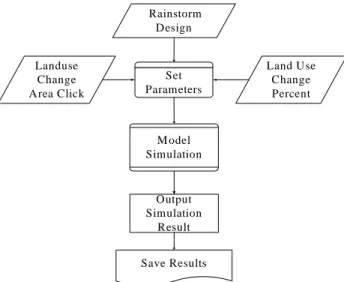
(9) Assessment of Land Use Change Impact on Water Conservation. 3.5 User Interface Establishment This system is developed in Window 2000 Chinese and ArcView GIS 3.2, programming language are ArcView Avenue script and Borland C++ Builder. This program use DDE or DLL to link to ArcView and expend the interface designing capability. Through the graphic user interface (GUI), the linkage flowchart of models and GIS system is showing as Figure 10.. G ra p h ic U s e r I n te r fa c e ( G U I ). A r c V i e w 3 .2. S im u la tio n S y s te m. C + + B u ild e r. A venue. DDE DLL W in d o w s 2 0 0 0. Figure 9. System framework. Rainstorm Design Landuse Change Area Click. Set Parameters. Land Use Change Percent. M odel Simulation. Output Simulation Result Save Results. Figure 10. System simulation linkage flowchart. 3.6 System Illustration Display Water capacity analysis interface is the same with soil erosion analysis and added with rainstorm chosen option. The input and output interface shown as below. By the results of HSPF simulation can bring out, it can get the discharge hydrograph of a rainstorm before and after land use changed. The discharge hydrograph is showing as Figure 12. The green line is the discharge hydrograph before land use changed, and the red one is the discharge hydrograph after land use changed. From this result, it is Hydrology Days 2003. 53.
(10) Chou et al.. conspicuous to see that when the area of development increases, the flood peak will increase and the time to peak will be shortened. This is the whys of watershed flood calamity.. Figure 11. Water capacity analysis input interface. Figure 12 Watershed discharge hydrograph compartment. 4. Conclusion The integration of GIS and Remote Sensing technologies can provide a powerful tool in assisting watershed management. HSPF model and GIS database were linked to analyze the impact to water conservation capacity from land use changes. The final resulted numerical figures for watershed conservation capacity estimation can assist the government in managing the controversy of economics development and resources conservation issues.. Hydrology Days 2003. 54.
(11) Assessment of Land Use Change Impact on Water Conservation. Using GIS to link the geographic database and models can calculate the models parameters directly from the topology and attributes by graphic user interface. This mode provides information of strategic decisions for the management agency as watershed conservation and management policy making. Acknowledgements. This research was supported by the Water Resources Agency of Ministry of Economic Affairs in Taiwan.. References Cheng ,J. D. , W. K. Lin and R. R. Su, 1994: A Study on Rainfall-Runoff Relationships of an Upstream Watershed in Central Taiwan with Geographical Information System and HEC-1 Hydrograph Package. J. Chinese Soil and Water Conservation, 25(3), 143-150. Chen, W. F. and H. C. Liao, 1996: Runoff Characteristic of Land Use Change in Urban Rim Area - Jing-Mei Watershed, J. Chinese Soil and Water Conservation, 27(4), 311-324. Chen, M. C and T.Y. Chou, 1998: The Impact of Land Use Changes on Water Conservation for Reservoir Watershed Area. 1998 ACSM Symposium, 517-525. Hsu , S. K., etc., 1998:Quantitative Model For Land Use Impact on Catchment Water Conservation Capacity, Symposium on Science and Policy Working Together in Catchment Management Proceedings. 177-199. Chou, T. Y. and M. H., Chen, 1999: Estimation Of Water Conservation Capacity For Reservoir Watersheds by Integrated GIS/RS Technologies. Geoinformatics and Socioinformatics The Proceedings of Geoinformatics'99 Conference, pp.4355. Mark, A. R., and D. T. Patrick,1992: Integrated Hydrologic Modeling with Geographic Information Systems. J.Water Resources Planning and Management, 119(2), 129-140. Portmann, F. T.,1997: Hydrological Runoff Modeling by the Use of Remote Sensing Data with Reference to The 1993-1994 and 1995 Floods in the River Rhine Catchment", Hydrological Processes. 11, 1377-1381. Shih S. F.,1990: Satellite Data and Geographic Information System for Rainfall Estimation. J. Irrigation and Drainage Engineering. 11(3), 319?331.. Hydrology Days 2003. 55.
(12)
Figure

+4


Related documents
& perfpicué exequitur > ut ne minuta_s quidem omittat» qualia funt: quod im- prudenter caperetur, (v.24.) quod in_, mediis oblectationibus oppreffi ejus Principes lomno
Department of Electrical Engineering Linköping University. SE-581 83 Linköping,
The first goal identified areas suitable for residential development, and was like all other types of urban development subdivided in physical and economical
Figure 2: (A) map of Eastern Africa showing the locations of archaeological sites in the database, base-map ASTER DEM (JPL-NASA, 2018); (B) locations of paleoenvironmental
The objectives of this thesis are; to analyse the rainfall change and rainfall variability in time and space and its impact on farmers’ potential to cultivate during the short
The objectives of this thesis are to analyse the rainfall change and rainfall variability in time and space and its impact on farmers’ potential to cultivate during the short
In the second essay we examine the determination of domestic trade policy when the world market price of food changes and a¤ects land demand by the agricultural and forestry
Fourth step: determining the environmental impacts of basic goods and packaging materials In the second step, the quantities of basic goods and materials that are used in
