THESIS
THE ACCULTURATION OF THE
SP.ANISH SPEAKING :PEOPLE OF FORT COLLn~S, COLORADO IN SELECTED CULTURE AREAS
submitted by
Julian Samora
In partial fulfil1ment of the requirements for the Degree of Master of Science
Colorado
Agricultural and l·Iechanical Colle'ge
Fort Collins, Colorado
August, 194'7 '[
1
8 ~ A ~Y
COI..OR ,a,t ,0 p.,
a
M r:OLLEF
---~---~--~.~-~--~
..~---~~,
COLORADO STATE COLLEGE OF
AGRICULTURE AND MECHANIC ARTS
.... ~ ... 21. ... + ... 194 ... 7 ..
I HEREBY RECOMMEnD THAT THE THESIS PREPARED UNDER MY SUPERVISION BY _. , ... ~~.J?N~9M
... _
... .
ENTITtED ... ~~ ... Ag.9¥.J.:~tJQ~
..
.9;I[ ...m ...
9.!?~J§~:§;f?~llig...
;t?~.QPLE...
2~..
!'.~~~...
9.2~.~~.1....
9.~~.9~g.~....
~...
~~~.~~~..
g~~~..
~~~..
BE ACCEPTED AS FULFILLING THIS PART OF THE REQUIREMENTS FOR THE DEGREE OF MASTER OF . . e.G ~fQ~ ... " ... h . . . .
MAJORING IN ... ~QQI9~99:X ... · .. H . . . • • • • • CREDITS ... § ... -. ... " .. APPROVED ... . Head of Department Examination Satisfaotory ~ e .. ,.
Permission to publish this thesis or any part of it must be obtained from the Dean of the Graduate School.
3
ACKNOWLEDGI!ENTS
The writer wishes to acknowledge his indebted-ness to Dr. G. T. Hudson for the constructive ~riticism offered during the preparation of this thesis. He is indebted, also, to Dr. R. W. Roskelley-for his many helpful suggestions and aid in preparing the schedule.
He appreciates the assistance and cooperation given him by Dr. R. T. Burdiok, l~s. Catherine Clarkt Mr. P. M. Berry, Dr. R. G. Dunbar, 1~. J. C. McKinnon and Itt. H. J. Henney.
He is particularly indebted to his wife for assistanoe and encouragement throughout the study.
He appreciates, alsot the cooperation of the SpaniSh-speaking people of Fort Collins, Colorado.
Chapter I I I III IV TABLE OF CONTENTS INTRODUCTION • • •
•
••
• • • ••
••
• statement of the problem • •Problem analysis • • • • Delimitations • • • • • • • • • • • • • • • • • • • • • REVIE\V' OF LITERATURE • • • •
•
• • • • • l~THODOLOGY • • • ••••
• • • • • • • • • The sampling technique • • • • • • ••
The schedule • • • • ••
• • • • • • • Validity and reliability • • • • • • • Definitions • • • • • • • • • • • • •GENERAL BACKGROUNDS .AND CHARACTERISTICS. OF THE PEOPLE • • • • • • • • • • • • • Nativity. • • • • • • •
•
• • • • • • Formal Education • • • • • • • • • • • Religion ••
• • • • • • • • • • • • • Occupation • • • • • • • • • • • • • • Income • • • • • • • •• •
•
• • ••
• vle1.fare • • • • • • • • • • • • • • • Formal social participation • • • • • Informal socia.l participation • • • •Selected Spanish mores • • • • • • • •
Page 15 16 17 17 22 29 29 30 30 33 37 39 39 39 41 43 43 43 43 46
4.
5
~ELE OF CONTENTS.--Continued Chapter Pagev
VI VII VIIILAlIGUAGE AND ACCULTURATION • • • • • • • 55
The use of Spanish in functional
situations • • • • ••• • • • • • • • 56 Personal relationships • • • • • • 56 In the home. • • • • • • • • • • • 58 At work • • • • • • • • • • • • • 58 In formal organization • • • • • • 62 In recreational activities • • •• 64 In business transactions • • • • • 67 In reading • • • • • • • • • • • • 68 In writing • • • • • • • • • • • • 68 Name changing • • • • • • • • • • • • 71 FOOD PATTERNS AND ACCULTURATION
•
• • •The use of selected "Spanishtlfoods •
79 80
The use of selected II Anglo" foods • • 87
FAlvIILY PATTERNS AND ACCULTURATIOl{ • • • 99
Attitudes toward:
Size of the family • • • • • • • • 99 Role of the members • • • • • • • 100 Guardianship • • • • • • • • • • • 101
lWarriage • • • • • • • • • • • • • 106
Divorce • • • • • • • • • • • • • 114 :MYTHOLOGY AND SCIENTIFIC KNO'\VLEDGE
AND ACCULTURATION • • • • • • • • .. • •
Mythology • • • • • • • • • • • • • Educatlon • • • • • • • • •
•
•
• •Medicine and health. • •
••
•
• • • Personal hygiene • • • • • ••
• • •119
119
128
IX SUlll1ARY A1ID D4PLICATIONS • • • • • • • •
120 125 131 136 150 .APPmlDIX • • • ••• • • • • • • • • • • • • • BIBL IOGRAPHY • • • • • • • • • • • • • • .,..
6
LIST OF TABLES
Table Page
1 ESTn·~T.ED TOTAL POPULATION OF SPAlTISH-SPEAKING F.AlvIILIES Ili FORT COLLINS
AND SAl,:PLE BO:eur....tATION INTERVlE\VED,
BY AGE AND SEX GROUPS, 1944 • • • • • • • • 31 2 ,Al·rOUNT OF FQa!1AL EDUCATION COJ..jpLETED
BY SPANISH-A11ERICAN PEOPLE IN FORT
COLLINS, COLORADO, BY AGE GROUPS, 1944 •
• •
40 3 PERCENTAGE DISTRIBUTION OF THESPANISH-SJ?EAKING PEOPLE OF FORT COLLINS,
ACCORDING TO THE TYPES OF OCCUPATIONS
THAT HAVE :BEEN HELD OR ARE !BEn~G HELD,
BY AGE GROUPS, 1944 • • • • • • • •
•
••
•
444 PERCENTAGE DISTRIBUTION OF SPANISH-SPE.AKING PEOPLE \'1ITHIU THE THREE
n~C01{E CLASSES, BY AGE GROUPS, 1944 •
•
• • 445 PERCENTAGE DISTRIBUTION OF
SPANISH-A1~RICANS ACCORDING TO TYPE AND EXTENT OF INForu·1AL SOCIAL PARTICIPATION, BY
48
AGE AND SEX GROUPS, 1944. • • • • • • • • • 6 PERCENTAGE DISTRIBUTION OF THE
SPANISH-AlvIERIC.ANS ACCORDING TO THE EXTENT TO
\VHICH SELECTED SPANISH CUSTOHS OR l'1fORES \VERE LEARNED AlID \110ULD BE TAUGHT TO
CHILDREN, BY AGE GROUPS, 1944 • • • • •
.
.
,
52 7 PERCENTAGE DISTRIBUTION OFSPANISH-Al .. JERICANS ACCORDING TO THE FREQUENOY
OF AIID THE PREFERENCE FOR THE USE OF SPANISH IN PERSONAL l?RAYERS AlID
C Olr.F.ESS IONS , BY AGE GROUPS, 1944 • • • • • 5?
8 PERCENTAGE DISTRIBUTION OF SPANISH-.Al>1ERICANS OF THE YOUliGEST AGE GROUP
ACCORDmG TO THE FREQ,UENCY OF, AIm
THE PREFERENCE FOR, THE USE OF SPANISH
\vITH l·00IBERS LIVING Dr THE HO~, BY
7.
LIST OF TABLES.--Continued
Ta.ble Page
9 PERCEaiTAGE DISTRIBUTION OF SPANISH-AlifERICANS OF THE ltIIDD~ AGE GROUP, 31-45, ACCORDING TO THE FRE~UENCY
OF, JUID PREFERENCE FOR, THE USE OF
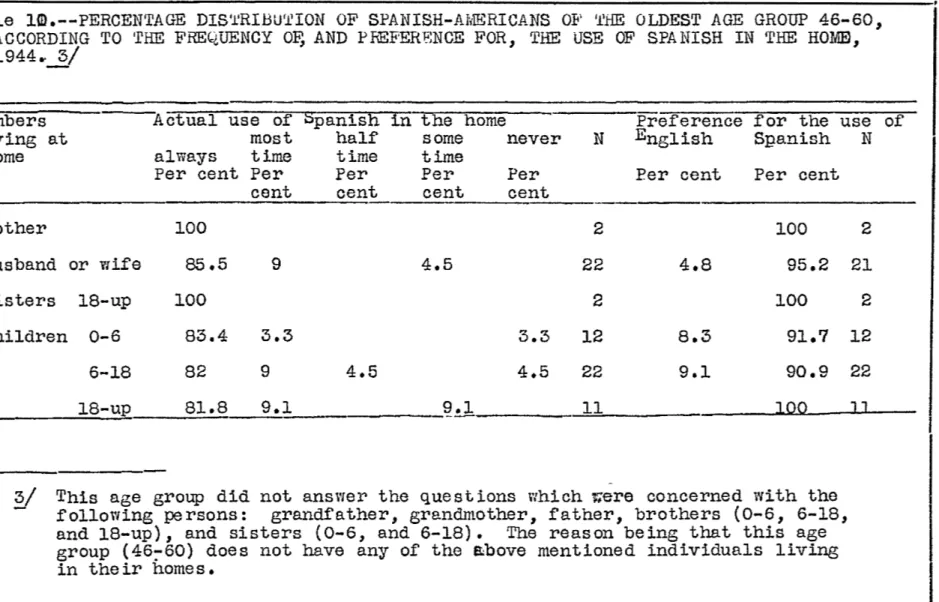
SPANISH IN THE HO}m, 1944. • • • • • • • • • 60 10 PERCENTAGE DISTRIBUTION OF
SPANISH-~~RICANS OF THE OLDEST AGE GROUP,
46~60, ACCORDING TO THE FP~~u]u~CY
OF, AND PREFERENCE FOR, THE USE OF
SPANISH IN THE HO}m, 1944 • • • • • • • • • 61
11 PERCENTAGE DISTRIBUTION OF SPANISH-Al/lERICANS ACCORDING TO THE FREQUENCY
OF, AND PREFERENCE FOR, THE USE OF
SPANISH AT \vORK, BY AGE GROUPS, 1944 •
•
•• • 63 12 PERCENTAGE DISTRIBUTION OFSPANISH-Al1ERIC.ANS ACCORDING TO THE FREQUENCY OF AND PREFERENCE FOR, THE USE OF SPANISH IN FOffitjAL ORGANIZATIONS, BY
AGE GROUPS, 1944 • • • • • • • • • • • •
•
• 65 13 PERCENTAGE DISTRIBUTION OFSPANISH-AlfERICANS ACCORDDTG TO THE FREQ,UENCY OF, AND PREFERENCE FOR, THE USE OF SPANISH IN RECREATlffifAL ACTIVITIES,
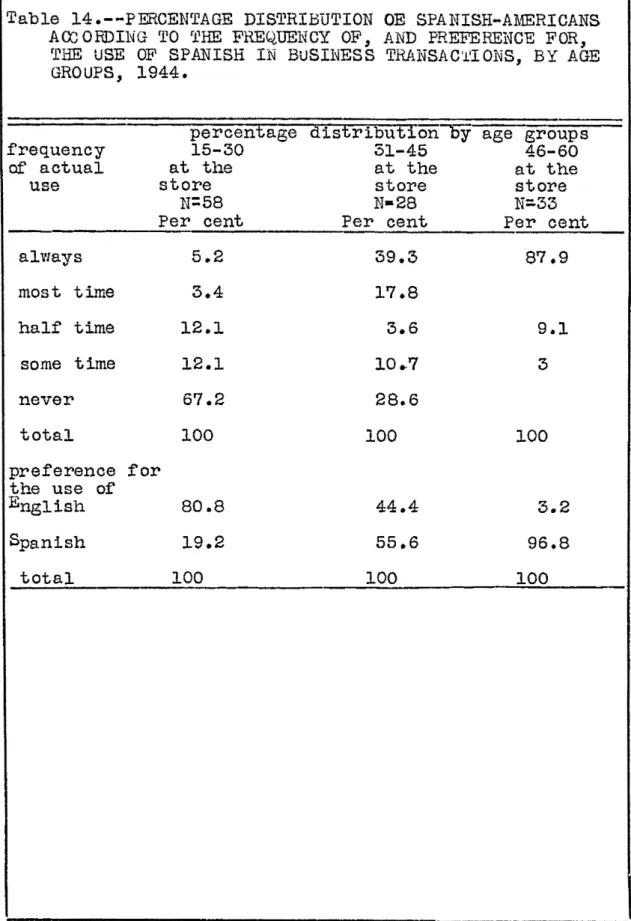
BY AGE GROUPS, 1944. • • • • • • • • • • • • 66 14 PERCENTAGE DISTRIBUTION OF
SPANISH-AlrIERIClJIS ACCORDING TO THE FBEQ,UENCY OF, .P...ND PREFERENCE FOR, TIm USE OF SPANISH
nf
BUSINESS TRANSACTIONS, BYAGE GROUPS, 1944 • • • • • • • • • • • • • • 69
15 PERCENTAGE DISTRIBUTION OF SPANISH-AlriERICANS ACCORDING TO THE FREQUENCY
OF, AND PREFEREnCE FOR, THE USE OF SPANISH IN "lRITING LETTERS, BY AGE
GROUPS, 1944 • • • • • • • • • • • •
• •
• • 7016 PERCE1~TAGE DISTRIBUTION OF SPANISH. AlvIERICANS ... 6..CCORDnfG TO THE FREQ,UENCY
OF, AND THE PREFERENCE FOR, THE USE OF SPANISH IN RE1J)ING, BY AGE
LIST OF T~S.--Continued
Table
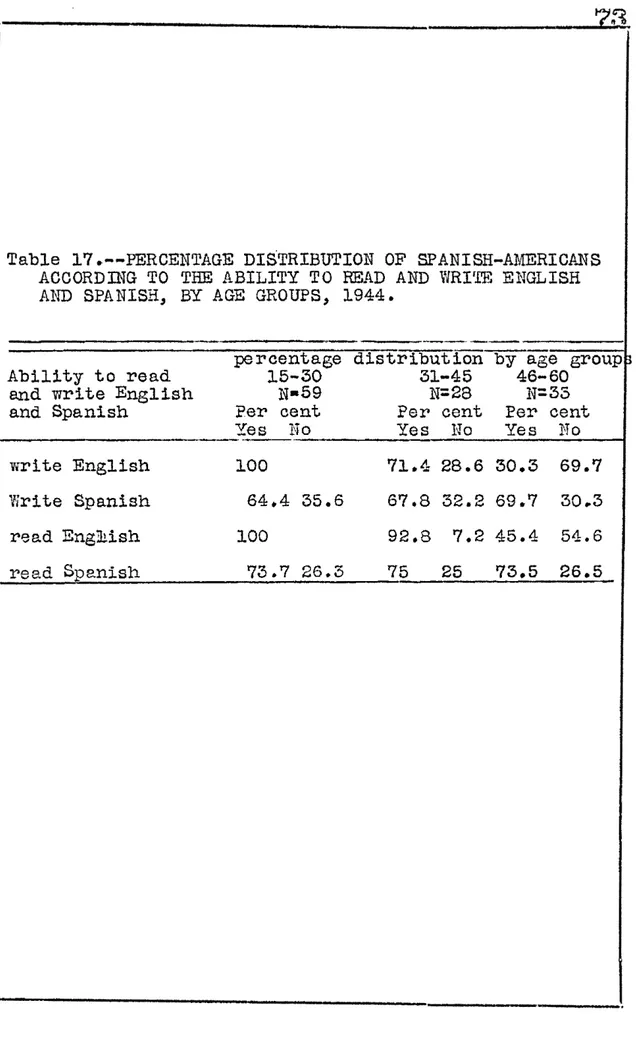
17 PERC]a{TAGE DISTRIBUTION OF SPANISH-.A1.fERIC.ANS ACCORDING TO THE ABILITY
TO READ AND \v.RlTE-ENGLISH AND SPANISH,
Page
BY AGE GROUPS, 1944 • • • • • • • • • • • • 73 18 PERCENTAGE DISTRIBUTION OF
SPANISH-.Al·IERICANS ACCORDING TO THE TYPICAL
CONSUl~TION, INDIVIDUAL CONSUMPTION,
AND THE ATTITUDES TO\vARD FRESUENCY OF
CONSmJPTION OF TORTILLAS, BY AGE
GROUPS, 1944 • • • • • • • • • • • • • ••••• 82
19 PERCENTAGE DISTRIBUTION OF SPANISH-Al{ElRIC}..NS ACCORDING TO THE TYPICAL CONSUl"lPTION, INDIVDJUAL CONStOO?TION,
AND THE ATTITUDE TOVIARD FREQ,UENCY OF
CONSU}D?TION OF CHILE, BY AGE GROUJ?S, 1944.. 83 20 PERCENTAGE DISTRIBUTION OF
SPANISH-Al'lERICANS ACCORDnTG TO THE TYPICAL CONSUMPTION, INDIVIDUAL CONSUl'iPTION,
AIID THE .A.TTITUDES TmvARD FREQ,UENCY OF
CONSUl-mTION OF DRIED BEANS, BY AGE
GROUPS, 1944 • • • • • • • • • • • • • • • • 85
21 PERCENTAGE DISTRIBUTION OF SPANISH-Al4ERICANS ACCORDING TO THE TYPICAL CONSUMPTION, INDIVIDUAL CONSU1~TION,
.AND THE ATTITUDES T<TvlARD FREQ,UENCY OF
CONSUl1PTION OF T.A}IALES, BY AGE GROUPS,
1944 • • • • • • • • • • • • • • • •
•
•
•
•
22 PERCENTAGE DISTRIBUTION OFSPANISH-AMERICANS ACCORDING TO THE TYPICAL CONSUNPTION, nmIVmUAL CONSUMFTION,
AND THE ATTITUDES TO\t[ARD FREQ,UENCY OF
CONSIDfPTION OF EI...n?.ANADAS, BY AGE
86
8.
GROUPS, 1944 • • • • • • • • • • • • • • • • • 88 23 PERCENTAGE DISTRlBUTI01T OF
SPANISH-,Al·lERICANS ACCORDnrG TO THE TYPICAL CONSUl·ll?TION, nmIVIDUAL CmrSillvIPTION,
~l) THE ATTITUDES TOWA..'tID FREQ,UE1{CY OF CONSUMPTION OF ATOLE, BY .AGE
9
LIST OF TAELES.--Continued
Table Page
24 mRCENTAGE DISTRIBUTION OF
SPANISH-.AlmRICANS ACCORDlliG TO THE TYPIC.AL COllSDl{PTI01T, INDIVIDUAL CONSUl,fPTION,
AND THE ATTITUDES TOVIARD FREQUENCY OF C ONSffiy1PT ION OF CEREALS, BY AGE
GROUPS, 1~4' • • • • • • • • • • • • • • • 91 25 PERCENTAGE DISTRIBOTION OF
SPANISH-AMERICANS ACCORDnTG TO THE TYPICAL CONSu}rPTION, INDIVIDUAL CONSU!\1PTION,
.AND THE ATTITUDES T01ifARD FREQUENCY
OF CONSUNPTION OF BAKERY BREAD,
BY AGE GROUPS, 1944. • • • • • • • • • • • 92 26 PERCENTAGE DISTRIBUTION OF
SPANISH-.A:NERICANS ACCORDn-rG TO THE TYPICAL
CONSUNPTION, INDIVIDUAL CONSU1\il?TION, AND THE ATTITUDES To\'1ARD FREQUEliCY
OF CONSUJ:IPTION OF LEAFY VEGETABLES,
BY AGE GROUPS,1944 • • • • • • • • • • • • 93 27 PERC]ulTAGE DISTRIBUTION OF
SPANISH-.Al-.IERICANS ACCORDDTG TO THE TYPICAL
CONSUliPTION, INDIVIDUAL CONSUl·fPTION, MID THE ATTITUDES To\fARD FRE~UENCY OF
CONSIDIPTION OF ORANGES, BY AGE
GROUPS, 1944 • • • • • • • • • • • • • • 95
28 EERC]rr{TAGE DISTRIBUTION OF
SPANISH-ANERICANS ACCORDmG TO THE TYPICAL CONSUl1PTION, nrnIVmUAL CONSIDIPTI01T,
.AND THE ATTITUDES TO\'lARD FREq,UENCY OF CONSUJ:.lPTION OF TOl,fATCES, BY AGE
GROUPS, 1944 • • • • • • • • • • • • • • 96
29 PERCElfTAGE DISTRIBUTION OF SPANISH_
Al·IERICANS ACCORDllfG TO THE TYPICAL
CONSIDfi?TION, INDIVIDUAL CONSU}~TION, AND THE ATTITUDES TOVTARD FREQUENCY OF
CONSUNPTION OF l·lILK, BY AGE
LIST OF TABLES.--Continued
Tables Page
30 PERCENTAGE DISTRIBUTION OF SPAHISH-Alv1ERICANS ACCORDING TO THEm ATTITUDES
TOi:1ARD Ln~ITmG THE NUl'IBER OF CHILDREN .A F.Al1ILY SHOULD HAVE, BY
AGE GROUPS, 1944 • • • • • • • • • • • • • 102 31 PERC]ThTTAGE DISTRIBUTION OF
SPANISH-A}IERIC.AliS ACCORDnIG TO THEm ATTITUDE TO\,l.A_lID THE \r[IFE r S ROLE IN HELP ll1G TO l·IANAGE FJJ"IILY AFFAIRS, BY AGE GROUPS,
1944. • • • • • • • • • • • • • • • • • • • 102
32 PERCENTAGE DISTRIBUTION OF SPANISH-AlvlERICANS ACCORDn'1'G TO THEm ATTITUDE
TOWARD THE AUTHORITY OF THE HUSBAND TI'1' ALL F.A1\IILY J.IA.TTERS, BY AGE GROUPS f
1944. • • • • • • • • • • • • • • •• • •• • 103 33 PERCE1lTAGE DISTRIBUTION OF
SPANISH-AItlERICANS ACCORDING TO THEn ATTITUDE
TOvlA.1ID vlOI,lElf BELONGING TO SOCIAL CLUBS,
BY AGE GROUPS, 1944 0 • • • • • • • • • • • 103
34 PERCENTAGE DISTRIBUTION OF
SPAlTISH-.Al-iERICANS ACCORDTI'1'G TO THEm ATTITUDE
TavlARD 11ARRIED 'VIOHEN v,orucn-rG IF THEY DON'T HAVE TO CONTRIBUTE TO THE SUPPORT
OF THE FAl-iILY, BY AGE GROUPS, 1944. • • • • 104
35 PERCENTAGE DISTRIBUTION OF
·SPANISH-AMERICANS ACCORDmG TO THEm ATTITUDE TO\vARD OR&DIEN"CE OF GmLS TO OLDER
BROTHERS, BY AGE GROUPS, 1944 • • • • • • • 104 36 PERCENTAGE DISTRIBUTION OF
SPANISH-Al{IDRICANS ACCORDll'lG TO THEm ATTITUDE
Tm·lA..1ffi CHILDREN'S OBEDIENCE TO PARENTS
'iliILE THEY REl!A.m DT THE HOUSEHOLD,
,\VHETHER l1ARRIED OR :HOT, BY AGE
GROUPS, 1944 • • • • • • • • • • • • • • • 105 37 PERCENTAGE DISTRIBUTION OF
SPANISH-JJ'4ERICANS ACCORDnTG TO THEIR ATTI'rtJDE
TOWi.RD SUPPORT OF PARENTS IN OLD AGE,
LIST OF T~S.--Continued
Table Page
38 PERCENTAGE DISTRIBUTION OF SPANISH-Al'rmRICAlIS ACCORDING TO THEm ATTITUDE TO\'/ARD THE RELIGIOUS AND l\fORAL
TRAnfING OF GODPARENTS TO GODCHILDREN,
BY AGE GROUPS, 1944. • • • • • • • • • • • 107 39 PERCENTA&E DISTRIBUTION OF
SPANISH-Al·IERICANS ACCORDING TO THEIR ATTITUDE
TO-wARD '~1HETHER OR NOT GODPA..B.ENTS SHOULD CARE FOR GODCHILDREN IN CASE OF THEIR PARENTS r DEATH, BY AGE
GROUPS, 1944 • • • • • • • • • • • • • • • 107 40 PERCENTAGE DISTRIBUTION OF ltABRIEID
SPANISH-Al·1ERICANS OF THE YOUNGEST
AGE GROUP ACCORDING TO TEEm ATTITUDES
.AND PRACTICE REGARDING ItIARRIAGE, 1.944.. • • 110 41 PERCENTAGE DISTRIBUTION OF1:i\RRIED
SPANISH-Al1ERICANS OF THE IflIDDLE AGE GR01JP ACCORDnTG TO THEIR ATTITUDE _llliD
PRACTICE REGARDmG ItlARRIAGE, 1944 • • • • l.ll 42 PERCENTAGE DISTRIl3UTION OF }iA,..l1RIED
SPANISH-Al{ERICANS OF THE OLDEST AGE GROUP ACCORDING TO TlmIR ATTITUDE
AND PRP.CTICE REG~1:ffiING Y.lARRIAGE, 1944. • • 112 43 PERCENTAGE DISTRlBUTI01-r OF SmGLE
SPANISH-AloIERICANS ACCORDnfG TO THEIR ATTITUDE ~j) PRACTICE REGA..1IDDlG lw!ARRIAGE,
BY AGE GROUPS, 1944 • • • • • • • • • • • 113 44 PERCENTAGE DISTRIBUTION OF
SPANISH-,Al/IERICANS ACCORDmG TO THEm .A.TTITUDE TO\vARD l-iIXED (ANGLO-SPANISH) l-rARRIAGES,
BY AGE GROUPS, 1944 • • • • • • • • • • • 115 45 PEROENTAGE DISTRIBUTION OF
SPANISH-~IERICANS OF THE YOUNGEST AGE GROUP ACCORDlliG TO THEm ATTITUDE TO\.,rARD
1.2
LIST OF TA]LES.--Continued
Tables Page
46 PERCENTAGE DISTRIBUTI01T OF SPANISH-AltIERIOP.NS OF THE MIDDLE AGE GROUP ACCORDING TO THEm ATTITUDES TatTARD
DIVORCE FOR SPECIFIC CAUSES, 1944 • • • • 116 4? PERCENTAGE DISTRIBUTION OF
SPANISH-.A}lERICANS OF THE OLDEST AGE GROUP ACCORDING TO THEIR ATTITUDE TO\'TARD DIVORCE FOR SPECIFIC CAUSES, 1944 • 48 PERCENTAGE DISTRIBUTION OF
SPANISH-• • • 116
AMERICANS ACCORDn~G TO THEIR BELIEF OF
SELECTED l1YTHS, BY AGE GROill?S, 1944 • • • 122 49 PERCENTAGE DISTRIBUTION OF
SPANISH-Al1ERIC.ANS ACCORDING TO THEIR BEHAVIOR PATTERNS IF THEY HAD A COI{!-10N COLD,
EY AGE GROUPS, 1944 • • • • • • • • • • • 122 50 PERCENTAGE DISTRlBUTIOlf OF
SP.ANISH-.A1-m:RICANS ACCORDmG TO THEIR BEHAVIOR PATTERNS IF THEY HAD l>IEA.SLES, BY
AGE GROUPS, 1944 • • • • • • • • • • • • • 123
51 PERCENTAGE DISTRIBUTI01T OF SP.ANISH-AMERICANS ACCORDn~G TO THEm BEHAVIOR PATTERNS IF THEY HAD APPENDICITIS,
BY AGE GROUPS, 1944 • • • • • • • • • • • 123 52 PERCENTAGE DISTRIBUTION OF
SPANISH-AlmR.ICANS ACCORDING TO THEIR BEHAVIOR PATTEFtNS IF THEY WERE GOING TO HAVE
A BABY, BY AGE GROUPS, 1944 • • • • • • • 124 53 PERCENTAGE DISTRIBUTION OF
SPANISH-.A1~ICANS ACCORDn~G TO THEIR BEHAVIOR
PATTEBlTS. IF THEY WERE SO SICK THEY THOUGHT THEY \VERE GOING TO DIE, BY
AGE GROUPS, 1944 • • • • • • • • • • • • 124 54 PERCENTAGE DISTRIBUTION OF SPAl~ISH
.A1~1ERICANS ACCORDn~G TO THEIR BELIEF m PERSONAL VACCINATION AND VISITING
1.3
LIST OF TABLES.--Continued
Table Page
55 PERCENTAGE DISTRIBUTION OF
SPANISH-A11.!ERICANS ACCmnmG TO THEIR ATTITUDE
TOWARD CERTAIN HABITS OF PERSONAL
HYGIENE, BY AGE GROUPS, 1944 • • • • • • • • 127 56 PERCENTAGE DISTRIBUTION OF
SPANISH-AMERICANS ACCORDnTG TO THEIR ATTITUDE TO\'lARD THE GR.ADE LEVEL THAT BOYS
MID GmLS SHOULD REACH :BEFORE
LEAVnfG SCHOOL, BY AGE "GROUPS, 1944 • • • • • 13 0
57 PERCENTAGE DISTRIBUTION OF
SPANISH-.Al-1ERICJ..NS ACCORDING TO THEIR ATTITUDE
TO\vARD THE AGE LEVEL AT \mICH BOYS
.AND GIRLS SHOULD LEAVE SCHOOL, BY
AGE GROUPS, 1944 • • • • • • • • • • • • • • 130 58 THE TWENTY PER CENT SA}fPLE TAKEN
LIST OF FIGURES
Figure
1 PERCENTAGE DISTRIBUTION OF THE CATHOLIC AIID PROTESTANT SPANISH-SPEAKING
PEOPLE ACCORDING TO RELIGIOUS
14
Page
ACTIVITY, BY AGE GROUP, 1944 • • • • • • 42
2 PERCENTAGE DISTRIBUTION OF SPANISH-.AI-IERICANS ACCORDING TO FORMAL
SOC IAL PARTIC IPATION, BY AGE
GROUPS, 1944 • • • • • • • • • • • • • • 47 PERCENTAGE DISTRIBUTION OF
SPAl.;rISH-Al·iERICANS ACCORDING TO INFORl{AL SOCIJ...L PARTICIPATION, BY AGE
GROUPS, 1944 • • • • • • • • • • • • 4 PERC]uITAGE DISTRIBUTION OF
SPANISH-•
• 47.A!·rERICANS \VHO HAVE, OR '\!fOULD LIKE TO,
ANGLICIZE THEIR N~m • • • • • • • • • • 76 5
6
?
PERCENTAGE DISTRIBUTION OF SPANISH-AlvlERICANS ACCORDn;rG TO PREFERENCE
FOR EllfGLISH OR SPANISH l..fOVIES • • • • • • PERCENTAGE DISTRIBUTION OF SPJ...NISH
All1ERIC.A1~S ACCORDn'fG TO PREFE..B.ENCE FOR ENGLISH OR SPANISH RADIO PROGRA}S P.ERCEl'fTAGE DISTRIBOTIm'f OF SPA1\fISH
.AJ.ilERICANS ACCORDmG TO THE LANGUAGE IN WHICH THE INTERVIEVI "lAS
• •
CONDUCTED • • • • • • • • • • • • • • • 76
"I?
Chapter I INTRODUCTION
..
-is
Among the many problems oonfronting the Spanish Americans of ~ort Collins, the problem of acoulturation
is perhaps the most important.
One of the main reasons for the lack
ot
acculturation among SpaniSh-speaking people is the fact that as a Whole, these people have been highly resistant to any change in their culture patterns. These people have persisted in their use of the SpaniSh language,
thei
f~ily patterns, their food patterns, their myths, their little regard for education and their philosophy of life. Their philosophy under-emphasizes thrift, hard work and
the material things in life and therefore is out of place in a country where a1most everything is operated on a competitive basis (14). In short, the tendency has been for the Spanish-speaking people to retain many of their traditional customs w1thin their whole culture pattern. The retention of these traditional patterns has been due largely to their cultural isolation in the past and to their low economic condition. (33:311)
The writer will not condemn nor will he praise, either the culture of the Spanish-speaking or the culturel of the EngliSh-speaking people; he will, however, try to .
16
show to what extent the Spanish-speaking people have de-viated from their original culture and also to what
ex-tent they ha.ve accepted the "Anglo"
11
culture, in selected culture areas.Let us turn, then, to the task of defining the basis from Which the deviations will be shown. This
will
be known as "Spanish"
y
culture 01" culture of theSpattirh-speaking people. It must be noted that the definitions of "Anglo and "Spanish" culture must of necessity be in general terms and not specific, due in part to regional and geographic differences and other factors WhiCh tend to influence culture.
Statement ~ ~ problem
To what extent have the Spanish-speaking people of' Fort Collins deviated from their original oulture
patterns and accepted the culture patterns of the English. speaking people in the culture areas of language, food patterns, fami1y patterns, end mythology and scientific knowledge?
"Anglo· in this study does not necessarily mean of English extraction. The word "Anglo"
in its oorrupt oonnotation is used in the West and Southwest to mean English-speaking, regard-less of extraction, to differentiate from
Spanish-speaking.
The word uSpanish" is used very loosely. It must include SpaniSh, Spanish-Amerioan, Mexican. American, SpaniSh-Indian and
Problem analysis
The answers to the following questions are necessary for the solution of the problem:
1. Are the Spanish-speaking people deviating from their use of SpaniSh and adopting English as their language?
2. Are the Spanish-speaking people deviating from the use of certain food items that have been
identified with their culture and accepting the use of certain "Anglo" food items?
3. Are the SpaniSh-speaking people deviating from some of their original family patterns and acoepting "Anglo" frumily patterns?
4. Are the Spanish-speaking people deviating from some of their original mythology and soientific knowledge?
Delimiting ~ field
When the writer began thinking of making a study of the Spanish-speaking people of Fort Collins, he began
by thinking in terms of an history of the people. It was soon discovered, however, that a vast amount of work had already been done in the field of history.~
AI
For a list of titles pertaining to materials about the SpaniSh-speaking people seeSaunders. Lyle.
A guide to materials bearing
on cultural relations in New Mexico.The writer next turned his efforts to the field of culture and there, too, he found that a great many studies had been made describing the Spanish-speaking culture; another study describing the culture would be of li ttle value.
After a conference with the major professor, the writer decided to explore the field of deviation from
culture patterns, and the field of acculturation. This waS
begun by reviewing Clark Wissler's (52) culture saheme ~ with its nine major culture areas and various sub-areas.
y
The Culture Scheme 1. Speecha. language
b. writing systems, etc. 2. l\fa.terial habits
a. food habits b. shelter
c. transportation and travel d. dress
e. weapons
f. utensils, tools, etc.
g. occupations and industries
3. Art
et
a. carving, painting, drawing, musio, o. 4. Mythology and scientific knowledge
5. Religious practices a. ritualistio forms
b. treatment of siok
c. treatment of dead
6. Family and Booial systems
a. marriage
b. methods of reckoning relationships c. social control
d. sports and g~es
? Property
a. real and personal
b. standards of value and exchange o. trade
8. Government
a. political forms
b. judicial and legal procedures
Consideration was given to a study of the SpaniSh-American culture in terms of Wisslerts culture sCheme.
1.9
The problem was outlined and questions were prepared for an attempt to cover the Whole culture scheme. One attempt was made to try to show a deviation from ~e original
culture within the whole cu1ture scheme and at the s~e time to deter.mine a degree of acculturation. Another idea considered an index or criteria to deter.mine what the English-speaking people expect of the Spanish-speakine people, and then to determine the position of the Spanish~ speaking people in terms of the criteria developed.
From the explorations and observations up to this point, it was not deemed feasible, from the stand-point of time and requirement, to try to cover the whole
culture soheme as outlined by
Mr.
Wissler. After various meetings and consultations with ~e writer's majorprofessor and others, it was decided to select certain culture areas and make a more intensive study of them. attempting to show a deviation from the original Spanish oulture and an acceptance of the Anglo oulture. rather than to try to cover the Whole field in general ter.ms.
The areas selected were language, family patterns, food patterns, and mythology and scientifio knowledge. §./
§I The areas selected are not necessarily a total index of acculturation, but they are important parts of the whole culture scheme.
There were several reasons for selecting these areas in preference to other areas that might have been Chosen.
1. An acculturation in these areas will tend to Show not just a casual contact with the English. speaking culture, but a definite attempt to ~itate or adopt the foreign culture pattern.
2. In terms of acculturation the areas are of prfmary importance in that they depend upon the
individual's initiative and willingness to Change rather than on other factors often beyond the individual's contDol.
3. The areas are significantly different from the Anglo patterns to Show a definite contrast.
4. The areas can be readily sampled and so~e
observations recorded.
5. The areas tend to be more unifor.m and less subject to change wi~in the culture sCheme.
It will be noted that only one of the areas selected, food, is concerned with material traits. Since non-material traits tend to be more resistant to Change,
(Walter 30:246) due to background and training, it was felt that they would be a better indication of
acculturation than the material traits, Which are more dependent on economics rather than education, training. and willingness to learn.
Some of the reasons for not including other areas or sub-areas were these:
1. Their similarity
to
the English-speaking culture.2. Their secondary importance in terms of aoculturation.
3. Their lack of unifor.mity from which to base or Show aoculturation or deviation.
4. Their dependence on other factors and circumstances beyond the individual's control.
Chapter II
REVIEW OF LITERATURE
22
Although many articles, theses, and books have been written describing the Spanish-speaking ou1ture, onl a few writers have tried to show a deviation from the traditional Spanish-speaking culture.
Hymer (12) in 1924, making a study of seleoted exican fmmigrants offered the conclusion that an en-couraging degree of adaptation to Amerioan customs was evidenced in general.
The study Shows that literaoy runs much higher in this group studied than 1s generally true of the Mexi-can people as a Whole; material traits give evidence of a
igher type of social and industrial organization. A
"'-large degree of freedom from tradition was shown in ment nd social traits. Religious beliefs and practices indi-cate a gradual tendency to break away trom Oatholicism.
e group tested was above the average in background, and .interests, and therefore was too small and select to make any generalizations.
Rose (20), writing in 1932, gave a list of some of the prinoipal factors in, and evidenoes of,
23
A summary of some of the ~rincipal factors int and evidences of, aBB~ilation.
1. Slowly rising standard of living and adopticn of American ways of living.
2. Growing interest in community and political affairs.
3. School attendance and wider education. 4. English language being used and learned. 5. Reading by ohildren as a result of educa-tion.
6. American dress being almost universally adopted.
? Growing rumbition to improve social status. 8. Decrease in clannishness.
9. Decrease in strength of family and com-munal control.
10. Increase in contacts at school, in g~es anc work.
11. Growth in understanding of each other. 12. Growing individualism.
13. Gradualness of Changes and lack of de-moralization.
She also found that education was the factor most active in aiding assimilation. Her study would also
seem to show a positive correlation between length of timE in the United States and a rising standard of living. ThE bulk of her evidence is toward eventual assimilation.
24
Walter (30), in his study in 1938, found that the differences in the situations of the three villages that he studied lay, in part, in their dissimilar orien-tation to English-speaking centers. Of the three villageE that he surveyed, Guadalupe was almost completely isolatec from the EngliSh-speaking culture, Sandoval was partly isolated, and A1~eda was in oonstant contact with the Englian-speaking culture and very near to a large English.
speaking center. In contrast to the isolated and the partly isolated village, the people of Alameda were be-ginning to supplement their diets with canned and ready-baked foods of the English-speaking culture. They had also adopted many toilet articles and other personal item! • Their Children invariably completed high school and con-tinued to higher training. A deliberate effort was evi-denced in the more ambitious frumiliee ot Alameda to keep their children from hearing any Spanish in the home.
Among the obvious faotors whiCh tended to re-tard sooial change and whioh tended to reduce the
effectiven~ss of communication with other oulture groups. thus retarding the assimilative process, were isolation, language, and poverty.
Walter's study revealed that Guadalupe was sinking calro1y to her fate with culture pattern intact, Sandoval was under-going a preliminary period of intense frustration and confusion, with its social structure
25
asstmilative process without major dislocations or con-fusions.In another study Walter (31), in 1939, gave a description of the socia-economic conditions prevailing ix Spanish-speaking communities of Northern and Central New Mexico. His conclusion was that the assimilation problem has six phases: (1) over population in Spanish-speaking communities; (2) loss of land through sale and taxes;
(3) erosion; (4) growing independence on dry farming; (5) marginal state of S~anish-speaking people isolated from their culture and attempting to compete as
individu-als in an Anglo economic system; (6) ll.eonage status
resulting from exploitation and extension of credit. Per-manent solution of this problem, he continued, requires extensive regional and state planning, aiming to uncover new resources and at the same time afford protection and guidance to the Spanish-speaking people as they adapt to the new economy.
Johansen (13), in 194~ in one phase of his dissertation said that family mores are becoming less 12-ower.ful as a means of social control. Family solidarity
is also decreasing. Conflict between Spanish-American and Anglo-American culture groups to a considerable degreE has given ,'lay to acconunodation. There has been a mutual acceptance on the part of both Spanish-Americans and Anglo-Americans of culture traits of the opposite group, but not to a sufficient degree to say that assimilation
26.
bas taken place.
Humphrey (10), in 1943, gave a general compari-son on the assimilation of American culture by Mexicans 1x Detroit and San Antonio. He found that the smaller number
of Mexicans in Detroit, the lack of a M:exican II quarterU ,
their greater choice of houses and neighbors, their greater opportunity of employment of diverse sorts, the closer contacts and friendlier relations with Americans of varied ethnic backgrounds, the more widesnread partici-pation in American life, and the relative lack of dis-crimination, have all aided in accentuating the rap~dity
of assimilation of American customs and have aided in the ~netration, ~y other groups, of the Mexican culture whicr
is retained. On the other band, in San Antonio the Mexi-cans have built up and maintained their community and culture because of the size of the Mexican population. Thus the relative size and proportions of the respective ~~ul&tions is an important factor in the problem of
assimilation •.
In 1943 Pijoan and Roskelley (18) conducted a nutrition study among the Spanish-Americans in northern polorado. They found that:
••• diets are obviously those of a high-carbohydrate, lO\'I-protein, low-fresh-vegetable regime, and this is compatible with what one-would expect in low-income groups struggling for survival. In other words the bulk-producing, easily-stored carbOhydrate 1s the chief food. \18:11)
The study also revealed that there bas been a considerable change in food ~atterns among many families in recent
years, more specifically, the basic foods eaten now. The change has been in the increased use of white bread,
tomatoes, citrus fruits, cabbage, peas, and canned fruits. They concluded in part:
••• Acculturation towards a proper dietary must depend upon the local consumption of available foods highnd.nuyitam1.ns or high in proteins of signifioant
biologic value. This can be carried out either through the sChools or through a proper eduoational system in terms of the local culture. It must be borne in mind, however, that it is difficult for people of rural low income groups to adopt or accept the idea of a balanced meal, and this being the case they should be encouraged to consume foods necessary for proper body economy in an over-all period
dependent upon time and £unction. (l8:l9)
Carolyn Zeleny, in her study, URelations between the Spanish-Americans and Anglo-Americans in New Mexico," (33) stated in 1944 that although some assimilation has taken ple.ce in both directions since the two cultures were
rought in contact, they have remained in fundamental iShar.mony. There are several reasons why their· rate of Bstmilation has been extremely slow: (1) they did not oin the population individually or in families of their wn free will, as a result they have not been motivated
o became Americanized; (2) their culture was deeply ooted in the region; (3) the poverty of the
SpaniSh-erican has been both socially and cu1tur~lly an ieola-ion force which has retarded asstmilatieola-ion; (4) the ontinued use of Spanish haa isolated the group and re-arded other aspects of assimilation. She noted that ome degree of assimilation has taken place, but this has
Donovan Senter (27) published a study in 1945 oomparing the adjustment pattern of three types of Spaniel. speaking Amerioans; the Manitos of New Mex~co, the
border Mexicans and the "Pochos" of Southern Callfornib .• Senter stated that these groups face three possibilities of adjustment: (l) they may attempt to maintain their original culture; (2) they may attempt quick aoceptance
ot
the new culture, the situation leadM ing to eventual assimilation, although the path will be roughened by prejudice; (3) they may develop something foreign to both their ancestral culture and to that ot the present dominant culture.All three possibilities bave been tried by the Spanish-speaking groups. The Y~nitos of New Mexico di-vided themselves between ~e first and the second possi-bility, the border Mexioans have attempted only the first and the "Pochos" of Southern California have attempted something of all three.
Chapter III
METHODOLOGY OF THE STUDY
The sampling technique
29
The SpaniSh-American group in this study of acculturation tends to be homogeneous. Therefore it was decided th~t a twenty per cent selected sample would be Bufficient to test the Whole group.
The sampling procedure was begun by obtaining the tota1 number of Spanish-speaking fRmilies in Fort Collins. This information was obtained in part from
the
school oensus records.
11
Realizing that not all fgmilies have children of sChool age, this list was checked against the Holy Family Church reoords and the Spanish Presbyterian Church records. The total number- 0 Spanish-speaking frumilies was then found to be 165. To deter.mine the composition of these f~11ies. the writer interviewed, at random, twenty-seven f~llies.The data from the interviews were broken down into age and sex groups. This data, then. were used to esttmate the total number of persons that could be
expected within the various sex and age groups in the
11
Fort Collins School Census for District No.5, 1943.total population, Table 1. From the estimated total number of persons a twenty per cent sgmple was taken.
The total number of persons was 595 and the twenty per cent srumple, then, was 119 persons. g/ The sohedule
3Q
Making the schedule was one of the most
difficult problems encountered. The schedule had to be brief and concise so that the questions could be easily answered. Oare had to be taken to avoid ambiguity in the questions; the questions were also arranged so that they could be answered accurately in so far as possible.
arloue types of questions were considered before the final form was approved. Oopies were taken into the
field by the writer to be tested. Defects in the Bchedul ere corrected after the test, and a new sChedule was repared in final for.m to be used in the study.
~~ __ ~ and reliabilitx
Since the scientific method employed in this is the descriptive method, certain precautions were to insure validity and reliability of data. The
g/ For a more detailed discussion of the sampling procedure see Appendix A.
3:1
,---.---.---~Table l.--ESTIMATED TOTAL POPULATION OF
SPANISH-SPEAKING FAMILIES IN FORT COLLINS AND· S.AlYll?LE POPULA-TION INTERVIEWED, BY AGE .AND SEX GROUPS, 1944
Sample population
Age Groups interviewed Estimated total population
Male Female :f.!ale Female
15-30
gj
1'7 34 98 19631-45 10 13 58 75
46-60 14 17 81 87
Total 41 64 237 358
~ The number of males in the first age group is much lower than the corresponding age group of females. This is due to the fact that a great number of the young men are in the Armed Forces. A condition which ,.,as brought an by the war. The
male srumple from the first age group, therefore, may not be truly representative of the total group.
methods employed were these:
1. The writer and his wife lived in the SpaniSh-speaking section of Fort Collins for one year, becoming well acquainted with most of the people and becoming members of the group.
32
2. The writer became very well aoquainted
with
the resident Catholic Priest, serving more or less as his secretary, writing letters, and translating for him.3. The writer was a schoolmate and a. good friend of the Spanish Presbyterian Minister. These relationships enabled him to get the backing of both
the Catholic and· Protestant Church.
4. The writer and his wife were active in the Spanish Activities Committee and also served as di-rectors of the recreation program for the Spanish-speaking youth while in Fort Collins.
5. The writer Checked twenty per cent of the schedulee, chosen at random, with Father J'ohn
Fullana and Reverend David Cisneros; also with Mrs. Whiteford and Mrs. Foreman of the Spanish Activities Committee. In the opinion of the writer, the four
people named i:now the people under study, have worked with them, and were well qualified to check
the sChedules for possible errors. §I
Only one schedule was found to be deviating from the tr.huth. This was checked with another sched~ e from t e same liome and the errors were corrected.
33.
6. The writer was born and reared among the SpaniSh-speaking people and in perhaps the samecir-cumstances as the people under study. He has gone to school with them and worked with them for many years. While going to school he always had a feelin@ of living in two different cultures; the Spanish-speaking culture in the home and the English-speaki~ culture away from the home. He was therefore
acquainted with both cultures and has undergone a process of acculturation himself.
7. Only the writer and his wife interviewed the people, thus insuring oonsistency in filling out
the schedules. Definitions
Certain ter.ms were used in the schedule and in the study w.nich may need explanation for a better under-standing. The following definitions are consistent througnout the study.
1. Acculturation--the name which is given to all the various ways in WhiCh individuals or groups take on new oulture traits and incorporate them into their own manner of living. (8:372)
2. Religious participation §/--activity in religious organizations.
§/ The above oriteria, as to attendanoe, oontribu-tion and aotivity was what Father ~ohn Fullana of the Holy Fgmily Church and Reverend DavId CienerOSHo~thMe Sd~anishdPresbYteria~ Ch~roh,
High--attends services four times per month, regUlar contribution, active in activities sponsored by the church.
Medium--attends services not more than twice a month irregular contribution.
Low--attends services not more than six times per year, contributes irregularly.
3. Income--earnings in money. High--$1800.00 and up, per year. Medtum--$900.00-$1799.00 per year. Low--$0.OO-$899.00 per year.
4. Formal social participation--activity in organizations.
Hign--attends two-thirds of the meetings, pays dues and holds offioe.
Medium--attends one-third to two-thirds of the meetings, pays dues.
~ow--attends less than one-third of the meetings,
pays dues.
5. Informal sooial participation--actlv!ty in other than organized group.
High--attends from 1 to 3 shows a week; listens to from 20 to 45 radio programs a week; and devotes more than 14 hours a week to the radio.
Medium--attends from 1 to 3 shows a week; listens to from 5 to 20 radio programs a week; and devotes from ? to 14 hours a week to the radio.
35
Low--attends less than 2 shows a week; listens to less than 5 radio programs a week; and devotes less than 7 hours a week to the radio.
6. Welfare--aid or assistance, in money or goods from public or private agencies.
? Anglo--Engliah-speaking; not neoessarily of EngliSh descent.
8. Medicine--medicine prescribed by a licensed doctor or bought from a drugstore or pharmacy, not
from a "medico".
9. Spanieh-Americane--Americane of Spanish or Mexioan origin.
10. Spanieh--of Spanish, Spanish-American, or Mexican origin.
11. Medico or curandero--not a licensed doctor, but a person who cures with herbs and homemade
remedies and also serves as mid-wife.
12. uOJo"--a belief that one person can admire. look at, or desire another personts baby to such an extent that the baby becomes ill. His only cure, the~,
is for the admiring person to give the baby a drink of water from his mouth.
13. Marriage:
pedimiento--the first stage in the marriage process in which the groom's parents ask the bride-to-bets parents for her hand in marriage.
36
emprenda or prendorio--the second stage in whiChthe
bride's parents announoe the forthcoming marriage oftheir daughter.
entriega--the last stage in whiCh the witnesses or ~adrinoB give the married oouple back to the pare~ts as man and wife.
14. Food:
tortillas--round disks made of flour, (corn or Wheat) Shortening, salt, water, and baking powder. Used in place of bread.
t~ales--a Mexioan dish made of cornmeal, mixed
with diced meat and seasoned with red pepper, dipped in oil and steamed, often in a wrapper of corn
husks.
empanada--an individual pie made from minoe meat. fruit, or pump~in and cooked in deep fat.
atole--a gruel made from blue oornmeal, may be sweet or salty, usually drunk with milk.
Chapter IV
GENERAL BACKGROUNDS AND CHARACTERISTICS OF THE PEOPLE
The early Spanish explorers c~e to what is now the United States in the middle 1500s. General
colonization took plaoe during the seventeenth century and the early part
ot
the eighteenth oentury. The peopie in the main were an agrarian population who met andmixed with the people of indigenous cultures in the
Southwest. Settlements were developed by the nineteenth century and the Spanish culture was well establiShed.
In the early part of the nineteenth century the group becrume Mexican citizens by virtue of the successful revolution from Old Spain. Following the period of revolution, the Indian and SpaniSh cultures
in the Southwest were confronted with the penetration and advance of the Anglo culture from eastern United States, whiah cu~1nated in the Mexican War.
There was a nominal absorption in theory, but not in actuality, of the Spanish cultUre by the United States with the granting of citizenship to the
38.
The ·period during the advance of the EngliSh-speaking people into the Southwest was a period ofconflict and aocommodation. with neither group seemingly trying to understand the culture of the other.
The Spanish-speaking group. unab~ to under-stand the culture of the now dominant Anglo group, citizenship notwithstanding, receded into cultural is-olation with most of their culture intact.
Economic and social factors brought the SpaniSh-speaking people out of isolation .in the early part of the 20th century. It has been difficult for them to cope successfully with the uAmericanll culture, but
they have been unwilling in many instances to relinquish their own cultural heritage.
It is with this background that the writer endeavored, in 1944, to delve into selected culture
areas of the Spanish-speaking people of Fort Collins. to try to determine to what degree they had aocepted the Anglo culture.
Certain backg~ounds and characteristios of
every group of human beings provide a basis for a general description of the group and a basis for an understand-ing of the group. A groupts background and character-istics also tend to influence their practices and habits. Therefore, some of the characteristics of the Spanish-Americans in Fort Collins are important to understand
3ft
Nativitx
Of the total number of Spa.nish-speaking people in Fort Collins, 89.2 per cent were born in the United states.
A
very great majority of them were born inNew
Mexico and Colorado. The remainder of the group, or 10.8 per cent were born in Mexico.
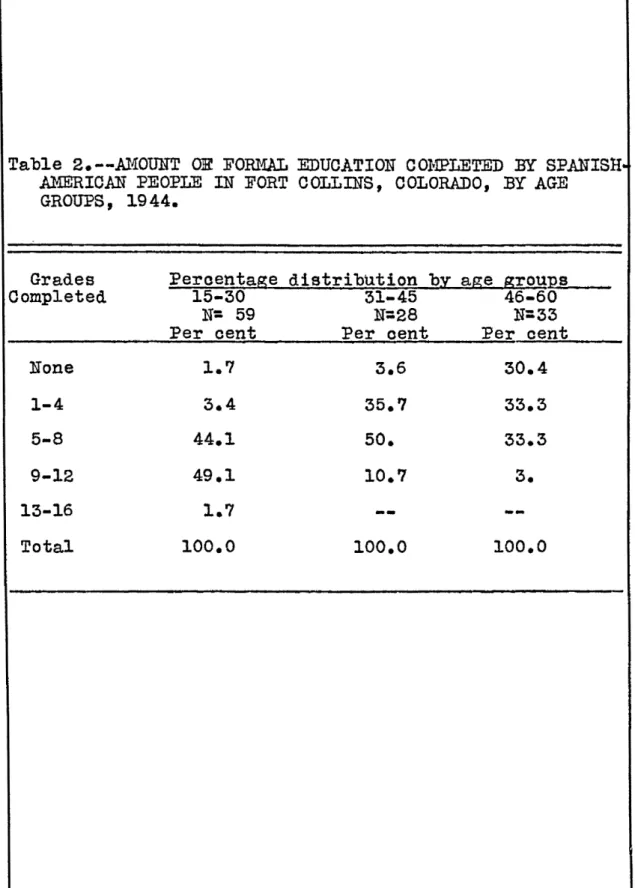
Formal education
It has generally been noted in other studies that the Spanish-speaking people do not have as much
formal education as the English-speaking people.
(24:61)
The educational level of this group is also very low." The highest average grade completed for any
one age group was the ninth grade. A very small percent-age of the total group has completed high school, and Of this group only one has gone to college. Thirty per" cent of the oldest age group had no formal education andi..llhe
average grade they completed was the third grade. The youngest age group has reoeived more education than the other t,~o age groups, Table 2.
In spite of the faot that there has been an eduoational backwardness among these people, there is the realization by these people of a growing need for more
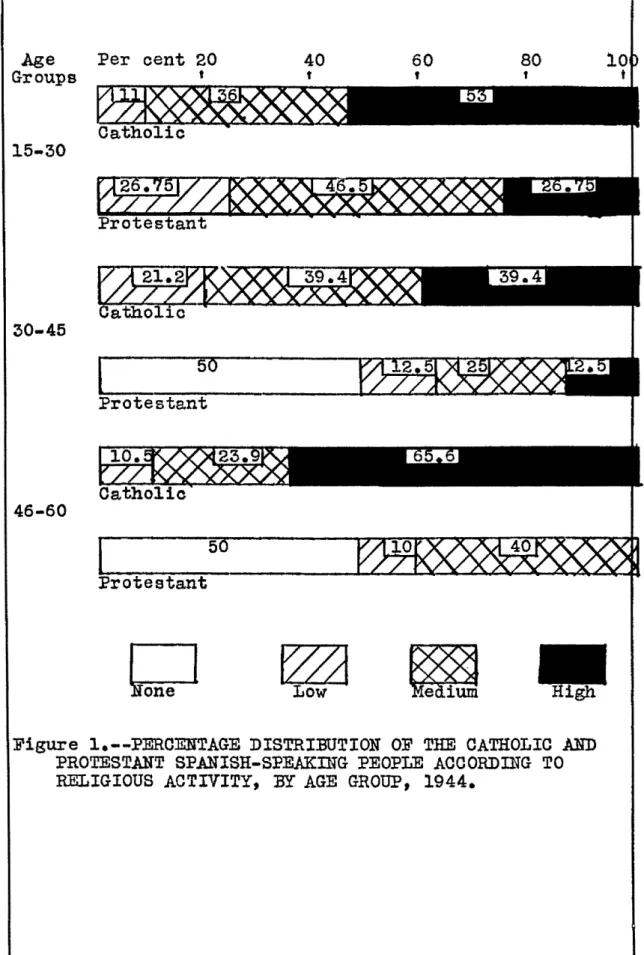
education. Religion
Historically and traditionally the religion of the Spanish-speaking people has been Roman Catholic. It has only been in recent years that the Protestant Church
40
..
Table 2.--Al~OUNT
em
FOmaL EDUCATION COI-IPLETED l3Y SPANISHII AMERICAN PEOPLE IN FORT COLLINS, COLORADO, BY AGEGROUPS, 1944.
Grades Peraentage distribution b~ age grou~s
Completed 15-30 31-45 46-60
N= 59 N=28 N=33
Per cent Per oent Per cent
None 1.7 3.6 30.4 1-4 3.4 35.'1 33.3 5-8 44.1 50. 33.3 9-12 49.1 10.7 3. 13-16 1.7
--
--Total. 100.0 100.0 100.0as become interested in acquiring memberships from among the Spanish-speaking people. It is safe, then, to assume that if Protestantism is encountered among the SpaniSh-speaking people, a certain degree of aCCUlturation has taken place. Especially is this true if there has been a change from the Catholio to the Protestant religion.
Conoerning the group in question, there was a relatively high degree of Protestantism evident, with
er cent being Protestants. The two Protestant groups represented were the Spanish Presbyterian and the AssemDl of God.
In general, the religious participation of the group was much higher than that of the Protestant roup, Figure 1.
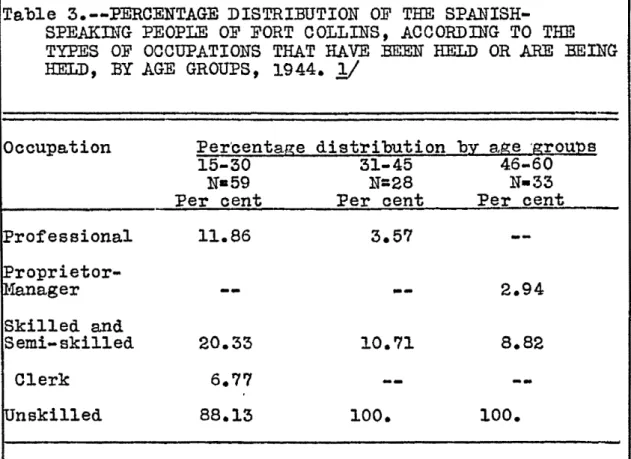
a.tion
The majority of the Spanish-speaking people of Collins are occupied in farm work of one kind or
Very few have risen from the ranks of laborers o the semi-skilled, skilled or professional groups. Onl welve per cent of the youngest age group and three per ent of the middle age group have held professional ositions. Three per cent of the oldest age group have
eld positions of manager or proprietorship. Ten to
twenty per cent have held skilled or semi-skilled positio e large majority of all three age groups, 88 per
per cent, have worked or now work in unskilled labor, Table 3.
Age Per cent 20 Groups t 15-30 30-45 46-60 otestant
~
LowFigure 1.--PERCENTAGE DISTRI:BUTION OF THE CATHOLIC .AND PROTESTANT SPANISH-SPEAKmG PEOPLE ACCORDING TO
RELIGIOUS ACTIVITY, BY AGE GROUP, 1944.
43
IncomeSince the Spanish-speaking people of Fort Collins have evidently not had muCh opportunity for ad-vancement and since most of the people are in the
unskill-ed laborer class, it is only natural that the majority of the people belong to the low-inoome olass. Very few belotg to the middle-inoome class and only one or two belong to the high-income class, Table 4.
The inoome classes were determined by compil-ing the data of these people and dividcompil-ing it into hight medium and low olasses.
The
majority of the people earn less than $900.00 per year, which in terms of a comparisot with income classes on a national level, would placethem
in the very low-income ~ass. Some ~~iters, as late as 1941 and 1942, listed f~ily incomes under ~500.00 in
the
subsistence and po~erty class. Although the data present-ed was individual income rather than family income the implications of belonging to a low-income class still hold ~rue.
welfare
Since the majority of the people included in this study can be olassified in the low-income class, it is to be expected, then, that the majority, 65 per cent, have received welfare aid in some form or another.
Social participation
Social participation is measured by those ac-tivities in which individuals partici~ate with other
..
44
Table 3.--PERCENTAGE DISTRIBUTION OF THESPANISH-SPEAKING PEOPLE OF FORT COLLINS, ACCORDnlG TO THE TYPES OF OCCUPATIONS THAT HAVE BEEN HELD OR ABE BEING HELD, :BY AGE GROUPS, 1944.
11
-occupa.tion Per/cen tage dist~ibution b~ a,ge 'grou12s
15-30 31-45 46-60
N-59 N=28 N-33
Per cent Per cent Per cent
Professional 1J..86 3.57
-- Proprietor-Manager--
--
2.94 Skilled and Semi-skilled 20.33 10.71 8.82 Clerk 6.77--
--Unskilled 88.13 100. 100.Table 4.--PERCENTAGE DISTRIBUTION OF SPANISHwSPEAKING PEOPLE WITHIN THE THREE INCOME CLASSES, BY AGE GROUPS t
1944.
Income Per'centage distribution be age grou12s
15-30 31-45 46-60
N=59 N-28 N-33
Per cent Per cent Per oent
Hie
~1800- 2999--
3.6 --Medium $900-$1799 20.3 14.3 6.0 Low ~O-$899 78.0 ?8.6 94.0 No data. 1.6 3.6 --Total 100. 100. 100.11
The peroentages do not total 100 per cent becauseit
was possible for an individual to answer in more than one ca.tegorYt45
persons. There are two types of social participation, for.mal and informal. Formal participation includes participation in organized groups; not only attending meetings, but also contributions, committee work done,offices held, and membership maintained. Informal par-ticipation pertains to suCh activities which are carried on outside of organized groups. This includes attendance at movies, parties, and dances, visiting with friends, reading books, and listening to the radio. Infor.mal
participation is less definite and much more difficult· to analyze. Informal social participation infor.mation was
obtained for only two aotivities, attendance at movies and listening to the radio. Since these activities could be measured with a greater degree of accuracy than the others and since the people could participate in these activities from either the English or the Spanish point of view, or both, it was decided that informal social pat~ ticipation could be measured more accurately by these two activities.
The people do not belong tommany clubs and of those who do belong, the participation is about medium. As far as informal social participation is concerned, the majority of the people questioned do not attend many
movies or listen to many radio programs. The writer ob-served that the people did not read very many books nor did they attend many parties. The most popular form of informal social participation seemed to be visiting
friends, an activity which the writer did not measure but
merely observed, Figures 2 and 3.
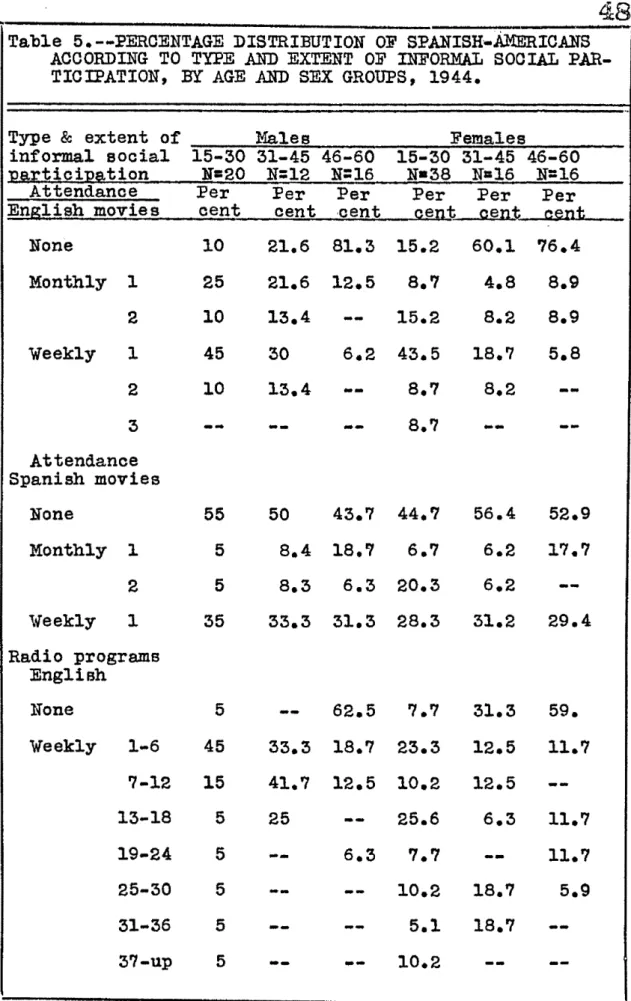
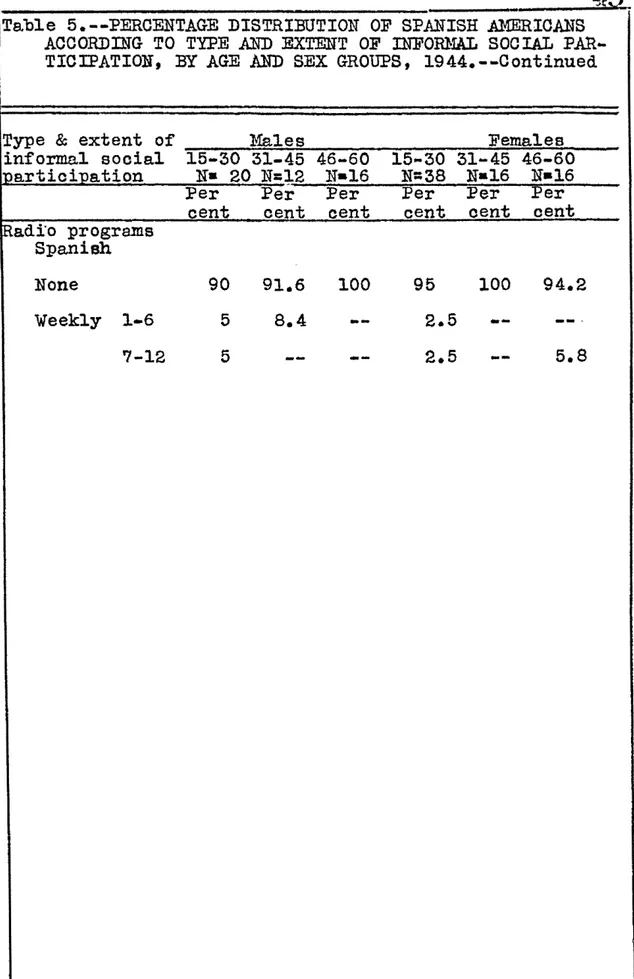
On the Whole the younger age groups attended more English movies and listened tommore English radio programs than the older group. Only thirty per cent of all age groups attended Spanish movies onoe a week and also a very small percentage of any group listened to Spanish radio programs. Both the Spanish movies and the Spanish radio programs were available to the groul', Table 5. Seleoted Spanish mores
The writer selected six moreSODr customs which may be considered important within the SpaniSh culture. The reasons for selecting these mores were to find out if
the Spanish-speaking people of Fort Collins had been
taught these mores, and, if having been taught these ~oreE t
they would in turn teach them to their children.
From the language area the writer selected one more which dealt with the learning of Spanish before
English. A culture group which keeps its language. intact is generally considered ver y resistant to cuI tural changee. When a oulture group begins to accept a foreign language,
suCh a Change can be considered very important.
With the a~ove in mind the writer asked if the people were taught to speak Spanish before English and 68 per cent, 93 per cent and 94 per cent of the three age groups, respectively, were ta.ught to speak Spanish before ~nglish. In considering whether they would teach their
Per cent 20 40 60 80 100
t t , , t
I
6"1.8Males and females 15-30
~
_ _ _ _~
_ _~
_ _ _ _ _ _~~~l~~~?~
I
96.4Males and females 31-45
L
69.7Males and females 46-60
D
None~ ~
Low MediumFigure 2. --PERCENTAGE DISTRIBUTION OF SPANISH-AMERIOAN'S ACCORDlliG TO FORMAL SOCIAL PARTICIPATION. BY AGE GROUPS, 1944.
Per cent 20 40 60 80 100
t t t t
114.3~03l~1W~
Males and females 31-45I
l
None
ts(SZSf
l-Ied1umFigure 3.--PERCENTAGE DISTRIBUTION OF SPANISH-AMERICANS
ACCORDING TO INFORlW, SOCIAL PARTICIPATION, BY AGE
48
_.
Table 5.--PERCENTAGE DISTRIBUTION OF SPANISH~AMERICANS
ACCORDING TO TYPE .AND EXTENT OF INFORMAL SOCIAL PAR-TICIPATION, BY AGE .AND SEX GROUPS, 1944.
Type & extent of Males Females
informal social 15-30 31-45 46-60 15-30 31-45 46-60 J2~l:tioi12~tion N=20 N=12 N=16 N-38 N=16 N=16 Attendanoe Per Per Per Per Per Per English movies cent oent -cent Qent
Qent
c~ntNone 10 21.6 81.3 15.2 60.1 76.4 Monthly 1 25 21.6 12.5 8.7 4.8 8.9 2 10 13.4 15.2 8.2 8.9 Weekly 1 45 30 6.2 43.5 18.7 5.8 2 10 13.4
--
8.7 8.2 --:;--
8.'1 --Attendance Spanish movies None 55 50 43.7 44.7 56.4 52.9 Monthly 1 5 8.4 lB.? 6.7 6.2 1'1.7 2 5 8.3 6.3 20.3 6.2 'veekly 1 35 33.3 31.3 28.3 31.2 29.4 Radio programs English None 5 62.5 '1.'1 31.3 59. Weekly 1-6 45 33.3 18.7 23.3 12.5 11.7 7-12 15 41.7 12.5 10.2 12.5 13-18 5 25 25.6 6.3 11.7 19-24 5 6.3 7.7 11.7 25-30 5 10.2 18.7 5.9 31-36 5 5.1 18.7 37-up 5--
--
10.249
Table 5.--PERCENTAGE DISTRIBUTION OF SPANISH AMERIOANS ACCORDnTG TO TYPE AND EXTENT OF INFOIDIAL SOCIAL PAR-TIOIPATION, BY AGE
AND
SEX GROUPS, 1944.--ContinuedType
&
extent of }'fa.les Females informal sooial 15-30 31-45 46-60 15-30 31-45 46-60 partioilJa.tion N- 20 N=12 N-16 N=38 N-16 N-16 Per Per Per Per Per Percent cent cent cent oent oent fRadi"o programs
Spanish
None 90 91.6 100 95 100 94.2
Weekly 1-6 5 8.4
--
2.550
children S~aniah before English, a change is apparent inthe first two age groups with 52 per cent of the youngest age group and 61 per cent of the middle age group indicat~
ing that they would teach their children Spanish before EngliSh. All of the oldest age group, however, would
teach their Children Spanish before English. This obser-vation of a Change in the acceptance of another language
is evident in the chapter on language and aoculturation. From the family area the writer chose two mores~ One dealing with doing things (running errands, etc.) for other people and the other dealing with the orossing or folding of the ar.ms when giving other people a glassoof water.
Over 90 per cent of all three age groups were taught the first more and over 90 per cent of all three age groups would teaoh this more to their children.
Concerning 'the seoond more, only 45 per oent of the youngest ag-e group were taught to fold their arms when giving other people aglass of water yet more than 85 per cent of the other two age groups were taught this . more. Only 40 per cent of the youngest age group, 71 per
oent of the middle age group and 82 per cent of the old-est age group would teach this more to their Children.
The more from the social control area, girls should never go to dances, parties or movies unless ac-companied by some member of the frumily, was taught to 61 per cent of the youngest age group, three-fourths of