The Placental Immune Milieu is Characterized
by a Th2- and Anti-Inflammatory
Transcription Profile, Regardless of Maternal
Allergy, and Associates with Neonatal
Immunity
Martina S Abelius, Camilla Janefjord, Jan Ernerudh, Göran Berg, Leif Matthiesen, Karel Duchén, Lennart J Nilsson and Maria Jenmalm
Linköping University Post Print
N.B.: When citing this work, cite the original article.
Original Publication:
Martina S Abelius, Camilla Janefjord, Jan Ernerudh, Göran Berg, Leif Matthiesen, Karel Duchén, Lennart J Nilsson and Maria Jenmalm, The Placental Immune Milieu is Characterized by a Th2- and Anti-Inflammatory Transcription Profile, Regardless of Maternal Allergy, and Associates with Neonatal Immunity, 2015, American Journal of Reproductive Immunology, (73), 5, 445-459.
http://dx.doi.org/10.1111/aji.12350
Copyright: Wiley: 12 months
http://eu.wiley.com/WileyCDA/
Postprint available at: Linköping University Electronic Press
The placental immune milieu is characterized by a Th2- and anti-inflammatory transcription profile, regardless of maternal allergy, and associates with
neonatal immunity
Running head: Gene expression in placenta, PBMC and CBMC
Martina Sandberg Abelius, PhD1,2,Camilla Janefjord,PhD2, Jan Ernerudh, MD, PhD,3 Göran
Berg, MD, PhD,4 Leif Matthiesen, MD, PhD,4,5 Karel Duchén, MD, PhD6, Lennart J Nilsson, MD, PhD7, Maria C Jenmalm, PhD1,2.
1 Division of Paediatrics, Department of Clinical and Experimental Medicine, Linköping
University, Linköping, Sweden
2 Unit of Autoimmunity and Immune Regulation, Department of Clinical and
Experimental Medicine, Linköping University, Linköping, Sweden
3 Department of Clinical Immunology and Transfusion Medicine, and Department of Clinical
and Experimental Medicine, Linköping University, Linköping, Sweden
4 Department of Obstetrics and Gynaecology, and Department of Clinical and Experimental Medicine,
Linköping University, Linköping, Sweden
5 Department of Obstetrics and Gynaecology, Helsingborg Hospital, Helsingborg, Sweden 6 Department of Paediatrics and Department of Clinical and Experimental Medicine,
Linköping University, Linköping, Sweden
7 Allergy Center and Department of Clinical and Experimental Medicine, Linköping
Correspondence:
Martina Sandberg Abelius
Unit of Autoimmunity and Immune Regulation (AIR) Pathology building, floor 10, Entrance 69
Linköping University, SE-581 85 Linköping, Sweden
Abstract
Problem: How maternal allergy affects the systemic and local immunological environment during pregnancy and the immune development of the offspring is unclear.
Method of study: Expression of 40 genes was quantified by PCR arrays in placenta, PBMC and CBMC from 7 allergic and 12 non-allergic women and their offspring.
Results: Placental gene expression was dominated by a Th2-/anti-inflammatory profile, irrespectively of maternal allergy, as compared with gene expression in PBMC. p35
expression in placenta correlated with fetal Tbx21 (Rho=-0.88, p<0.001) and IL-5 expression in PBMC with fetal galectin1 (Rho=0.91, p<0.001). Increased expression of Th2-associated CCL22 in CBMC preceded allergy development.
Conclusions: Gene expression locally and systemically during pregnancy was partly associated with the offspring’s gene expression, possibly indicating that the immunological milieu is important for fetal immune development. Maternal allergy was not associated with an enhanced Th2 immunity in placenta or PBMC, while a marked prenatal Th2-skewing, shown as increased CCL22 mRNA expression, might contribute to postnatal allergy development.
Introduction
Pregnancy and allergic disease have both been postulated as T-helper (Th) 2 phenomena, since Th2-associated cytokines are present at the feto-maternal interface1 and the same cytokines are induced in response to allergens.2-4 The combination of these two states, i.e. allergic and pregnant, has been associated with favorable effects on the maintenance of pregnancy, namely, longer gestational age, higher birth weight and length,5-7 lower risk of pre-term birth8 and shorter waiting time to achieve pregnancy.9 Thus, maternal allergy could
constitute an evolutionary benefit. From a clinical perspective, it is not settled whether pregnancy influences the severity of maternal allergy symptoms, which may be due to several confounding factors occurring during pregnancy.10
However, the idea of magnified Th2 responses during pregnancy in allergic women is supported by the observation of increased total IgE levels during pregnancy as compared to after delivery in allergic women,11 the association of maternal allergy and reduced IFN-γ production to fetal and paternal alloantigens12-14 and a lack of down-regulation of allergen-induced IL-13 secretion in late gestation.15 The increased propensity of allergic mothers to mount Th2-responses could, on one hand, be regarded as favorable for pregnancy, but on the other hand, be regarded as unfavorable, as fetal exposure to a strong Th2 environment could influence the immune development in the offspring to a Th2-associated phenotype favouring IgE production and possibly allergy development later in life.16 Accordingly, children of allergic mothers have shown increased cord blood (CB) IgE levels as compared with children with allergic fathers or children with two non-allergic parents.17-20 Furthermore, maternal IgE levels during pregnancy correlated with CB IgE and the Th2-associated chemokine CCL22 levels.21 In
addition, maternal IgE levels in late gestation predicted the offspring’s IgE levels at birth and at 1 year of age.22
The importance of the Th1/Th2 profile at birth for allergy development later in life has been characterized by our group21, 23, 24 and by others.25, 26 Increased CCL17 and CCL22 levels at
birth were associated with development of allergic symptoms and sensitization during the first 2,21, 24 325 and 6 years of life.23 Also, questionnaire-reported wheezing during infancy was preceded by high CB CCL22 levels.26
The impact of maternal allergy on local and systemic gene expression during pregnancy and the fetal immune development, is not understood. In fact, the immunological environment in the placental tissue, including cells of fetal origin, has not been previously characterized in normal pregnancies in relation to maternal allergy status.
We aimed to assess the systemic and local gene expression during pregnancy in allergic and non-allergic mothers and the immunological interactions between mother and child by analyzing expression of 40 selected Th1-, Th2-, regulatory T-cells (Treg-) and
Th17-associated genes in placenta, mononuclear cells derived from peripheral blood (PBMC) and cord blood (CBMC). This novel study design with paired PBMC and placenta samples gives us the opportunity to characterize gene expression profiles locally and systemically during pregnancy, as well as their potential association with fetally derived gene expression in CBMC. Further, the importance of early priming of the fetal immune system was assessed by analyzing gene expression in CBMC in relation to allergy development during childhood. We hypothesized that the immune profile in placenta, PBMC and CBMC is biased towards a Th2-associated profile in the allergic as compared with the non-allergic mothers and that allergy development in the offspring is preceded by a pronounced Th2-profile at birth.
Materials and methods Study group
This study included 19 pregnant women from the Linköping area, County of Östergötland, Sweden (Fig 1), who participated in a longitudinal study from early gestation to 1 year post-partum. An experienced allergy research nurse interviewed the women regarding their allergic status. Seven women reported allergic symptoms (allergic rhinoconjuntivitis, ARC, n=7 of whom 1 woman also had eczema, primiparous n=3, parous n=4) and allergic
sensitization was confirmed by the Phadiatop test (Phadia, Uppsala, Sweden). Twelve women reported no allergic symptoms (primiparous n=5, parous n=7) and none of them were
sensitized. Maternal autoimmune diseases represented an exclusion criterion. PBMC were collected at gestational week (gw) 10-12, 15-16, 25, 35, 39 and 2 and 12 month after
delivery. Placenta samples and CBMC were collected at birth. The 19 pregnant women were selected based on (i), allergic status (allergic symptoms combined with sensitization or no allergic symptoms without sensitization) and (ii), availability of paired PBMC (gw 39), placenta and CBMC samples. Maternal and neonatal characteristics of the complete cohort are described in detail elsewhere.11, 23
The children of the women described above were followed prospectively from birth up to 6 years of age with questionnaires and clinical examinations at 6 and 12 months of age by an experienced allergy research nurse and at 24 months and 6 years of age by a paediatric allergologist.23 The definition of atopic dermatitis (AD) was pruritic, chronic or chronically relapsing non-infectious dermatitis with typical features and distribution. Asthma bronchiale (AB), at 2 years of age, was defined as three or more episodes of bronchial obstruction at least once verified by a physician. A diagnosis of AB at 6 years of age required one or more episodes of bronchial obstruction after two years of age, at least once verified by a physician. ARC was defined as seasonal itching and running eyes and nose, at least 2 times after
exposure of an inhalant allergen and no signs of infection. Urticaria was defined as allergic if it appeared within one hour after allergen exposure, at least at two separate occasions. A diagnosis of food allergy required vomiting and/or diarrhoea, hives, aggravated eczema or wheezing on at least two separate occasions after ingestion of certain offending food. Oral allergy syndrome was defined as allergic if it appeared at least at two separate occasions after ingestion of certain offending food.
Skin prick tests (SPT) were performed with standardized allergen extracts from Allergologisk Laboratorium A/S, (ALK, Soluprick®, Hørsholm, Denmark), i.e. egg white, milk (6, 12, 24 months and 6 years), cat (12, 24 months, 6 years), and birch and timothy (24 months and 6 years). Histamine hydrochloride (10 mg/ml) was used as positive control, albumin diluent (ALK) as a negative control and the cut off for positivity was when the mean wheal diameter was at least 3 mm. The allergen specific IgE concentrations to food and inhalant allergens (PhadiatopInfant test, Phadia, Uppsala, Sweden) were determined at 6, 12, 24 months and 6 years and inhalant allergens (Phadiatop test, Phadia) at 6 years of age using ImmunoCAP (Pharmacia Diagnostics, Uppsala, Sweden). The cut-off for positivity was 0.35 kUA/l for both
tests.
CBMC from ten sensitized children with allergic symptoms and 6 non-sensitized children without allergic symptoms were added to allow assessment of gene expression of some selected genes (T-box expressed in T-cells (Tbx21), GATA binding protein 3 (GATA3), Forkhead box p3 (Foxp3), RAR-related orphan receptor C (RORC)) in relation to allergy development during childhood. Five of these 16 children were included in the original longitudinal study, i.e. they were followed to 6 years of age as described above (Fig 1). The other 11 children were participating in a randomized placebo-controlled allergy prevention study based on omega 3 long-chain polyunsaturated fatty acid supplementation during pregnancy.27 These 11 children were selected from the placebo group based on their
attendance to the clinical examination at 8 years of age and the availability of CBMC. One of these 11 children was followed up to 2 years only; this child was sensitized to egg and wheat and diagnosed with AB, AD and food allergy at 2 years of age. The clinical examinations were performed by a research nurse at 3, 6 and 12 months of age and by a paediatrician at 24 months and 8 years of age, with the clinical definitions described above. SPT was performed with egg, milk, wheat and cat (6, 12, 24 months), birch and timothy (24 months, 8 years) and mugwort, dog, cat, horse, Dermatophagoides pteronyssinus and farine, Cladosporium and Alternaria (8 years), as previously described.27 Circulating allergen specific IgE antibodies to egg, milk (3, 12, 24 months), wheat and cat (12 and 24 months) and birch and timothy-grass (24 months) was analyzed in serum samples.27 The SPT and the clinical follow ups were performed by the same research nurse for both study cohorts.
Taken together, 14 children who developed (described in detail in Table I), and 13 children who did not develop allergic symptoms and sensitization during childhood were included. All children with allergic symptoms showed SPT reactivity and sensitization according to the presence of allergen specific IgE antibodies in the circulation. All children without allergic symptoms were SPT negative and the levels of allergen specific IgE antibodies in the circulation were below the cut-off for positivity.
Collection and preparation of CBMC, PBMC and placenta samples
Venous blood samples were drawn into heparin-treated tubes (Vacuette, Greiner
Labortechnik, Kremsmünster, Austria). The cord blood samples were collected by cutting the umbilical cord at the placental site, carefully cleaning it to avoid contamination of maternal blood, and then squeezing it to collect the cord blood in heparin-treated tubes (Vacuette). The PBMC/CBMC were isolated and frozen as previously described,28, 29 with an exception for
the CBMC preparations; 2 volumes of RPMI-1640 (Life Technologies, Täby, Sweden) was added instead of 1 volume after plasma removal.
The placenta samples were collected at birth by cutting a cube, approximately 1x1x1 cm in size on the maternal side of the placenta, using a scalpel. The placental tissue was transferred to a sterile tube, frozen and stored at -70º C.
Seven PBMC and 6 paired placenta samples were collected from the allergic women together with 6 CBMC samples of whom 6 were paired with the PBMC samples and 5 with the
placenta samples. Nine PBMC and 11 placenta samples (8 paired) were collected from the non-allergic women, and 8 CBMC samples of whom 5 were paired with the PBMC samples and 6 with the placenta samples. Sixteen CBMC samples (of whom 1 also was analyzed by PCR array), without paired PBMC or placenta samples were also included for the additional quantification of CCL22, Tbx21, GATA3, Foxp3 and RORC using real-time PCR (Fig1).
RNA extraction
The PBMC and CBMC were rapidly thawed in a 37 º C water bath and immediately lysed using Buffer RLT (Qiagen, Hilden, Germany) supplemented with DL-dithiothreiol (DTT, Sigma, Stockholm, Sweden) and homogenized by vortex and vigorous pipetting. A piece, approximately 2x2x2 mm in size, of the inner part of the frozen placenta sample was
homogenized in Buffer RLT with DTT using Stainless Steel Beads, Tissue Lyser II (Qiagen) according to the manufacturer’s guidelines. The total RNA was isolated from the
homogenized cells/tissue using RNeasy® Mini Kit (Qiagen) including an on-column DNase treatment using RNase-Free DNase Set (Qiagen) according to the manufacturer’s
instructions, with the exception of the on-column DNase treatment where a double dose of DNase was used.
The concentration and purity of the RNA was assessed spectrophotometrically (ND-1000 NanoDrop Technologies Inc, Wilmington, Delaware, USA) and the RNA integrity was evaluated in the majority of the samples using the RNA 6000 Nano Labchip® Kit (Agilent Technologies, Palo Alto, CA, USA) on an Agilent 2100 Bioanalyzer (Agilent Technologies), according to the instructions provided by the manufacturer. The RNA Integrity number ranged between 7.7 – 9.3 for the CBMCs, 8.2 – 9.1 for the PBMCs and 5.7 – 7.2 for the placenta samples. One placenta sample from a non-allergic mother was excluded from further analyses due to low RNA concentration.
Reverse transcription PCR and real-time PCR
The RT2 First Strand Kit (Qiagen) was used for reverse transcription of 1 µg total RNA from the CBMC samples and 0.69 µg total RNA from the PBMC and placenta samples, according to the manufacturer’s instructions. Briefly, the RNA was treated with DNase at 42º C for 5 minutes (min) and then reversely transcribed into cDNA (42º C for 15 min followed by 95º C for 5 min) in a GeneAmp® PCR System 2700 (Applied Biosystems Foster City, CA, USA). The cDNA was mixed with RNase free water (Qiagen) and RT2 SYBR® Green Mastermix (Qiagen) containing HotStart DNA Taq Polymerase, SYBR Green dye and ROX reference dye, according to the guidelines provided by the manufacturer. Twenty-five µl of the reaction mix was transferred to a custom made RT2 Profiler PCR array (Qiagen) pre-coated with primers for the target genes. Two samples were assayed on the same plate, generating gene expression data from totally 48 genes (including housekeeping genes and controls) from each sample. The 7900HT Fast Real-Time PCR System (Applied Biosystems) was used for PCR amplification and the thermal cycle conditions were set with an initial step of 95º C for 10 min and then 40 cycles were run with 95º C for 15 seconds (s) and 60º C for 1 min, followed by a dissociation stage (95º C for 15 s, 60º C for 15 s, 95º C for 15 s). Baseline and threshold
values were adjusted manually (Sequence detection systems, SDS version 2.3, Applied Biosystems), and were always the same for all the PCR array runs. The detection limit was set to threshold cycle (Ct) 35 as recommended by the manufacturer, where only genes with Ct < 35 were regarded as detectable. A reverse transcription control, a positive control and a genomic DNA control were included in the assay. The reverse transcription control was below 5 for 43 of 47 samples and 5.1, 5.2, 5.3 and 5.9 respectively for the remaining 4 samples. The positive controls appeared between threshold cycle (Ct) 18.8 and 19.2 and the Ct for the genomic DNA control was >35 for all samples.
Forty genes (Table II) were selected to represent different immune modulatory pathways and immune cell function. The housekeeping genes (HKG) tyrosine
3-monooxygenase/tryptophan 5-monooxygenase activation protein, zeta polypeptide
(YWHAZ), ribosomal 18S RNA (rRNA) and the T-cell specific housekeeping gene CD3ε were used in this custom made RT2 Profiler PCR array. A separate dilution (210) of the samples was performed for rRNA detection only, due to the high expression of the rRNA in comparison to the target genes, thus making it possible to exclude as much background noise as possible.
The mRNA expression of CCL22, YWHAZ (placenta, PBMC, CBMC samples), the T-cell-associated transcription factors Tbx21, GATA3, Foxp3, RORC and CD3ε (CBMC samples) was also quantified separately, due to suspected primer-dimer formation for CCL22 on the PCR array, and due to additional analysis of the transcription factors in CBMCs using an extended material of children. The 7900HT Fast Real-Time PCR System was used with the following thermal cycling conditions: 50º C for 2 min followed by 95º C for 10 min and then 40 cycles with 95º C for 15 s and 60º C for 1 min. TaqMan Universal Master Mix (2x), with Uracil-N-Glycosylase (Applied Biosystems) was mixed with cDNA (1 µl for Tbx21,
primers and probes in a total volume of 20 µl. A positive and negative control was included on each plate. The samples were run in duplicates and the coefficient of variance was < 3% for all samples. TaqMan® Gene Expression assays were used for quantification of Tbx21 (Hs00203436_m1), RORC (Hs01076112_m1), CCL22 (Hs00171080_m1) and YWHAZ (Hs00237047_m1) whilst design of primers and 3’-FAM/5’-TAMRA-labelled probes for GATA3, Foxp3 and CD3ε was done in-house using Primer Express 3.0 (Applied
Biosystems). The sequences and the concentrations of the primers and probes are presented in appendix I. None of the primer-probe pairs or assay-mixes amplified genomic DNA,
evaluated by analyzing 3 samples of RNA.
YHWAZ was detected as the most stable HKG by Normfinder30 in GenEx software (MultiD Analyses/TATAA Biocenter, Gothenburg, Sweden) and was therefore used for normalization of the raw Ct values according to the comparative Ct method. ΔCt values were generated by subtraction of the Ct value of YWHAZ from the Ct value of the target gene. Similarly, CD3ε was used for normalization of genes mainly restricted to the CD3+ (T cell) compartment, i.e. Tbx21, GATA3, Foxp3, RORC and the cytokines IFN-γ and IL-5, in order to estimate gene expression in relation to the number of T-cells in the placenta tissue. (Edström et al., unpublished data). The mRNA levels of CD3ε were, as expected, increased in PBMC as compared to placental tissue (data not shown).
Statistics
The statistical package IBM SPSS Statistics 21.0 for Windows (SPSS Inc, Chicago, IL, USA) was used for statistical analysis. Non-parametric tests, corrected for ties, were used. A p-value below 0.05 was considered as significant. The probability level of p<0.05 was selected after careful consideration in order to compromise between type I and type II errors and the results were always interpreted with caution. Comparisons between the allergic and
non-allergic mothers/children were performed with the Mann-Whitney U-test. The Wilcoxon’s signed rank test was used to compare the levels of gene expression (ΔCt values) in the matched PBMC and placenta samples and Spearman’s rank order correlation coefficient for the correlations between placenta, PBMC and CBMC samples. The correlation analyses were performed when detectable gene expression levels were shown for at least 8 study
subjects/sample type, in order to decrease the number of comparisons. Only relationships with p < 0.001 are reported for the correlation analyses. Samples with Ct values >35 were given a ΔCt value of 16 for genes from the PCR array and a value of 9 for genes from the real-time PCR assays. The following genes were excluded from the PCR array, as the dissociation curves revealed two peaks, possibly representing primer-dimer formations: IL-25, p28, CCL22, SMAD family member 3 (SMAD3), Prostaglandin D2 synthase (PDGS) and CXCR3 (placenta samples only for CXCR3).
Ethics
The study was approved by the Regional Ethics Committee for Human Research at the University Hospital of Linköping (approval number: Dr 99184 and complementary Dr M98-06 and Dr 01-284 and complementary Dr M2M98-06-04).
Results
Characterization of gene expression locally and systemically during pregnancy
Increased gene expression of GATA3, IL-5, IL-10, IL-33, CCL18, epstein-barr virus induced 3 (EBI3), indoleamine 2,3-dioxygenase 1 (IDO1), triggering receptor expressed on myeloid cells 2 (TREM2) and p40 was observed in the placenta samples as compared with the PBMC samples (Fig 2). The 40 genes included in the PCR array (of whom CCL22 was quantified separately by a real-time PCR assay) with accompanying reference sequence number, description and the number of samples with detectable levels of the genes in the placenta, PBMCs and CBMCs are presented in Table II. The PBMCs expressed, compared with the placenta, higher levels of the CD3ε, lymphocyte-activation gene 3 (LAG3), signal transducer and activator of transcription 1 (STAT1), STAT4, STAT6, Tbx21, Foxp3, RORC, CCR4, glucocorticoid-induced TNF receptor-related protein (GITR), inducible T-cell co-stimulator (ICOS), cytotoxic T-lymphocyte-associated protein 4 (CTLA4), transforming growth factor-β1 (TGF-factor-β1), IFN-γ, p35 and CXCL10 genes (p<0.05 for all). The slight difference in RNA quality between the placenta and PBMC samples should be taken under consideration for genes with higher expression in PBMC than placenta, even though the differences in gene expression between the groups are extensive (median difference; ΔCt ≥ 2 for CD3ε, LAG3, STAT1, STAT4, STAT6, Tbx21, Foxp3, RORC, CCR4, GITR, ICOS, CTLA4, IFN-γ and p35, ΔCt=1.2 for CXCL10 and ΔCt=0.7 for TGFβ1).
Analysis of Tbx21, GATA3, Foxp3, RORC, IFN-γ and IL-5 expression in relation to the number of T-cells present in the samples (normalization using CD3ε) revealed increased mRNA expression of GATA3, IL-5 and Tbx21 in T-cells in the placenta (p<0.05) as compared to T-cells in the PBMC population. IFN-γ expression was higher in T-cells in peripheral blood than in the placenta (p=0.03) whilst expression of Foxp3 and RORC was similar in T-cells in placenta and PBMCs.
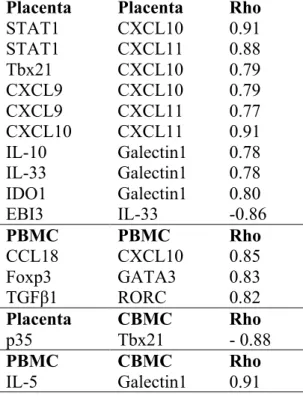
Correlations between mRNA expression in placenta, PBMC and CBMC The local and systemic gene expression during pregnancy were associated with the
offspring’s gene expression at birth. The IL-12/IL-35 associated subunit p35 in placenta was negatively associated with fetal expression of the Th1-like transcription factor Tbx21. In addition, the Th2-associated cytokine IL-5 in PBMCs was positively associated with fetal galectin1 expression (Table III).
The mRNA expression of the Th1-associated transcription factors STAT1 and Tbx21
correlated with the Th1-associated chemokines CXCL10 and CXCL11 (only with STAT1 for CXCL11) in placenta. Furthermore, the CXCL9, CXCL10 and CXCL11 expression
correlated with each other in placenta, whereas CXCL10 also correlated with the Th2-/anti-inflammatory-associated chemokine CCL18 in PBMC. Genes associated with Treg/anti-inflammatory immune responses were positively correlated with genes associated with Th2- and Th17-like immunity in PBMCs, i.e. Foxp3 correlated with GATA3 and TGFβ1 with RORC. In contrast, EBI3, with possible immune regulatory properties, correlated negatively with Th2-associated IL-33 in the placenta. Placental galectin1 correlated positively with placental IDO1, IL-10 and IL-33 (Table III).
Gene expression in placenta, PBMCs and CBMCs in relation to allergy in mother and child
Allergic women showed higher expression of p40 in placenta (p=0.01), p35 in PBMCs (p=0.02) and p35 in CBMCs (p=0.01) than non-allergic women. ΔCt values (median, range) for all genes in the placenta, PBMC and CBMC samples from allergic and non-allergic women are presented in Appendix II.
T-cell-associated gene expression (as normalized by using CD3ε) of the CBMC population showed increased GATA3 (Th2) and RORC (Th17) expression, respectively, in children who
developed allergy (n=4) as compared with children who did not (n=5, p=0.01 for both comparisons). Therefore, the transcription factors Tbx21, GATA3, Foxp3 and RORC (associated with Th1-, Th2-, Treg-, Th17-immunity, respectively) and the Th2-associated chemokine CCL22 were selected for additional analysis of mRNA expression in CBMCs in an extended material of children developing allergy (n=13) or not (n=11). CCL22 was selected due to our previous finding of increased CB CCL22 protein levels preceding allergy development.21, 23 Corroborating our previous results, increased gene expression of CCL22
was observed already at birth in children later developing allergy as compared with children who did not (Fig 3). Gene expression of the 4 transcription factors (Tbx21, GATA3, Foxp3 and RORC) was not related to allergy development in the extended cohort.
Gene expression in CBMCs was analyzed with gender as a potential confounding factor (Mann-Whitney U-test) for the initial and extended groups. Girls had a higher expression of IL-13 at birth than boys (p=0.03).
Discussion
The present study indicates a transcription profile dominated by Th2- and anti-inflammatory genes in the placenta, as compared with maternal PBMCs, irrespectively of maternal allergy, and an interplay between genes expressed locally and systemically during pregnancy and the fetal immunity at birth. The inverse relationship between placental p35 and fetal Tbx21 possibly indicates suppressive properties of placental p35, speculatively by IL-35, on the fetal Th1-like immunity. p35 can pair with p40 and EBI3, forming either pro-inflammatory IL-12(p70) or anti-inflammatory IL-35, but none of these subunits were correlated with fetal Tbx21 or placental p35 expression. One should keep in mind that the p35 protein is thought to be secreted with a partner and exerts its biological activities as a heterodimer.31 In addition, the maternal systemic IL-5 expression during pregnancy was associated with fetal gene expression as well, as it correlated with fetal galectin1. Galectin1 is, besides being a β-galactosidase binding protein, suggested to be important for immune regulation including apoptosis and immune suppression,32 but also for tissue remodelling including placenta development and angiogenesis.33 Even though mRNA levels do not necessarily reflect protein levels in various tissues, our data suggest that immunological mediators in the local and systemic environment during gestation associate with fetal Th1 immunity and possibly enhance the fetal immune regulatory capacity, pointing to a role of the immunological milieu for fetal immune development. Thus, the assumed global Th2-bias in all newborns34 might result from immune regulatory mechanisms in combination with exposure to a strong Th2 environment in utero.
The gene expression profile in the placenta indicated a Th2-deviated and anti-inflammatory environment in utero, based on increased mRNA expression of GATA3, IL-5, IL-10, IL-33, CCL18, EBI3, IDO1, TREM2 and p40 in the placenta as compared with gene expression peripherally, in PBMC. Placenta tissue comprises several cell populations with the capacity
to express and secrete immunological mediators, such as fibroblasts, smooth muscle cells, endothelial cells, cyto- and syncytiotrophoblast cells and immune cells, and the composition could influence the results if the proportions differ across samples. On the other hand, gene expression analysis on a mixture of cells is more likely to reflect the unique immunological environment in the tissue, rather than analysis of an isolated cell type. This Th2-/anti-inflammatory environment in the placenta tissue (as compared with maternal PBMCs), including cells of fetal origin, has not, to the best of our knowledge, been described before. A Th2-dominant milieu in the placenta, as compared with maternal PBMCs, was confirmed by studying the mRNA expression of the cell-associated genes in relation to the number of T-cells in the samples (as obtained by a T-cell-normalization procedure). T-T-cells in the placenta expressed extensively higher mRNA levels of GATA3 and IL-5, slightly higher levels of Tbx21, but lower levels of IFN-γ, than T-cells in the circulation. The elevated Tbx21 expression was surprising, but the non-accompanying IFN-γ expression probably excludes the assumption of an accumulation of Th1 cells in the placenta. Although Tbx21, GATA3, Foxp3, RORC, IFN-γ and IL-5 expression are mainly T-cell-associated, the observed differences in gene expression when using YWHAZ and CD3ε for normalization, indicate that other cells than T-cells contribute to the expression of these genes. The co-stimulatory molecule ICOS, extensively expressed on activated T-cells, was detectable in only 1 of 16 placenta samples, while it was detected in all PBMC and CBMC samples, indicating a naïve phenotype of T-cells in the placenta. Taken together, our gene expression data potentially indicate a Th2- and anti-inflammatory dominant immune milieu in the placenta, as well as a naïve T-cell phenotype, as compared with maternal gene expression in the circulation. This immune milieu is probably generated by an extensive network of different cell types. When looking at co-expression of gene sets within the placenta, the Th1-associated genes Tbx21, STAT1, CXCL9, CXCL10 and CXCL11 correlated strongly and expectedly with
each other, in agreement with our previous observation of positive correlations between circulating CXCL9, CXCL10 and CXCL11 levels during and after pregnancy (unpublished data). EBI3 showed a reciprocal relationship with the Th2-associated cytokine IL-33, indicating possible suppressive properties of either IL-27 or IL-35 on IL-33 expression. Galectin1 and IDO1 are, among many other hormonal and immunological factors, considered to be important for maintaining maternal-fetal tolerance,35 and their mRNA expression in placenta appears to be positively related to each other. Furthermore, placental galectin1 expression was associated with expression of the anti-inflammatory cytokine IL-10 and the Th2-associated cytokine IL-33, possibly indicating that markers associated with Th2- and anti-inflammatory immunity are co-regulated.
In PBMCs, the Treg-associated genes Foxp3, TGFβ1 and CCL1836 were positively correlated both with the Th1-associated CXCL10, the Th2-associated GATA3 as well as the Th17-associated RORC genes. This situation could be interpreted as a balance between the
different arms of T-cell immunology, where regulatory immune responses are upregulated to control Th1-, Th2-, and Th17-like immune responses. On the other hand, Treg and Th17 differentiation overlap, with TGFβ as a shared inductive factor together with IL-2 for Treg differentiation and IL-1β, IL-6, IL-21 and IL-23 for differentiation and expansion of Th17 cells in humans, reviewed in.37 We acknowledge the limitation of studying gene expression, as mRNA levels do not properly reflect protein levels. The probability level of p<0.001 was selected for the correlation analyses after careful consideration, as an approach to adjust for the multiple correlation analyses, i.e. to reduce the frequency of type II errors. The results were always interpreted with caution, but we cannot completely exclude the possibility of reported false positive findings.
An enhanced placental Th2-shift of allergic mothers has been suggested to explain the higher risk for allergy development in children of allergic mothers versus fathers.19, 20 The present
study was not able to confirm such a relationship by studying mRNA expression in the placenta, but one should keep in mind that many important Th2 markers (IL-4, IL-9, IL-13, CCL11, CCL17, CCL22) were undetectable in the majority of samples. Thus, expression of Th2-associated genes could be increased in allergic women, but due to methodological limitations, impossible to detect. Expression of genes associated with Th2- and regulatory immune responses were increased in the placenta as compared with PBMC, regardless of the allergic status of the mother, suggesting that a strict immune regulation may be essential to prevent pregnancy complications. Maternal allergy was associated with increased expression of p40 in placenta and p35 in PBMCs and CBMCs, reflecting either increased
pro-inflammatory- (IL-12, IL-23) or regulatory (IL-35) immune responses. The subunit p40 exists as monomers and homodimers and interacts with the IL-12 receptor without mediating any biological effects,38, 39 leading to the speculation of an enhanced ability of allergic mothers to
dampen Th1 responses in the placenta during late phase of pregnancy.
Allergy development during childhood was preceded by increased expression of the Th2-associated chemokine CCL22 at birth, indicating that the Th2-skewed immunity Th2-associated with allergic disease is established very early in life. This observation is in line with previous findings in this study cohort, as the protein levels of CCL22 were increased in CB plasma in children developing allergic symptoms and sensitization.21, 23 Furthermore, chemokine levels at birth and during childhood were associated with maternal chemokine levels at various time points during pregnancy, supporting an interplay between maternal and fetal immunity.40 More studies on the fetal immunity at birth in relation to prenatal allergy development, using other markers for Th1-, Th2-, Treg- and Th17-immunity, would be most welcome and constitute a valuable addition to this area of research.
In summary, placental gene expression, including cells of fetal origin, was dominated by a Th2- and anti-inflammatory transcription profile, as compared with gene expression in the
maternal circulation, regardless of maternal allergy, supporting the idea of a local Th2- and anti-inflammatory environment in utero. Gene expression locally and systemically during pregnancy partly correlated with the offspring’s gene expression at birth, indicating that the immunological milieu during gestation might be important for fetal immune development. An enhanced Th2-deviation at birth was related to allergy development in the offspring whilst the Th1/Th2-balance was similar during late-stage-pregnancy in allergic and non-allergic women.
Appendix I. Sequences and concentrations of primers and probes Target gene Primer/ Probe Sequence (5’-3’) Conc. (nM)
GATA3 Forward CAAAATGAACGGACAGAACCG 50
Probe CCCCTCATTAAGCCCAAGCGAAGG 125
Reverse GCTCTCCTGGCTGCAGACA 50
Foxp3 Forward GTGGCCCGGATGTGAGAA 300
Probe CCTCAAGCACTGCCAGGCGGAC 200
Reverse GCTGCTCCAGAGACTGTACCATCT 900
CD3ε Forward GGCGGCAGGCAAAGG 300
Probe AGAGGCCACCACCTGTTCCCAACC 100
Reverse TCCGGATGGGCTCATAGTCT 50
One exon-exon boundary (marked in bold above) was included in the mRNA amplicons for GATA3, Foxp3 and CD3ε, to guarantee assay specificity for mRNA detection.
Appendix II. Gene expression (ΔCt, median, range) of 40 genes in placenta, PBMCs at gw 39 and CBMCs in allergic and non-allergic mothers
Gene symbol Allergic Placenta Non-allergic Placenta Allergic PBMC Non-allergic PBMC Allergic CBMC Non-allergic CBMC Th1-associated genes IFN-γ 16 (16-10.9) 16 (16-7.5) 7.5 (8.3-6.1) 7.9 (8.7-6.7) 7.1 (7.8-6.1) 7.7 (8.9-5.8) CXCL9 9.6 (11-7.6) 7.5 (16-1.2) 8.5 (9.6-7.1) 9.1 (10.1-8.5) 13.7 (16-9.5) 11.3 (16-8.6) CXCL10 8.4 (9.4-5.4) 7.5 (9.2-1.8) 5.8 (7.5-2.8) 6.9 (8.6-3.7) 13 (16-9.2) 10.5 (16-8.6) CXCL11 9.6 (16-5.4) 8 (11.2-4.6) 10.6 (11.8-9.1) 10.3 (11.8-9.7) 16 (16-11.9) 16 (16-16) CXCR3 ψ ψ 7.5 (8.3-6.8) 7.4 (8.4-6.2) 7.5 (8.1-6.9) 7.4 (9.6-6.9) Tbx21 10.3 (16-9) 9.5 (11-7.8) 3.6 (4.8-3.4) 4.4 (4.6-3.1) 4 (4.9-3.6) 4.5 (6.2-3.5) STAT1 4.4 (5-2.4) 4 (4.7-2.7) 1 (1.5-0.6) 0.9 (2-0.7) 3.7 (4.8-3.1) 4.4 (4.8-3) STAT4 6.7 (8.8-6.2) 6.9 (8.2-6.1) 4 (4.8-3.7) 4.8 (5.3-3.9) 4.4 (5.2-3) 3.9 (5.4-3.1) Th2-associated genes IL-4 16 (16-16) 16 (16-11.2) 16 (16-16) 16 (16-12.7) 16 (16-16) 16 (16-16) IL-5 9.8 (10.4-8.8) 9.7 (11.2-8.7) 11.6 (16-10) 11.1 (16-10.4) 13.7 (16-10.4) 16 (16-10.1) IL-9 16 (16-16) 16 (16-11.2) 16 (16-11.7) 16 (16-16) 16 (16-16) 16 (16-12.3) IL-13 16 (16-16) 16 (16-12) 16 (16-12) 16 (16-12.5) 12.5 (16-10.5) 12.4 (16-9.8) IL-25 ψ ψ ψ ψ ψ ψ IL-33 5.3 (6.1-3.6) 5.4 (6.2-3.3) 16 (16-16) 16 (16-16) 16 (16-16) 16 (16-16) TSLP 11.8 (16-9.4) 13.8 (16-9.4) 12.5 (16-11.6) 16 (16-11.6) 16 (16-16) 16 (16-16) CCL11 16 (16-16) 16 (16-10.9) 16 (16-16) 16 (16-16) 16 (16-16) 16 (16-16) CCL17 16 (16-11.6) 14.2 (16-10.3) 16 (16-12.6) 16 (16-12.3) 16 (16-12.5) 16 (16-12.2) CCL18 8.7 (10-6) 7.3 (10.6-4.2) 12.4 (16-9.9) 16 (16-9.9) 16 (16-9.3) 12.1 (16-9.8) CCL22 9 (9-9) 9 (9- 2.4) 9 (9-9) 9 (9-9) 9 (9-2.1) 9 (9-3.2) CCR4 11 (16-9.7) 16 (16-8.8) 6 (6.3-5.3) 5.9 (7.5-5) 6 (6.8-4.4) 5.7 (6.2-4.4) GATA3 4.2 (3.7-5.5) 4.7 (5.3-3.9) 7.2 (8.8-6.5) 7.5 (8.4-6.3) 6.7 (9.9-6.2) 7.3 (8.2-6.5) STAT6 4.1 (4.4-3.2) 4.5 (4.9-3.7) 2.4 (3.1-1.1) 2.5 (3.4-1.9) 2.9 (4.7-1.5) 3.5 (4.3-2.1) Treg-associated genes IL-10 7.7 (10-6.9) 7.4 (9.4-6.3) 9.9 (10.6-9.8) 10 (11.7-7.9) 7.7 (8.6-6.5) 7.5 (8.8-5.5) TGFβ1 2.1 (3.4-1.1) 1.9 (3.3-0.9) 1.3 (1.9-0.4) 1.3 (1.7-0.9) 1.1 (1.8-0.5) 1.4 (2.7-0.6) Smad3 ψ ψ ψ ψ ψ ψ Foxp3 16 (16-10.8) 11.5 (16-10) 9.1 (11.3-8.4) 9.1 (10.7-7.8) 9.5 (10.5-7.4) 10.3 (16-9.1) Th17-associated genes IL-17A 16 (16-16) 16 (16-16) 16 (16-16) 16 (16-16) 16 (16-16) 16 (16-16) RORC 12.3 (16-10.4) 11.7 (16-10.4) 8.3 (9.8-7.4) 8.3 (9.1-7.5) 10 (12.3-9.2) 10.7 (16-9.4) Immune modulation Galectin1 1.3 (2-0) 0.8 (2- -0.9) 0.9 (1.3- -0.7) 0.9 (1.9-0.5) 1.1 (2.4- -0.3) 0.8 (1.5- -0.2) TREM2 9.2 (10.1-8.7) 8.8 (10.1-8) 12.8 (16-11.5) 13.2 (16-11.5) 16 (16-16) 16 (16-16) PGDS ψ ψ ψ ψ ψ ψ IL-12 family p=0.01 p=0.02 p=0.01 p35 11.9 (16-10.2) 11 (16-9.8) 8.8 (9.6-8.1) 9.3 (10.2-9) 9.2 (9.4-8.4) 9.7 (10.2-8.9) p40 10.1 (10.8-9.1) 11.4 (16-9.6) 13.6 (16-10.9) 12.9 (16-9.7) 16 (16-11.5) 14.4 (16-9.4) p28 ψ ψ ψ ψ ψ ψ EBI3 -0.1 (2- -0.6) -0.1 (1.2- -0.6) 16 (16-13.1) 16 (16-12.9) 16 (16-16) 16 (16-16) Activation/Suppression ICOS 16 (16-16) 16 (16-9.9) 7.3 (7.9-6.6) 7.2 (9-6.2) 5.7 (7.3-4.8) 6.4 (6.8-4.9) GITR 8 (10.3-7.4) 8.8 (9.5-6.8) 6 (6.8-5.6) 6.7 (7.7-5.6) 5.1 (6.6-4.1) 5.4 (6.5-3.9) LAG3 14 (16-10.3) 10.7 (16-6.4) 6.6 (7.9-6.3) 7.1 (8.7-6.1) 10.6 (16-9.7) 13.9 (16-9.8) IDO1 4.1 (4.7-2.3) 3.6 (4.4-3) 9.9 (10.8-9.2) 10.2 (11.8-9.3) 16 (16-16) 16 (16-16) CTLA4 13.8 (16-10.4) 10.6 (16-8.4) 7.4 (8.2-6.5) 7.1 (8.8-6.4) 7.1 (8.4-6.7) 7.7 (8.4-6.2)
Samples with Ct >35 were given a ΔCt value of 16 for genes from the PCR array and 9 for genes from the real-time PCR assays (CCL22). Statistically significant differences in gene expression between allergic and non-allergic women are indicated in bold.ψ = Excluded due to suspected primer-dimer formation. CBMC = cord blood mononuclear cells, Ct = threshold cycle, PBMC = peripheral blood mononuclear cells
Appendix III. Gene expression (ΔCt, median, range) of six T-cell associated genes in placenta, PBMCs at gw 39 and CBMCs normalized using CD3ε in allergic and non-allergic mothers
Gene symbol Allergic Placenta Non-allergic Placenta Allergic PBMC Non-allergic PBMC Allergic CBMC Non-allergic CBMC Tbx21 0.5 (16- -0.6) 0.5 (2.4- -0.9) 2.2 (4.2-2) 2.8 (3.4-1.2) 2.6 (3.9-0.7) 2.4 (4.5-0.9) GATA3 -4.8 (-4- -6.7) -4.5 (-1- -5.5) 6.1 (7.3-5.4) 6.1 (6.7-5.7) 5.6 (7.5-3.3) 5.3 (6.9-3.5) Foxp3 16 (16-0.4) 2.8 (16-0.9) 8.2 (9.8-6.9) 7.7 (8.8-7.2) 7.3 (9.2-6.6) 7.9 (16-7.2) RORC 2.7 (16-0.7) 3.3 (16-1) 6.9 (8.7-6) 6.7 (7.9-6.2) 8.8 (9.7-6.3) 8.9 (16-6.9) IFN-γ 16 (16-1.4) 16 (16- -1.1) 6 (7.8-4.9) 6.4 (7.7-5.4) 5.3 (6.5-3.8) 6 (6.6-3.1) IL-5 0.5 (1- -0.7) 1.1 (3.9- -0.9) 9.9 (16-9.1) 9.9 (16-8.1) 13.3 (16-8.7) 16 (16-8.7)
Samples with Ct >35 were given a ΔCt value of 16. CBMC = cord blood mononuclear cells, Ct = threshold cycle, PBMC = peripheral blood mononuclear cells
Acknowledgement
We are grateful to all families participating in this study. Thanks to the midwives at the maternity health care clinic and the staff in the delivery room for the collection of samples. We acknowledge Anne-Marie Fornander, research nurses Lena Lindell and Kicki Helander for excellent technical assistance and Karl Wahlin, Department of Computer and Information Science, Linköping University, Sweden, for statistical guidance. We also thank Anne
Lahdenperä and Linda Åkerman, Department of Clinical and Experimental Medicine,
Linköping University, and Udo Markert, Department of Obstetrics, University Hospital Jena, Germany, for advice and valuable discussions. This study was supported financially by the Swedish Research Council (project 73X-15335-01A and 74X-20146-01-2), the National Swedish Association against Allergic Diseases, the National Heart and Lung Association, the Vårdal Foundation - for Health Care Sciences and Allergy Research, Olle Engkvist
Foundation, the Cancer and Allergy Association, Samariten Foundation, Queen Silvia
Research Foundation, Ellen, Walter and Lennart Hesselmans foundation, the County Council of Östergötland and the Boehringer Ingelheim Fonds (travel grant to Jena for MA).
References
1 Wegmann TG, Lin H, Guilbert L, Mosmann TR: Bidirectional cytokine interactions in the maternal-fetal relationship: is successful pregnancy a TH2 phenomenon? Immunol Today 1993;14:353-356.
2 Gould HJ, Sutton BJ, Beavil AJ, Beavil RL, McCloskey N, Coker HA, Fear D, Smurthwaite L: The biology of IGE and the basis of allergic disease. Annu Rev Immunol 2003;21:579-628.
3 Robinson DS, Hamid Q, Ying S, Tsicopoulos A, Barkans J, Bentley AM, Corrigan C, Durham SR, Kay AB: Predominant TH2-like bronchoalveolar T-lymphocyte
population in atopic asthma. N Engl J Med 1992;326:298-304.
4 Mazzarella G, Bianco A, Catena E, De Palma R, Abbate GF: Th1/Th2 lymphocyte polarization in asthma. Allergy 2000;55 Suppl 61:6-9.
5 Somoskovi A, Bartfai Z, Tamasi L, Kocsis J, Puho E, Czeizel AE: Population-based case-control study of allergic rhinitis during pregnancy for birth outcomes. Eur J Obstet Gynecol Reprod Biol 2007;131:21-27.
6 Schaub B, Liu J, Hoppler S, Haug S, Sattler C, Lluis A, Illi S, von Mutius E: Impairment of T-regulatory cells in cord blood of atopic mothers. J Allergy Clin Immunol 2008;121:1491-1499, 1499 e1491-1413.
7 Tedner SG, Ortqvist AK, Almqvist C: Fetal growth and risk of childhood asthma and allergic disease. Clin Exp Allergy 2012;42:1430-1447.
8 Savilahti E, Siltanen M, Pekkanen J, Kajosaari M: Mothers of very low birth weight infants have less atopy than mothers of full-term infants. Clin Exp Allergy
9 Westergaard T, Begtrup K, Rostgaard K, Krause TG, Benn CS, Melbye M: Reproductive history and allergic rhinitis among 31145 Danish women. Clin Exp Allergy 2003;33:301-305.
10 Woidacki K, Zenclussen AC, Siebenhaar F: Mast cell-mediated and associated disorders in pregnancy: a risky game with an uncertain outcome? Frontiers in immunology 2014;5:231.
11 Sandberg M, Frykman A, Jonsson Y, Persson M, Ernerudh J, Berg G, Matthiesen L, Ekerfelt C, Jenmalm MC: Total and allergen-specific IgE levels during and after pregnancy in relation to maternal allergy. J Reprod Immunol 2009;81:82-88. 12 Breckler LA, Hale J, Taylor A, Dunstan JA, Thornton CA, Prescott SL: Pregnancy
IFN-gamma responses to foetal alloantigens are altered by maternal allergy and gravidity status. Allergy 2008;63:1473-1480.
13 Prescott SL, Breckler LA, Witt CS, Smith L, Dunstan JA, Christiansen FT: Allergic women show reduced T helper type 1 alloresponses to fetal human leucocyte antigen mismatch during pregnancy. Clin Exp Immunol 2010;159:65-72.
14 Persson M, Ekerfelt C, Ernerudh J, Matthiesen L, Abelius MS, Jonsson Y, Berg G, Jenmalm MC: Reduced IFN-gamma and IL-10 responses to paternal antigens during and after pregnancy in allergic women. J Reprod Immunol 2012;95:50-58.
15 Breckler LA, Hale J, Jung W, Westcott L, Dunstan JA, Thornton CA, Prescott SL: Modulation of in vivo and in vitro cytokine production over the course of pregnancy in allergic and non-allergic mothers. Pediatr Allergy Immunol 2010;21:14-21.
16 Jenmalm MC: Childhood immune maturation and allergy development: regulation by maternal immunity and microbial exposure. Am J Reprod Immunol 2011;66 Suppl 1:75-80.
17 Magnusson CG: Cord serum IgE in relation to family history and as predictor of atopic disease in early infancy. Allergy 1988;43:241-251.
18 Johnson CC, Ownby DR, Peterson EL: Parental history of atopic disease and concentration of cord blood IgE. Clin Exp Allergy 1996;26:624-629.
19 Liu CA, Wang CL, Chuang H, Ou CY, Hsu TY, Yang KD: Prenatal prediction of infant atopy by maternal but not paternal total IgE levels. J Allergy Clin Immunol 2003;112:899-904.
20 Lim RH, Kobzik L, Dahl M: Risk for asthma in offspring of asthmatic mothers versus fathers: a meta-analysis. PloS one 2010;5:e10134.
21 Sandberg M, Frykman A, Ernerudh J, Berg G, Matthiesen L, Ekerfelt C, Nilsson LJ, Jenmalm MC: Cord blood cytokines and chemokines and development of allergic disease. Pediatr Allergy Immunol2009;20:519-527.
22 Herberth G, Hinz D, Roder S, Schlink U, Sack U, Diez U, Borte M, Lehmann I: Maternal immune status in pregnancy is related to offspring's immune responses and atopy risk. Allergy 2011;66:1065-1074.
23 Abelius MS, Ernerudh J, Berg G, Matthiesen L, Nilsson LJ, Jenmalm MC: High cord blood levels of the T-helper 2-associated chemokines CCL17 and CCL22 precede allergy development during the first 6 years of life. Pediatr Res 2011;70:495-500. 24 Abrahamsson TR, Sandberg Abelius M, Forsberg A, Bjorksten B, Jenmalm MC: A
Th1/Th2-associated chemokine imbalance during infancy in children developing eczema, wheeze and sensitization. Clin Exp Allergy 2011;41:1729-1739.
25 Miyahara H, Okazaki N, Nagakura T, Korematsu S, Izumi T: Elevated umbilical cord serum TARC/CCL17 levels predict the development of atopic dermatitis in infancy. Clin Exp Allergy 2011;41:186-191.
26 Leung TF, Ng PC, Tam WH, Li CY, Wong E, Ma TP, Lam CW, Fok TF: Helper T-lymphocyte-related chemokines in healthy newborns. Pediatr Res 2004;55:334-338. 27 Furuhjelm C, Warstedt K, Fageras M, Falth-Magnusson K, Larsson J, Fredriksson M,
Duchen K: Allergic disease in infants up to 2 years of age in relation to plasma omega-3 fatty acids and maternal fish oil supplementation in pregnancy and lactation. Pediatr Allergy Immunol 2011;22:505-514.
28 Persson M, Ekerfelt C, Ernerudh J, Matthiesen L, Jenmalm M, Jonsson Y, Sandberg M, Berg G: Increased circulating paternal antigen-specific IFN-gamma- and IL-4-secreting cells during pregnancy in allergic and non-allergic women. J Reprod Immunol 2008;79:70-78.
29 Jenmalm MC, Aniansson-Zdolsek H, Holt PG, Bjorksten B: Expression of and responses to CD2 and CD3 in 18-month-old children with and without atopic dermatitis. Pediatr Allergy Immunol 2000;11:175-182.
30 Andersen CL, Jensen JL, Orntoft TF: Normalization of real-time quantitative reverse transcription-PCR data: a model-based variance estimation approach to identify genes suited for normalization, applied to bladder and colon cancer data sets. Cancer
research 2004;64:5245-5250.
31 Vignali DA, Kuchroo VK: IL-12 family cytokines: immunological playmakers. Nat Immunol 2012;13:722-728.
32 Cedeno-Laurent F, Dimitroff CJ: Galectin-1 research in T cell immunity: past, present and future. Clinical immunology 2012;142:107-116.
33 Barrientos G, Freitag N, Tirado-Gonzalez I, Unverdorben L, Jeschke U, Thijssen VL, Blois SM: Involvement of galectin-1 in reproduction: past, present and future. Hum Reprod Update 2013;20:175-193.
34 Dowling DJ, Levy O: Ontogeny of early life immunity. Trends Immunol 2014;35:299-310.
35 Terness P, Kallikourdis M, Betz AG, Rabinovich GA, Saito S, Clark DA: Tolerance signaling molecules and pregnancy: IDO, galectins, and the renaissance of regulatory T cells. Am J Reprod Immunol 2007;58:238-254.
36 van Lieshout AW, van der Voort R, le Blanc LM, Roelofs MF, Schreurs BW, van Riel PL, Adema GJ, Radstake TR: Novel insights in the regulation of CCL18 secretion by monocytes and dendritic cells via cytokines, toll-like receptors and rheumatoid synovial fluid. BMC Immunol 2006;7:23.
37 Maddur MS, Miossec P, Kaveri SV, Bayry J: Th17 cells: biology, pathogenesis of autoimmune and inflammatory diseases, and therapeutic strategies. Am J Pathol 2012;181:8-18.
38 Klinke DJ, 2nd: The ratio of P40 monomer to dimer is an important determinant of IL-12 bioactivity. Journal of theoretical biology 2006;240:323-335.
39 Ling P, Gately MK, Gubler U, Stern AS, Lin P, Hollfelder K, Su C, Pan YC, Hakimi J: Human IL-12 p40 homodimer binds to the IL-12 receptor but does not mediate biologic activity. J Immunol 1995;154:116-127.
40 Abelius MS, Lempinen E, Lindblad K, Ernerudh J, Berg G, Matthiesen L, Nilsson LJ, Jenmalm MC: Th2-like chemokine levels are increased in allergic children and
influenced by maternal immunity during pregnancy. Pediatr Allergy Immunol 2014;25:387-393.
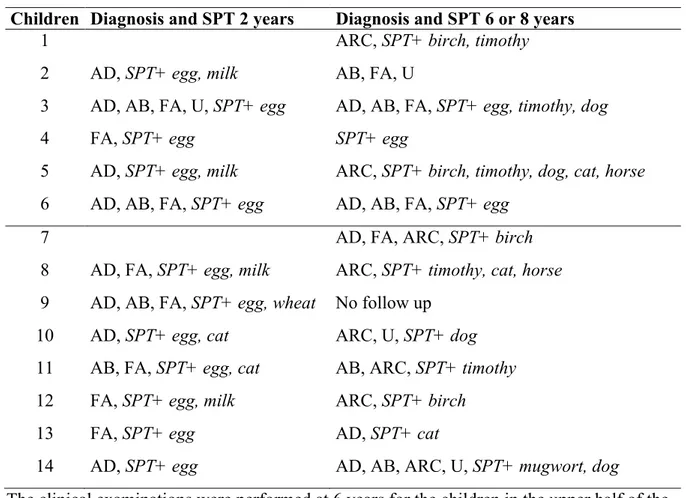
Table I. Diagnosis and SPT reactivity at 2 and 6/8 years of age in the 14 children developing allergy and allergic sensitization
Children Diagnosis and SPT 2 years Diagnosis and SPT 6 or 8 years
1 ARC, SPT+ birch, timothy
2 AD, SPT+ egg, milk AB, FA, U
3 AD, AB, FA, U, SPT+ egg AD, AB, FA, SPT+ egg, timothy, dog
4 FA, SPT+ egg SPT+ egg
5 AD, SPT+ egg, milk ARC, SPT+ birch, timothy, dog, cat, horse 6 AD, AB, FA, SPT+ egg AD, AB, FA, SPT+ egg
7 AD, FA, ARC, SPT+ birch
8 AD, FA, SPT+ egg, milk ARC, SPT+ timothy, cat, horse 9 AD, AB, FA, SPT+ egg, wheat No follow up
10 AD, SPT+ egg, cat ARC, U, SPT+ dog 11 AB, FA, SPT+ egg, cat AB, ARC, SPT+ timothy 12 FA, SPT+ egg, milk ARC, SPT+ birch
13 FA, SPT+ egg AD, SPT+ cat
14 AD, SPT+ egg AD, AB, ARC, U, SPT+ mugwort, dog The clinical examinations were performed at 6 years for the children in the upper half of the table (number 1-6) and at 8 years of age for the children in the lower half, (number 7-14). All children with positive SPT were also sensitized according to the presence of allergen specific IgE antibodies in the circulation. Definition of abbreviations: AD = atopic dermatitis, AB = asthma bronchiale, ARC = allergic rhinoconjunctivitis, U = urticaria, FA = Food Allergy, SPT = skin prick test.
Table II. Gene expression analysis of 40 genes in placenta, PBMCs at gw 39 and CBMCs Gene
symbol Refseq # Description Placenta Pos* PBMC Pos* CBMC Pos* Th1-associated genes
IFN-γ NM_000619 Interferon-γ 6/16 16/16 15/15
CXCL9 NM_002416 Chemokine (C-X-C motif) ligand 9 15/16 16/16 9/15 CXCL10 NM_001565 Chemokine (C-X-C motif) ligand 10 16/16 16/16 10/15 CXCL11 NM_005409 Chemokine (C-X-C motif) ligand 11 15/16 16/16 1/15 CXCR3 NM_001504 Chemokine (C-X-C motif) receptor 3 ψ 16/16 15/15
Tbx21 NM_013351 T-box expressed in T-cells 15/16 16/16 15/15
STAT1 NM_007315 Signal transducer and activator of transcription 1 16/16 16/16 15/15 STAT4 NM_003151 Signal transducer and activator of transcription 4 16/16 16/16 15/15 Th2-associated genes IL-4 NM_000589 Interleukin 4 2/16 2/16 0/15 IL-5 NM_000879 Interleukin 5 16/16 13/16 6/15 IL-9 NM_000590 Interleukin 9 2/16 1/16 1/15 IL-13 NM_002188 Interleukin 13 1/16 4/16 11/15 IL-25 NM_022789 Interleukin 25 ψ ψ ψ IL-33 NM_033439 Interleukin 33 16/16 0/16 0/15
TSLP NM_033035 Thymic stromal lymphopoietin 10/16 8/16 0/15
CCL11 NM_002986 Chemokine (C-C motif) ligand 11 4/16 0/16 0/15 CCL17 NM_002987 Chemokine (C-C motif) ligand 17 7/16 4/16 4/15 CCL18 NM_002988 Chemokine (C-C motif) ligand 18ϕ 16/16 8/16 8/15 CCL22 NM_002990 Chemokine (C-C motif) ligand 22 1/16 0/15 6/15 CCR4 NM_005508 Chemokine (C-C motif) receptor 4 9/16 16/16 15/15
GATA3 NM_002051 GATA binding protein 3 16/16 16/16 15/15
STAT6 NM_003153 Signal transducer and activator of transcription 6 16/16 16/16 15/15 Treg-associated genes
IL-10 NM_000572 Interleukin 10ϕ 16/16 16/16 15/15
TGFβ1 NM_000660 Transforming growth factor-β1ϕ 16/16 16/16 15/15
Smad3 NM_005902 SMAD family member 3ϕ ψ ψ ψ
Foxp3 NM_014009 Forkhead box P3ϕ 11/16 16/16 13/15
Th17-associated genes
IL-17A NM_002190 Interleukin 17A 0/16 0/16 0/15
RORC NM_005060 RAR-related orphan receptor C 11/16 16/16 13/15 Immune modulation
Galectin1 NM_002305 Lectin, galactoside-binding, soluble, 1ϕ 16/16 16/16 15/15 TREM2 NM_018965 Triggering receptor expressed on myeloid cells 2 16/16 12/16 0/15 PGDS NM_014485 Prostaglandin D2 synthase, hematopoietic ψ ψ ψ
IL-12 family
p35 NM_000882 Interleukin 12A 11/16 16/16 15/15
p40 NM_002187 Interleukin 12B 14/16 10/16 6/15
p28 NM_145659 Interleukin 27 ψ ψ ψ
EBI3 NM_005755 Epstein-Barr virus induced 3ϕ 16/16 4/16 0/15
Activation/Suppression
ICOS NM_012092 Inducible T-cell co-stimulator 1/16 16/16 15/15 GITR NM_004195 Glucocorticoid-induced TNF receptor-related protein 16/16 16/16 15/15
LAG3 NM_002286 Lymphocyte-activation gene 3 11/16 16/16 10/15
IDO1 NM_002164 Indoleamine 2,3-dioxygenase 1ϕ 16/16 16/16 0/16 CTLA4 NM_005214 Cytotoxic T-lymphocyte-associated protein 4ϕ 12/16 16/16 15/15
* = Ct < 35, ϕ=mostly associated with anti-inflammatory functions, ψ = This gene was excluded due to suspected primer-dimer formation. CCL22 was quantified using a TaqMan® Gene Expression assay. CBMC = cord blood mononuclear cells, PBMC = peripheral blood mononuclear cells. Seventeen placenta samples were originally
included, but one sample was excluded later on due to low RNA concentration. Fourteen CBMC samples with paired placental and/or maternal PBMC samples and one CBMC sample without paired placenta and maternal PBMC sample were included.
Table III. Correlations between mRNA expression in placenta, PBMC and CBMC Placenta Placenta Rho
STAT1 CXCL10 0.91 STAT1 CXCL11 0.88 Tbx21 CXCL10 0.79 CXCL9 CXCL10 0.79 CXCL9 CXCL11 0.77 CXCL10 CXCL11 0.91 IL-10 Galectin1 0.78 IL-33 Galectin1 0.78 IDO1 Galectin1 0.80 EBI3 IL-33 -0.86 PBMC PBMC Rho CCL18 CXCL10 0.85 Foxp3 GATA3 0.83 TGFβ1 RORC 0.82 Placenta CBMC Rho p35 Tbx21 - 0.88 PBMC CBMC Rho IL-5 Galectin1 0.91
Only correlations with p < 0.001 are reported. No significant correlations were observed for mRNA expression in CBMCs or between placenta and PBMCs when using this strict criterion for strong relationships.
Figure legends
Figure 1. PCR arrays were used to quantify 40 selected immune-associated genes, and
additional real-time PCR to quantify CCL22 expression in PBMCs from gw 39, placentas and CBMCs from 7 allergic and 12 non-allergic mothers and their children. Four of the 19
children developed, while 7 children did not develop allergy during childhood. Ten CBMC samples from allergic and 6 from non-allergic children were added to allow assessment of gene expression of 5 selected genes (CCL22, Tbx21, GATA3, Foxp3, RORC) in relation to future allergy development. The number of available PBMC (left), placenta (right) and CBMC samples are presented in parenthesis.
Figure 2. The gene expression pattern in placenta was deviated towards a
Th2-associated/anti-inflammatory profile, as compared with gene expression in the maternal circulation. Expression of A, GATA3 B, IL-5 C, IL-33 D, IL-10 E, CCL18 F, EBI3 G, IDO1 H, TREM2 and I, p40 genes were increased in placenta as compared to PBMCs. Wilcoxon signed rank test was used for comparisons of paired samples. ** = p<0.01.
Figure 3. mRNA expression of CCL22 in CBMCs from allergic (n=13) and non-allergic (n=11) children. Mann-Whitney U-test was used for comparison between the groups. Medians are shown as black lines. * = p<0.05.
56 women
+ All symp + Sens n=7 (n=7, n=6) - All symp - Sens n=12 (n=9, n=10)19 children
- All symp - Sens n=7 + All symp + Sens n=4 selection+ All symp - All symp + All symp + Sens n=8 + All symp + Sens n=2 - All symp - Sens n=3 - All symp - Sens n=3
Fig 1
selection PCR array: 40 genes Real-time PCR: CCL22 Real-time PCR: CCL22, Tbx21, GATA3Foxp3, RORC
27 children
Drop-outs n=2 +all symp -sens -all symp + sens -all symp data on sens is missing n=2 n=3 n=1
GATA-3 Placenta PBMC 3 4 5 6 7 8 9 ** ΔCt IL-5 Placenta PBMC 8 9 10 11 12 13 14 15 16 ** ΔCt IL-33 Placenta PBMC 0 2 4 6 8 10 12 14 16 ** ΔCt IL-10 Placenta PBMC 6 7 8 9 10 11 12 ** ΔCt CCL18 Placenta PBMC 0 2 4 6 8 10 12 14 16 ** ΔCt EBI-3 Placenta PBMC -2 0 2 4 6 8 10 12 14 16 ** ΔCt IDO 0 2 4 6 8 10 12 ** ΔCt TREM-2 8 10 12 14 ** ΔCt p40 9 10 11 12 13 14 15 ** ΔCt
Fig 2
A
B
C
D
E
F
G
H
I
CCL22
Allergic children Non-allergic children 0.0 2.5 5.0 7.5 10.0