Olle Eriksson
Thomas Lundberg
MPD and IRI in the position of
large goods vehicles
Network measurements
VTI r
apport 879A
|
MPD and IRI in the position of large goods v
ehicles. Network measur
ements
www.vti.se/en/publications
VTI rapport 879A
Published 2016
VTI rapport 879A
MPD and IRI in the position
of large goods vehicles
Network measurements
Olle Eriksson
Thomas Lundberg
Reg. No., VTI: 2012/0354-290
Cover pictures: Thinkstock and Hejdlösa Bilder AB Printed in Sweden by LiU-Tryck, Linköping 2016
VTI rapport 879A
Abstract
Monitoring of the state road network in Sweden includes the longitudinal measurements of
International Roughness Index (IRI) and Mean Profile Depth (MPD). This data can be used to predict values associated with rolling resistance, comfort and vehicle wear. The paths of the measurements correspond to the surface contact points of the wheels of a light passenger vehicle. In Sweden, lateral position comparisons made between medium and large goods vehicles show that right wheel track positions are not similar. This applies to larger and wider roads (typical motorways and other wide main roads). Knowledge of the surface conditions (IRI and MPD) at the surface contact points associated with a large goods vehicle would prove to be useful when predicting e.g. rolling resistance for large goods vehicles on entire or local road networks. If these conditions are not measured, it is important to know how they differ from the values in the measured path. Using this knowledge VTI’s measurement vehicle was equipped with two extra texture lasers which were mounted to the right of the ordinary texture laser in the right wheel track. Data was collected on a road network with mixed categories of road standard, from secondary roads to motorways.
During the study, differences in IRI and MPD values were analysed. Values corresponded to the position of light passenger vehicles right wheel paths and two other paths 25 centimetre and 45 centimetre further out to the right (position of medium and large goods vehicles). The possibility of predicting local differences (shorter sections) and average differences was analysed.
A statistical analysis procedure for calculating the mean difference and an error margin is suggested. Results showed that although it is very difficult to explain or predict local differences, average differences can be estimated.
Title: MPD and IRI in the position of large goods vehicles – Network measurements
Author: Olle Eriksson (VTI, www.orcid.org/0000-0002-5306-2753) Thomas Lundberg (VTI, www.orcid.org/0000-0002-9893-0067)
Publisher: Swedish National Road and Transport Research Institute (VTI) www.vti.se
Publication No.: VTI rapport 879A
Published: 2016
Reg. No., VTI: 2012/0354-290
ISSN: 0347-6030
Project: Variation of Road Surface Characteristics
Commissioned by: Swedish Transport Administration and VTI
Keywords: MPD, IRI, lateral variation, road surface condition, rolling resistance
Language: English
VTI rapport 879A
Referat
Mätning av längsgående ojämnheter och makrotextur på det statliga vägnätet i Sverige inkluderar International Roughness Index (IRI) och Mean Profile Depth (MPD). Dessa data kan bland annat användas för att prediktera, rullmotstånd, komfort och fordonsslitage. De spår där mätningen av IRI och MPD sker motsvarar sidoläget för kontaktytan för däcken på en personbil.
I Sverige har jämförelser gjorts av sidoläget för personbilar och lastbilar som visar att däckens
kontaktyta i högra hjulspåret är olika. Detta gäller större och bredare vägar (t.ex. motorvägar och andra breda huvudvägar). Kunskap om tillståndet (IRI och MPD) vid däckens kontaktyta för en lastbil är användbar för att beräkna till exempel rullmotstånd för stora lastbilar på ett helt vägnät eller på objektnivå. Om IRI och MPD inte mäts för lastbilars position, är det viktigt att veta hur de skiljer sig från de uppmätta värdena för personbilar. Informationen om olika fordons laterala lägen användes då VTI:s mätbil utrustades med två extra texturlasrar, som monterades till höger om den vanliga
texturlasern i höger hjulspår. Data samlades in på ett vägnät med blandade grupper av vägstandard, från sekundära vägar till motorvägar.
I studien har skillnader i IRI- och MPD-värden analyserats för olika sidolägen. Värdena motsvarar tillståndet för positionen för personbilars högra däck och två andra spår 25 och 45 centimeter längre ut till höger (läge för lastbilar). Analys gjordes för att kunna förutsäga lokala skillnader (kortare avsnitt) och genomsnittliga skillnaderna.
I rapporten föreslås en statistisk analysmetod för att beräkna genomsnittlig skillnad och en felmarginal vid jämförelse mellan två olika sidolägen. Resultaten visade att det är svårt att förklara eller förutsäga lokala skillnader medan genomsnittliga skillnader och felmarginaler kan uppskattas.
Titel: MPD och IRI i sidoläget för tung trafik – Nätverksövergripande mätning
Författare: Olle Eriksson (VTI, www.orcid.org/0000-0002-5306-2753) Thomas Lundberg (VTI, www.orcid.org/0000-0002-9893-0067)
Utgivare: VTI, Statens väg och transportforskningsinstitut www.vti.se
Serie och nr: VTI rapport 879A
Utgivningsår: 2016
VTI:s diarienr: 2012/0354-290
ISSN: 0347-6030
Projektnamn: Variation av tillståndsmått för vägytan
Uppdragsgivare: Trafikverket och VTI
Nyckelord: MPD, IRI, sidoläge, tillståndsmätning av vägar, rullmotstånd
Språk: Engelska
VTI rapport 879A
Foreword
This report has been sponsored by the Swedish Transport Administration and VTI. The project is part of the MIRIAM project (Models for rolling resistance in Road Infrastructure Asset Management Systems).
The following persons should be gratefully acknowledged for their contributions and work carried out during the project:
Peter Andrén, Datamani, Data processing
Terence McGarvey, VTI, Measurements and language review Stig Englundh, VTI, Measurements
Linköping, March 2016
VTI rapport 879A
Quality review
Internal peer review was performed on 10 December 2015 by Terry McGarvey. Olle Eriksson and Thomas Lundberg has made alterations to the final manuscript of the report. The research director Anita Ihs examined and approved the report for publication on 16 December 2015. The conclusions and recommendations expressed are the authors’ and do not necessarily reflect VTI’s opinion as an authority.
Kvalitetsgranskning
Intern peer review har genomförts 10 december 2015 av Terry McGarvey. Olle Eriksson och Thomas Lundberg har genomfört justeringar av slutligt rapportmanus. Forskningschef Anita Ihs har därefter granskat och godkänt publikationen för publicering 16 december 2015. De slutsatser och
rekommendationer som uttrycks är författarnas egna och speglar inte nödvändigtvis myndigheten VTI:s uppfattning.
VTI rapport 879A
Contents
Summary ... 9
Sammanfattning ... 11
1. Background ... 13
2. Purpose of this Study ... 14
3. Preparations and Measurements ... 15
3.1. Preparations of the Measurement Vehicle ... 15
3.2. Measurements ... 17
4. Data Structure and Data Sources ... 18
4.1. Road Network and Lowest Level Data Structure ... 18
4.2. Data Source ... 19 5. Analysis ... 20 5.1. Preliminary Analyses ... 20 5.2. Sampling Procedure ... 20 5.3. Final Analysis ... 21 6. Results ... 22
6.1. Summarised Numerical Results ... 22
6.2. Recommendations for Use ... 23
7. Discussion ... 25
VTI rapport 879A 9
Summary
MPD and IRI in the position of large goods vehicles – Network measurements
by Olle Eriksson (VTI) and Thomas Lundberg (VTI)
Road monitoring of the state road network in Sweden includes the longitudinal measurements of International Roughness Index (IRI) and Mean Profile Depth (MPD). The paths of the longitudinal measurements correspond with the surface contact points of the wheels of a light passenger vehicle. This data can be used to estimate values for different properties such as, rolling resistance, comfort and vehicle wear. Knowledge of the surface condition (IRI and MPD values) at the surface contact points associated with a large goods vehicle would prove to be useful when estimating similar values on an entire or local road network, including all vehicle types. If these conditions are not known, it is important to know how they differ from the measured path.
In Sweden, lateral position comparisons made between medium and large goods vehicles show that right wheel track positions are not similar. This applies to larger and wider roads (typical motorways and other wide main roads). Using this knowledge, VTI’s measurement vehicle was equipped with two extra texture lasers which were mounted to the right of the ordinary texture laser in the right wheel track. Data was collected on a road network with mixed categories of road standard varying from secondary roads to motorways.
The study of differences in IRI and MPD values, corresponding to the position of light passenger vehicles right wheel path and two other paths, 25 centimetre and 45 centimetre further out to the right (position of medium and large goods vehicles), showed rather small values in average differences. The differences are presented for different pavement types. An attempt to predict differences between the tracks for each 20-meter section failed. Inconsistent results meant that it was not possible to explain the differences. A statistical analysis procedure was used to calculate the global differences for the mean difference and error margin. The statistical analysis procedure is also presented in the report. The result for MPD showed very small global differences in the different lateral positions and normally the error margin is bigger than the average difference. Results regarding IRI values were more consistent. IRI values were greater closer to the road shoulder and the error margins were usually smaller than the differences. The difference in IRI and MPD between large goods vehicle (45 cm) and light passenger vehicle in the right wheel path for the two most common pavement categories, stone mastic asphalt (SMA) and dense asphalt concrete (DAC) were:
SMA – 0.059 mm and error margin 0.024 mm for MPD DAC – 0.009 mm and error margin 0.048 mm for MPD SMA – 0.196 mm/m and error margin 0.026 mm/m for IRI DAC – 0.238 mm/m and error margin 0.075 mm/m for IRI
VTI rapport 879A 11
Sammanfattning
MPD och IRI i sidoläget för tung trafik – Nätverksövergripande mätning
av Olle Eriksson (VTI) och Thomas Lundberg (VTI)
Mätning av tillståndet på det statliga vägnätet i Sverige omfattar längsgående ojämnhet och makro-textur i form av International Roughness Index (IRI) och Medelprofildjup (MPD). Måtten mäts i det sidoläge som överensstämmer med kontaktytan för däcken på en personbil. Dessa data kan användas för att uppskatta värden för olika egenskaper som rullmotstånd, komfort och fordonsslitage. Kunskap om yttillståndet (IRI och MPD) för kontaktytan hos en lastbil behövs vid bedömningen av liknande egenskaper för lastbilar både på vägnätsnivå och på objektnivå. Om tillståndet inte mäts för lastbilar, är det viktigt att veta hur de skiljer sig från de uppmätta.
I Sverige har jämförelser gjorts av sidoläget för personbilar och lastbilar som visar att den laterala positionen för det högra däcket skiljer sig. Detta gäller speciellt för större och bredare vägar (t.ex. motorvägar och andra breda huvudvägar). Detta visar att vi saknar information om tillståndet där lastbilarna färdas. Den informationen användes då VTI:s mätbil utrustades med två extra texturlasrar, som monterades till höger om den vanliga texturlasern i höger hjulspår. Data samlades in på ett vägnät med blandade grupper av vägstandard, från sekundära vägar till motorvägar.
Studien av skillnader för IRI och MPD i ordinarie position (personbilsposition) och mätningarna vid de två andra sidolägen som testades, 25 och 45 centimeter längre ut till höger (position för lastbilar), visade ganska små genomsnittliga värden. Skillnaderna presenteras för olika beläggningstyper. Ansatsen att förutse skillnaderna mellan spåren för varje 20 meterssträcka visade sig inte vara möjlig. Inkonsekventa resultat innebar att det inte var möjligt att förklara de lokala skillnaderna. En statistisk ansats användes för att beräkna genomsnittliga skillnader med tillhörande felmarginal. Ansatsen presenteras också i rapporten. Resultatet för MPD visade mycket små globala skillnader i olika sidolägen och normalt är felmarginalen större än den genomsnittliga skillnaden. Resultat avseende IRI-värdena var mer konsekvent. IRI var större närmare vägrenen och felmarginaler var oftast mindre än skillnaderna. Skillnaden i IRI och MPD mellan lastbilars och personbilars högra hjulspår (45 cm) för de två största beläggningskategorierna, asfaltbetong stenrik (ABS) och asfaltbetong tät (ABT) var:
ABS – 0,059 mm och felmarginal 0,024 mm för MPD ABT – 0,009 mm och felmarginal 0,048 mm för MPD ABS – 0,196 mm/m och felmarginal 0,026 mm/m för IRI ABT – 0,238 mm/m och felmarginal 0,075 mm/m för IRI
VTI rapport 879A 13
1.
Background
Road monitoring has a long history in Sweden. As early as 1987, International Roughness Index (IRI) (Sjögren L., 2014) was measured on all state roads. Macrotexture, expressed as Mean Profile Depth (MPD) (Lundberg T. et al., 2011) has a much shorter history. Measurements of MPD in Sweden started in 2005. Measurements are non-contact laser based and are carried out at normal traffic speed. The indicators are measured at different lateral positions in the road in order to monitor the condition where it is needed the most. The lasers measuring IRI and MPD have always had fixed lateral positions. The left and right hand side lateral position of the lasers corresponds with the distance between the wheels of a light passenger vehicle (private car, 1.5 m).
An earlier pilot study of selected test sites (Lundberg T. et al., 2012) showed that there were large local differences of MPD and IRI values at different lateral positions in the road. Taking this knowledge into account, it was decided to study these differences on a road network basis.
Data from road surface monitoring can be directly used to make conclusions of the road condition. It can also be used in models which calculate or predict more complexed indexes and “higher” levels of decision based indexes such as environment impact, rolling resistance (Sandberg U., 2011), structural condition, comfort and vehicle wear.
Over time, more knowledge has become available and this has led to an increased demand and level of detail. As the possibility exists to increase the level of detail, indicators in turn will become refined. The model used for calculating the environmental impact of road/vehicle associated emissions uses IRI and MPD as input. The IRI and MPD variables used in the models for medium and large goods vehicles have so far not been discriminated. Even if differences are rather small, they can have a large impact on results when calculating the effect on a whole road network.
14 VTI rapport 879A
2.
Purpose of this Study
The purpose of this study was to determine if there is a difference in IRI and MPD values for the right wheel path of different vehicle categories. This should be determined in order to increase knowledge of actual surface conditions at the road-vehicle interaction position for both medium and large goods vehicles.
The purpose was also to see if it was possible to estimate MPD and IRI values for large goods vehicles using IRI and MPD values associated with light passenger vehicles and explanatory variables like road width and pavement age.
During the study, two different approaches were tried:
Local estimation – estimate the condition for each 20 m or 100 m section.
Global estimation – estimate the condition for an entire group of roads of a given pavement category.
Local estimation could be used for object level calculations. Global estimation could be used when only mean values for an entire network is required.
VTI rapport 879A 15
3.
Preparations and Measurements
3.1. Preparations of the Measurement Vehicle
Since the purpose of the study was to analyse differences in IRI and MPD values between the lateral positions of medium and large goods vehicles, we must first know the average lateral position of these vehicle types. This information was available from a recently finished but not yet published VTI project (McGarvey T., 2015). During this project, vehicle position surveys were carried out on different road categories ranging from 8m wide roads to motorways. Based on the projects results, the following assumptions can be made:
On wide roads, medium and large goods vehicle tended to have the same left wheel lateral position
In more confined or narrow roadways, all vehicle types tended to be positioned more centrally in the lane
The figure below is from the report described above (McGarvey T., 2015) and shows measurements of lateral position, in average and the standard deviation, for three different vehicle categories, light passenger vehicles (LV), medium goods vehicles (HGV 1) and large goods vehicles (HGV 2), on a motorway.
Figure 1. Average lateral distance for different vehicle types. LV – light passenger vehicles, HGV 1 – medium goods vehicle and HGV2 – large goods vehicle. The standard deviation is presented within brackets. All distances in mm. (McGarvey T., 2015).
16 VTI rapport 879A Table 1. Summary of data from measurements of lateral position on motorway.
Distan ce fr om R ight Road M arkin g to Rig ht Wheel (mm ) Stand ard Dev iation (mm ) Distan ce fr om R ight Road M arkin g to Left Wheel (mm ) Stand ard Dev iation (mm ) Vehicle Tra ck W idth (m) Estima ted Fron t Tyre W idth (m m) Light passenger vehicle 995 456 2529 452 1.53 175 Medium goods vehicle 723 405 2528 372 1.81 265 Heavy goods vehicle 465 228 2557 224 2.10 355
Figure 2. Transverse profile measured at the photographs position and the lateral positions of the different vehicle types. (McGarvey T., 2015). (Picture: Swedish Road Administration)
The data from this measurement shows that the left wheels of all vehicle types are, on average, at the same position in the road. For the right hand side wheels, the distance between light passenger vehicle (LV) and medium goods vehicle (HGV1) is approximately 0.27 m and the distance between a light vehicle (LV) and heavy goods vehicle (HGV2) is, on average, 0.53 m. Due to restricted space on the frame holding the lasers, two extra lasers, used to measure macrotexture and unevenness, were mounted 0.25 m and 0.45 m from the laser that is normally used for macrotexture and unevenness. These positions correspond rather well with the optimal positions detailed in Figure 1.
VTI rapport 879A 17
3.2. Measurements
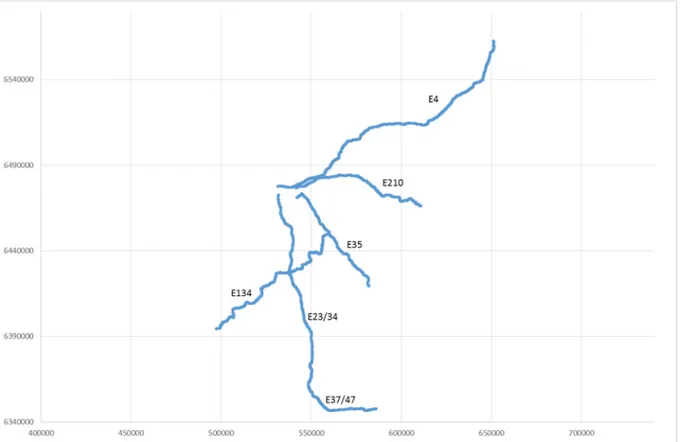
Measurements were carried out during the autumn of 2013. There was a wide distribution of major and minor road types, ranging from good quality secondary roads to motorways. The total length measured was just over 1000 km (Figure 3). Roads were measured in both directions. The vehicle driver was instructed to follow a driving line similar to the line driven by the network measurement vehicles.
18 VTI rapport 879A
4.
Data Structure and Data Sources
A model that can explain how macrotexture and longitudinal unevenness differ between various wheel tracks locally also needs additional information about the road and the traffic. The explanatory
variables used were annual average daily traffic (AADT), large goods vehicles annual average daily
traffic (hAADT), road width, pavement stone size, and pavement age. The data structure and sampling procedure must be described in order to properly choose a model. Because different data sources were used, it was also important to describe if different sampling procedures were used in the different sources and how the data could be matched.
4.1. Road Network and Lowest Level Data Structure
An example of a road network is graphically illustrated in Figure 4 and can be described as follows:
Roads are indicated with long lines.
Each road is divided into sections. Black bullet points show where sections begin and end. Sections are divided into 20 m segments. Short lines, perpendicular to the section lines,
indicate the beginning and end of each segment.
Sections have different pavement types. Pavements are analysed one type at a time. All roads with a selected pavement type are marked with red. Roads with other pavement types are marked with black.
Only a sample of sections are measured. The sample is marked with wider lines.
There may be different pavement types within a section, as shown in one case where red and black colours appear on the same section. The entire section has been sampled but only the red part is used when analysing that selected pavement type.
VTI rapport 879A 19 Sections are divided into consecutive 20 m segments that fill the section without overlapping. The MPD values are probably correlated along a section, meaning that information in a 20 m segment is likely to be followed by approximately the same information in the next 20 m segment. This may be a problem when trying to define the number of independent observations. However, correlated values are not the same as correlated error terms and therefore do not create the same type of problems in the analysis.
4.2. Data Source
It was assumed that differences in MPD and IRI between wheel tracks could vary between pavement types. The dependence on other explanatory variables could also vary between pavement types. Because of this, it was crucial to identify the pavement type on the measured sections and that data and analyses could be split accordingly.
Information such as pavement type, AADT and road width was obtained from the Swedish Transport Administrations pavement management system (PMSv3). MPD and IRI was measured with VTIs road surface tester (RST). Data from the two sources was combined as follows:
PMS and RST data were matched using section IDs. GPS coordinates were used to check overall shape and the start and finish points for each section. It was also possible to check that PMS and RST data was recorded in the same direction.
PMS data was recorded mainly in 20 m segment lengths, however, some variation did occur. RST data was also available in 20 m segment lengths. In addition, PMS and RST data appeared to have had different drift in the distance data. Comparisons between the number of observations and measured lengths were performed on the PMS and RST data. If required, removal or stretching was also carried out to improve the matching.
PMS data is updated each year but not for every road. Only PMS data from 2013, the same year as the RST data, was used.
On occasion, the mean difference between tracks in the RST data appeared to be
systematically too large to be relevant and correct. For that reason, some sections have been removed from the analyses.
MPD and IRI is included in the PMS. However, data was only available for one of the tracks that was used in this report. MPD values for that track have been compared with the PMS and RST data as a control.
20 VTI rapport 879A
5.
Analysis
Let MPD be mean profile depth in the right wheel track. Also, let MPD and MPD be MPD in the tracks 25 cm and 45 cm to the right of the right hand side wheel track. The same indexes were used for IRI, though only MPD is used when discussing methods below. AADT, hAADT, road width, stone size and pavement age were also used. All explanation, analyses and results are meant to be read as representing one pavement type at the time.
5.1. Preliminary Analyses
In order to be able to suggest a model, it was necessary to determine the relationship between MPD and MPD . Plotting the data and doing some preliminary analyses more or less showed that
MPD MPD varied randomly around a constant level. Neither the level nor the variation
increased with higher MPD .
A preliminary multiple linear regression model, MPD ∙ MPD ∙ AADT ⋯ , where the variation in MPD can be explained by variations in MPD and the other variable describing the road, looks promising with a high R etc. However, this is not recommended as a well-chosen analysis. Linear regression, with MPD as response variable and MPD as predictor variable, would use the data as if MPD is "correct" while MPD has random error. There is no reason to treat the MPD data in different tracks as if they have different levels of random error. Also, the high R arises from the fact that
MPD and MPD are very similar but gives no information about how well the difference between
MPD and MPD has been explained. A regression model with the difference in MPD between tracks
as response variable, MPD MPD 0 1∙ AADT ⋯ , gave a poor result with R around 5%. It appears that there is a variation in the difference MPD MPD , possibly with expected value different than 0, but it was not possible to suggest a model that described this difference using predictor variables.
Applying the same approach to the IRI data gave a similar poor result regarding a regression model. It was not possible to explain differences in IRI between wheel paths locally by using a regression model with other variables describing the road as explanatory variables.
5.2. Sampling Procedure
Sections were sampled and each segment within a sampled section was measured. There was no second stage sampling of segments. Samples were treated as a single stage cluster sample, where the sampling units are the sections while the elements are the segments. A section can be considered as a cluster of segments. Sampling a section is logically the equivalent to sampling a cluster of segments. One observation in the data files referred to properties of a segment, however, segments were never sampling units. If sampling units and elements are not the same, the chosen analysis must be able to take care of this. This was not the case in the preliminary analyses, so it should be emphasised that they were preliminary.
Variation in data within a section was assumed to mainly reflect surface variation along the section and not random errors in the measurements. It is probable that surface properties vary, often by a small amount, along the section, causing the observations to be longitudinally correlated within a section. This serial correlation in the surface data does not give any problems in the analysis when all segments in a section are used.
The driver of the RST had an instruction about which lateral position to follow. Because the lateral position cannot be followed with absolute precision, it may be necessary to also discuss lateral position as a “sample”. On short distances, the lateral position compared to the ideal track probably has serial correlation. On longer sections, any effect of the lateral position should level out and will not be disturbed by serial correlation of the position. If the position varies within sections to such an
VTI rapport 879A 21 extent that it does not level out, then that will be part of the variation between sections, which is also included as an error in the final analysis.
5.3. Final Analysis
The total of all observations in cluster , , is the sum of deviations between MPD MPD on
that section. The size of cluster , , is the length expressed as the number of 20 m segments. If a
section had different pavement types, then both and refer to the part of the section that had the
selected pavement type. The population mean, , is the average difference of MPD MPD over
the entire road network. It is the population sum of all deviations over all segments divided by the
number of segments. If the network had sections, then ∑∑ . The corresponding estimator for
a sample of clusters is the sample sum of all deviations divided by its number, that is ̂ ∑∑ .
The sections had varying lengths. For road network measurement, longer sections should have larger
weight. If is the average of on section , then the mean can alternatively be
written as ∑∑ .This is a weighted mean of the section means, with weights proportional to
section length. The estimator also has that structure and is a ratio of random variables. The variance for ratios of this type does not normally have closed form expressions, but known approximations
exist. In this case, if is the average section length in the sample, then the variance of ̂, , is
approximately ∙∑ . This can be adjusted if the number and average length of sections in
the network are known. In this case it was assumed that this information was not available. The method should not be used for samples that only include a few clusters. An error margin for the mean
difference and is 2 .
Data can also be summarised by using standard deviation (SD) within sections that describes how
MPD MPD vary between 20 m segments and SD between sections that describes how the
sample mean difference varies between sections.
As can be seen above, only equations for the difference MPD MPD were discussed. However,
the same method can be used for MPD MPD without further explanation as long as no
assumption is made about how these two differences relate to each other. IRI was also analysed using the same method.
22 VTI rapport 879A
6.
Results
6.1. Summarised Numerical Results
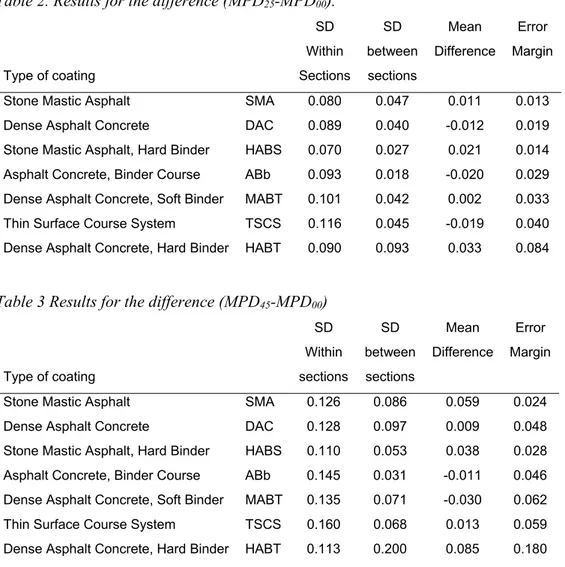
Table 2 summarises the measured differences MPD MPD for different pavement types while
Table 3 summarises the results for MPD MPD .
Table 2. Results for the difference (MPD25-MPD00).
SD SD Mean Error Within between Difference Margin Type of coating Sections sections
Stone Mastic Asphalt SMA 0.080 0.047 0.011 0.013 Dense Asphalt Concrete DAC 0.089 0.040 -0.012 0.019 Stone Mastic Asphalt, Hard Binder HABS 0.070 0.027 0.021 0.014 Asphalt Concrete, Binder Course ABb 0.093 0.018 -0.020 0.029 Dense Asphalt Concrete, Soft Binder MABT 0.101 0.042 0.002 0.033 Thin Surface Course System TSCS 0.116 0.045 -0.019 0.040 Dense Asphalt Concrete, Hard Binder HABT 0.090 0.093 0.033 0.084
Table 3 Results for the difference (MPD45-MPD00)
SD SD Mean Error Within between Difference Margin Type of coating sections sections
Stone Mastic Asphalt SMA 0.126 0.086 0.059 0.024 Dense Asphalt Concrete DAC 0.128 0.097 0.009 0.048 Stone Mastic Asphalt, Hard Binder HABS 0.110 0.053 0.038 0.028 Asphalt Concrete, Binder Course ABb 0.145 0.031 -0.011 0.046 Dense Asphalt Concrete, Soft Binder MABT 0.135 0.071 -0.030 0.062 Thin Surface Course System TSCS 0.160 0.068 0.013 0.059 Dense Asphalt Concrete, Hard Binder HABT 0.113 0.200 0.085 0.180
Overall, there was more variation within sections than between sections. Mean differences were small
and with different sign and often less than the error margins. The variation in MPD MPD was
smaller than the variation in MPD MPD . The mean difference had no clear comparable pattern
between MPD MPD and MPD MPD , however, error margins were generally smaller
in MPD MPD .
The results indicate that MPD values, 25 cm and 45 cm to the right of the right wheel track, had about the same MPD values found in the right wheel track position. There was some variation in the
differences compared to the right wheel track. These differences varied more within sections than between sections. They cannot easily be explained by the use of predictor variables such as AADT and road width.
IRI values at different lateral positions were analysed in the same way as the MPD data. Results showed that it was not possible to determine a model that could explain the differences locally. However, the level of global standard deviation within and between sections, as well as average
VTI rapport 879A 23 differences and error margins, can be presented. The global average results for IRI data were more consistent than with the results for MPD data. IRI values were larger for positions further out to the right of the lane. In addition, error margins were in most cases smaller than the differences.
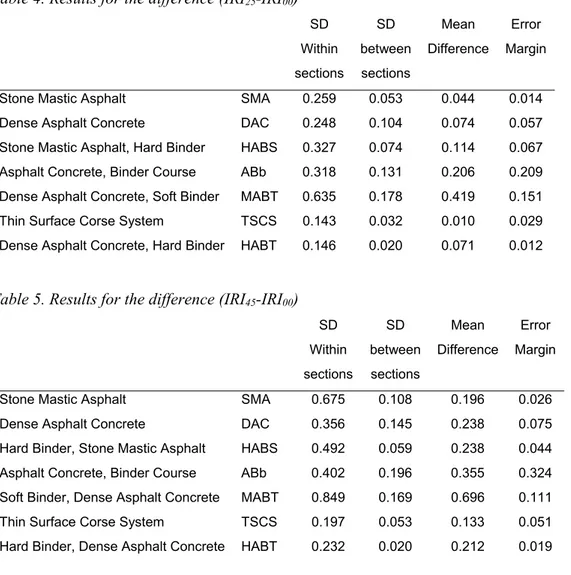
Comparisons of the same pavement category showed that IRI – IRI were always greater than
IRI – IRI . All of the results can be seen in Table 4 and 5.
Table 4. Results for the difference (IRI25-IRI00)
SD SD Mean Error Within between Difference Margin sections sections
Stone Mastic Asphalt SMA 0.259 0.053 0.044 0.014 Dense Asphalt Concrete DAC 0.248 0.104 0.074 0.057 Stone Mastic Asphalt, Hard Binder HABS 0.327 0.074 0.114 0.067 Asphalt Concrete, Binder Course ABb 0.318 0.131 0.206 0.209 Dense Asphalt Concrete, Soft Binder MABT 0.635 0.178 0.419 0.151 Thin Surface Corse System TSCS 0.143 0.032 0.010 0.029 Dense Asphalt Concrete, Hard Binder HABT 0.146 0.020 0.071 0.012
Table 5. Results for the difference (IRI45-IRI00)
SD SD Mean Error Within between Difference Margin sections sections
Stone Mastic Asphalt SMA 0.675 0.108 0.196 0.026 Dense Asphalt Concrete DAC 0.356 0.145 0.238 0.075 Hard Binder, Stone Mastic Asphalt HABS 0.492 0.059 0.238 0.044 Asphalt Concrete, Binder Course ABb 0.402 0.196 0.355 0.324 Soft Binder, Dense Asphalt Concrete MABT 0.849 0.169 0.696 0.111 Thin Surface Corse System TSCS 0.197 0.053 0.133 0.051 Hard Binder, Dense Asphalt Concrete HABT 0.232 0.020 0.212 0.019
6.2. Recommendations for Use
The results in this study should be used according the following summary,
Regarding MPD – the results indicate that MPD differences between different lateral
positions is small. The measured MPD for light passenger vehicles can be used to approximate MPD for medium and large goods vehicles.
Regarding IRI – the results indicate that IRI in different lateral positions cannot be neglected. When using IRI-condition for medium and large goods vehicles and only IRI-levels are available for the positions of light passenger vehicles the results according the tables 4 and 5 should be added to the measured IRI values.
This applies for network calculations, not at object level. Which of the tables 4 and 5 to use when
estimating IRI for medium and large goods vehicle depends on the type of road (road width) and for what type of vehicle you should estimate the IRI-condition. Results from studies of lateral position at different
24 VTI rapport 879A
road width and with different vehicles types (McGarvey T., in progress) should be used to determine which of the tables to use. A brief suggestion is to use IRI-differences according Table 4 when estimating IRI for large goods vehicles at narrow roads and IRI differences for large goods vehicles according Table 5 for wider roads.
VTI rapport 879A 25
7.
Discussion
It was not possible to suggest a model that could explain MPD or MPD for 20 m or 100 m segment lengths by using MPD and prediction variables such as AADT and road width. Suggestions, on how to predict MPD or MPD or its difference against MPD , could not be made for 20 m segments or
entire sections. However, it was possible to estimate the mean differences MPD MPD and
MPD MPD aggregated to road network level. Error margin suggestions for that estimate can
also be made. Restrictions on how MPD MPD and MPD MPD should relate to each
other have not been included. IRI data was analysed in the same way as the MPD data and led to the same conclusions regarding use of explanatory variables, model selection etc.
The differences MPD MPD and MPD MPD were analysed separately A possible
improvement of the analysis could be to compare all three wheel tracks at the same time. If it is
assumed that MPD MPD has the same sign and is greater than MPD MPD , the
assumption can be tested and, if it appears to be correct, be restricted according to that.
For better precision in the estimates, a new sample should include many sections. With this type of data structure, using data collected from a few long sections does not improve the estimate precision by much. It is the difference between sections that is most important, meaning that many sections should be used to improve the estimation.
If the data is regarded as a two stage cluster sample, it is also possible to include the variation within clusters in the error margin. It is, however, unclear how that should be done. There is no sampling of 20m section in a second stage. The idea would rather be to estimate the random error within sections (due to measurement noise, driver behavior etc.) and include them in the error margin as if the finite sample correction was not zero in the second stage.
The estimation method used was derived for a truly random sample of sections, but the sampling in this study was not carried out exactly in that way. This does not necessary result in a drawback because some sampling techniques, other than simple random sampling, may improve the precision of the results. However, some difficulties are possible when trying to express how much the precision was improved. Sections have to some degree been selected, but MPD was not one of the selection criteria. In this case, it is reasonably considered that the method was well chosen and that the results were reliable.
In this study, the sample included different road widths, different pavement ages etc. and should be regarded as having the same benefits as a systematic sample.
VTI rapport 879A 27
References
Lundberg T., Sjögren L., Gustafsson M., Ihs A., (2011), Vägytans makrotextur och dess variation – Vägytemätning med mätbil, VTI-Notat 5-2011.
Lundberg T., Sjögren L., (2012), The influence of lateral position when measuring road surface characteristic data - Introductory study, VTI notat 20A-2012
Mendenhall, W., Ott, L., Scheaffer, R. L., (1996), Elementary survey sampling, Wadsworth Publishing Company
McGarvey T. (In progress), Variation of Vehicle Lateral Position – According to Road Type and Lane Width, VTI report
Sandberg U. (editor), (2011), Rolling Resistance – Basic Information and State-of-the-Art on Measurement methods. Miriam report MIRIAM_SP1_01
Sjögren L., (2013), Svenska vägtillståndsmått då, nu och i morgon. Del 1: Då – 2005, VTI-rapport 717
www.vti.se
VTI, Statens väg- och transportforskningsinstitut, är ett oberoende och internationellt framstående forskningsinstitut inom transportsektorn. Huvuduppgiften är att bedriva forskning och utveckling kring
infrastruktur, trafi k och transporter. Kvalitetssystemet och
miljöledningssystemet är ISO-certifi erat enligt ISO 9001 respektive 14001. Vissa provningsmetoder är dessutom ackrediterade av Swedac. VTI har omkring 200 medarbetare och fi nns i Linköping (huvudkontor), Stockholm, Göteborg, Borlänge och Lund.
The Swedish National Road and Transport Research Institute (VTI), is an independent and internationally prominent research institute in the transport sector. Its principal task is to conduct research and development related to infrastructure, traffi c and transport. The institute holds the quality management systems certifi cate ISO 9001 and the environmental management systems certifi cate ISO 14001. Some of its test methods are also certifi ed by Swedac. VTI has about 200 employees and is located in Linköping (head offi ce), Stockholm, Gothenburg, Borlänge and Lund.
HEAD OFFICE LINKÖPING SE-581 95 LINKÖPING PHONE +46 (0)13-20 40 00 STOCKHOLM Box 55685 SE-102 15 STOCKHOLM PHONE +46 (0)8-555 770 20 GOTHENBURG Box 8072 SE-402 78 GOTHENBURG PHONE +46 (0)31-750 26 00 BORLÄNGE Box 920 SE-781 29 BORLÄNGE PHONE +46 (0)243-44 68 60 LUND Medicon Village AB SE-223 81 LUND PHONE +46 (0)46-540 75 00