05-FEHRL
Page 1 of 42
Contract TST3-CT-2003-505831 Authors : D. Kokot, B. Kalman, U.
Sandberg
File : D2.2-Technical report-In.2.4-Submitted to approval.doc
NR2C - New Road Construction Concepts
Work Package 2 – Interurban infrastructures
Deliverable 2.2
Concept and design of selected innovations for interurban
infrastructure
Innovation 2.4 – Technical report
Improving the mechanical properties of a low noise section
Modifications follow-up Ref draft date date of submitting to approval or date of approval
Comments and/or brief description of the modifications Ex : “sending for approval to…”,“approved by …”
or “Comments from … dated …taken in account”
1 2007-04-01 2007-06 Sent by e-mail to Nicholas Bueche for comments.
2 2007-04-26 Adoption of comments from B. Mahut 23 April. Sent to N. Bueche 3 2007-10-01 Final version ZAG contribution sent to N. Bueche
Rev2 2008-01-08 Final version sent to partners
05-FEHRL
Page 2 of 42
Contract TST3-CT-2003-505831 Authors : D. Kokot, B. Kalman, U.
Sandberg
File : D2.2-Technical report-In.2.4-Submitted to approval.doc
TABLE OF CONTENTS
A - INTRODUCTION ... 3
A.1 Justification and background to the innovation ... 3
A.2 State of the art: Previous experiences and main problems ... 4
A.3 Experiment with poroelastic cover on interlocking blocks in Japan in 2002 ... 5
A.4 Identification of key points to improve ... 7
B - RESEARCH TESTS PLAN ... 7
B.1 Wet skid resistance ... 7
B.2 Stability of block pavement ... 8
C - WET SKID RESISTANCE ... 11
C.1 Raw material ... 11
C.2 Production of test material ... 12
C.3 Test description ... 15
C.4 Results ... 16
D - STABILITY OF BLOCK PAVEMENT ... 19
D.1 Pavement structure and materials characteristics ... 19
D.1.1 Poroelastic cover on cement concrete blocks ... 19
D.1.2 Bedding layer ... 21
D.1.3 Asphalt layers ... 22
D.1.4 Unbound layer ... 24
D.2 Preparation of test pavements... 25
D.3 Test setup ... 26
D.3.1 Testing procedure ... 26
D.3.2 Watering pavements ... 27
D.4 Results ... 29
D.4.1 Pavements deformation ... 29
D.4.2 Effects of watering pavements ... 34
D.4.3 Wheel track ... 37
D.4.4 Deformations of cement concrete blocks with poroelastic cover ... 39
D.5 Conclusions and recommendations ... 40
05-FEHRL
Page 3 of 42
Contract TST3-CT-2003-505831 Authors : D. Kokot, B. Kalman, U.
Sandberg
File : D2.2-Technical report-In.2.4-Submitted to approval.doc
A - Introduction
A.1 Justification and background to the innovation
In the NR2C Vision 2040 the four themes presented in the vision by ERTRAC were transformed to recognisable concepts and characteristics of the road of the future. The identified concepts of the future infrastructure are Reliability, Green, Safe & Smart and Human. The innovation we have identified as a satisfactory candidate for the infrastructure of the future has the characteristics of several of these concepts as explained below.
The innovation consists of a poroelastic material fixed on paving blocks. A poroelastic road material, in the forms we currently know, consists of an aggregate of rubber granules or fibres, sometimes supplemented by sand, stones or other friction-enhancing additives. The rubber can be either from scrap tyres or "new" rubber. It further consists of a binder to hold the mix together. Currently, the binder used is polyurethane, with a binder contents tried so far ranging between 5 and 17 % by weight. The design void content should be at least 20% although it usually above 30%. In combination with paving blocks this surface combines the excellent noise reducing qualities of the poroelastic material with the possibility to manufacture a large part of the road off site and thus avoiding problems with poor adhesion, see below, which was a major obstacle in previous field tests with poroelastic road materials.
The innovative surface would combine the desires of having a quiet and at the same time aesthetically pleasing surface. Today’s block pavement surfaces are often very noisy [4] which is inconsistent with the objective of sustainable transport from the acoustical viewpoint. The poroelastic cover would be superior to conventional porous asphalt concrete as this type of surface is anticipated to produce less noise in contact with tyres due to its softness and air void content, and to be self cleaning and thus having a lasting noise reducing performance. The SOFTBLOC pavement fulfils main concepts for the road of the future, designated in the NR2C Vision 2040: reliability, environmental friendliness, safety and human nature. According to laboratory studies the poroelastic pavement is less sensitive to traffic wear than the asphalt concrete, and as a low noise road surface (predicted a 5-6 dB(A) noise reduction compared to an SMA11 surface) certainly fulfils criteria for being environmentally friendly. The pavement is also self-cleaning and is made to a great extent of recycled material. Because of high percentage of voids it drains away the run-off water from road surface making traffic more safe and comfortable. Lesser amount of water is minimizing a possibility for aquaplaning effect and it also improves the visibility by reducing the spray. Because it is aesthetically pleasant surface, it is also more close to the human nature and could be used in areas where multi-functional infrastructure is desired.
A SOFTBLOC pavement is being developed in SILENCE project. However, with the addition of this activity in NR2C and the pooling of resources, more than twice the extent of development and experiments in SILENCE will be possible, which dramatically increases the possibilities of success and will give the results substantially higher validity. A pavement similar to SOFTBLOC was tried earlier only once, namely 2002 on a highway in Japan. That experiment failed due to instability of the foundation for the block pavement, combined with an unusually high volume of heavy traffic. The instability of the foundation was apparently due to insufficient drainage of the base layer. The drainage was accomplished with a thin perforated polyethylene pipe on the road edge.
Both projects, NR2C and Silence, would take advantage of cooperation by sharing results of trials with a new type of low noise road surface. As a possible type of surface, where cooperation would provide synergy between the two projects, is a block pavement with soft cover. The block pavement is made of interlocking cement concrete blocks laid on a stable foundation; while the soft cover is a so-called poroelastic layer. In this document, the type of pavement referred to is named SOFTBLOC – Silent poroelastic overlay fixed on tailored cement block pavement.
The experiments in Slovenia and Sweden have used an improved version of poroelastic surface, having friction-enhancing additives. The friction enhancing material that was tested is a very hard and though material e.g. silicon carbide that is sometimes used blended into the rubber as a replacement
05-FEHRL
Page 4 of 42
Contract TST3-CT-2003-505831 Authors : D. Kokot, B. Kalman, U.
Sandberg
File : D2.2-Technical report-In.2.4-Submitted to approval.doc
of studs in tyres. Furthermore, the aim of the test was to improve the foundation for the blocks (bedding layer for the blocks), intending to avoid the Japanese failure. Two different designs of the interlocking block pavement were considered: one with the sand bedding layer and the second one with the cementitious screed bedding layer.
The laboratory test program includes: wearing and friction tests, internal strength tests, adhesion tests, permeability tests. The laboratory test program will ensure that the material has sufficient durability, enough and lasting wet friction, good acoustical characteristics and a sufficient adhesion between the interlocking blocks and the soft cover.
In case of success, it is expected that this pavement will offer an unique and totally new noise reduction option for urban areas, predicting a 5-6 dB noise reduction compared to an SMA11 surface, using a porous surface which is expected to be self-cleaning and offering high noise reduction throughout its lifetime.
A.2 State of the art: Previous experiences and main problems
Previous experiences with poroelastic road material were summarized in a report, SILVIA Project Report SILVIA-VTI-005-02-WP4-141005. The report can be downloaded from the website: http://www.trl.co.uk/silvia/. A short version of the history of the field trials is presented in this document. In the 1980's three field tests were made in Sweden with poroelastic material. Two strips were laid on a closed-down airport. They performed well there during at least 10 years (with no traffic exposure). The second field test was a trial in 1987 on a Stockholm street where 6 m2 of rubber panels were laid to check durability. These panels performed well during the winter when they were tested. After that trial, a two-lane local street was paved with the same material. This field trial was a total failure, since after a few weeks the surface had to be removed due to patches loosening from the base-layer. In Norway, in the beginning of 1989, a two-lane street with rather light traffic, a 130 m long poroelastic road surface with 8 mm rubber granules was laid on a porous base layer. The friction coefficient was found to be 0.36 as an average measured with the ”Mu-meter” (sideway force coefficient with smooth tyres). This was not acceptable but was probably typical of the unworn state of this surface. Some time after laying of this surface, small patches loosened from the base layer in one of the two lanes, but this could generally be ascribed some problem during the laying. The other lane was still fine after a few months. However, when snow came in the early winter, the snowplough ripped off large parts of the surface.
In mid 90’s the Public Works Research Institute (PWRI) in Japan started research on poroelastic road surfaces. The driving force behind the research was the desire to meet the noise regulations for heavily trafficked roads where conventional countermeasures, like porous asphalt and noise screens, were not sufficient. Several trial surfaces were laid around the year 2000 on the PWRI test track on a cement concrete base. Essentially, the test sections were in good condition in 2005, but some rubber panels had corners where the rubber sheet had loosened from the base layer (only in the corner) and had become slightly bent upwards. Full-scale experiments on trafficked highways were conducted in Japan as follows: Akita, October 2002 - An interlocking block pavement was covered with PERS. Failed in the spring of 2003 due to severe rutting. Mie, April 2003 - Three different types of PERS were tested. One of the test sections failed within a couple of months because of having too poor adhesion to the base layer. Mie, October 2003 - Three different types of PERS were tested. This was a repeat of the experiment in April 2003. The experiment failed in May 2004, after half a year of exposure to traffic due to too low wet friction.
VTI conducted one full scale experiment on a medium volume trafficked road in August 2004. Three different types of PERS were tested. This test failed due to erosion of the base layer. The adhesion between two old layers of asphalt concrete was insufficient in this case.
In conclusion: Early on it was proven that it is not too difficult to produce a poroelastic surface with excellent internal durability. Later test has also confirmed these results and have also demonstrated that the durability towards for example studded tyres is much better for PERS than conventional
05-FEHRL
Page 5 of 42
Contract TST3-CT-2003-505831 Authors : D. Kokot, B. Kalman, U.
Sandberg
File : D2.2-Technical report-In.2.4-Submitted to approval.doc
pavement materials. On the contrary, the problems encountered in some of the early trials with poor adhesion between PERS and the base layer were also the cause of failure in some later field trials. Laboratory trials on adhesion and some of the later field trials have shown that the adhesion could be made sufficiently strong, if enough binder is applied to the surface and proper attention is taken to cleaning of the base layer prior to adding the binder. The risk of having poor adhesion could probably be completely avoided if the binding is done in a controlled environment. Wet friction was and still is a major obstacle for poroelastic road material. The initial wet friction of the recently produced PERS was more than sufficient. However, the excellent wear resistance of rubber has the adverse effect, that the friction enhancing materials added to the mixes were worn away faster from the surface than the rubber.
A.3 Experiment with poroelastic cover on interlocking blocks in Japan in 2002
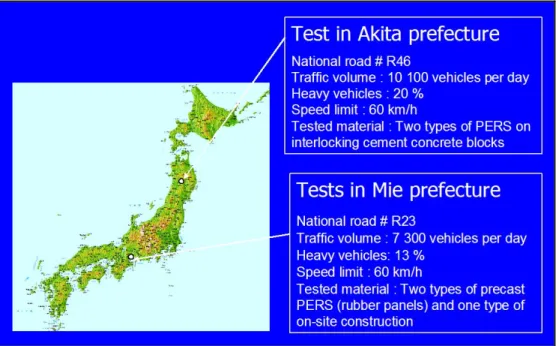
The first field experiment with poroelastic surface in Japan was carried out in the Akita prefecture in northern Japan in October 2002. This experiment was carried out in the town of Tazawako on National Highway R46 which is one of the major north-south highways in northern Japan, carrying a very high proportion (20 %) of heavy vehicles; see Fig. A.1. A total road length of 20 m paved with two types of PERS (10 m of each type) was constructed, with a base structure as shown in Fig. A.2.Figure A.1: Location and background data for Japanese field experiments with PERS. Picture from [1], improved by the authors.
Figure A.2: Base structure of the test in Akita with 30 mm PERS on top of interlocking blocks (ILB). Picture from [1], improved by the authors.
05-FEHRL
Page 6 of 42
Contract TST3-CT-2003-505831 Authors : D. Kokot, B. Kalman, U.
Sandberg
File : D2.2-Technical report-In.2.4-Submitted to approval.doc
The test section is shown in Fig. A.3 and a close-up of the cement concrete blocks with PERS on top are shown in Fig. A.4.
Figure A.3: Test section (darker part) of 20 m length on R46 in Akita.
Figure A.4: Test two types of PERS tested on R46 in Akita. The left one has some recycled plastic particles included, potentially to increase friction.
The subjective difference in noise when standing at the roadside was impressive. However, the test section had some unevenness which could be heard as a rumble inside the car; although the overall subjective noise difference inside the car was also positive. The Japanese measured a noise
05-FEHRL
Page 7 of 42
Contract TST3-CT-2003-505831 Authors : D. Kokot, B. Kalman, U.
Sandberg
File : D2.2-Technical report-In.2.4-Submitted to approval.doc
reduction compared to the conventional Japanese asphalt surface (DAC 0/13) of 6 dB at 50 km/h and 8 dB at 80 km/h, for cars.
Unfortunately, the high volume of heavy traffic on this road soon was noticed in terms of severe rutting on the pavement. It was not any kind of wear or compression of the rubber. Instead, it was a displacement of the intermediate layer of asphalt-coated sand on which the ILB were placed. The sand was pressed up between the ILB and spread along the road.
More about experiments with PERS in Japan and Sweden can be found in [2].
A.4 Identification of key points to improve
In many of the previous experiments the lack of adhesion between poroelastic and underlaying layers was the reason for failures. This is also the reason for choosing a pavement structure where poroelastic layer is layed on concrete (paving) blocks. In this way the critical gluing can be made in more controlled and proper manner and environment.
Taking into account problems and reasons for failure of test fields in Japan, we have identified and selected some key point topics for improvement.
The foundation for the blocks (bedding layer) has to be improved, intending to avoid the Japanese failure. Focus of the improvement has to be put in particular to the drainage of the base layer.
The previous experiments are showing that a friction characteristic of the poroelastic surface still needs to be improved. It is expected that this can be done by adding new friction-enhancing additives to the poroelastic mixture. The friction enhancing material that will be tested will be very hard and wear resistant material. The influence of the hardness of the poroelastic material on the friction properties will also be tested. Recently there have been indications that comparatively hard poroelastic material has better durability of the wet frictional properties compared to soft versions of the material.
B - Research tests plan
As mentioned in [2] all field tests with poroelastic road surfaces were either prematurely terminated due to lack of adhesion between the underlying surfaces or due to wet friction properties being below regulatory limits at some point of the tests. The one exception is the trial in Japan with a block pavement covered with poroelastic material. In that case the test was interrupted due to severe rutting and pavement blocks becoming displaced. Insufficient drainage of the stabilizing sand layer immediately below the paving blocks was a plausible cause for the rutting. However, even if this surface was not forced to be removed due to the rutting, it would most probably not maintain a sufficient wet friction after some months of operation, as the problem with durability of the frictional properties was not solved at that occasion.
The research in this innovation is focused on solving two major problems with this type of surface: • The wet skid resistance must be maintained at an acceptable level for a reasonable operating
time for a typical road condition
• The stability of the system of blocks and stabilizing layer must be sufficient for a reasonable operating time and for a mix of light and heavy vehicles
B.1 Wet skid resistance
A laboratory test scheme was set up to study means for having an interlocking block surface covered with a poroelastic material that (together with the blocks) is both resistant to rutting and has a durable wet friction. For improving the frictional properties, a test will be conducted to study the influence on the durability of friction of binder hardness, addition of silicon carbide to the mix and pre-treatment of the rubber crumb.
05-FEHRL
Page 8 of 42
Contract TST3-CT-2003-505831 Authors : D. Kokot, B. Kalman, U.
Sandberg
File : D2.2-Technical report-In.2.4-Submitted to approval.doc
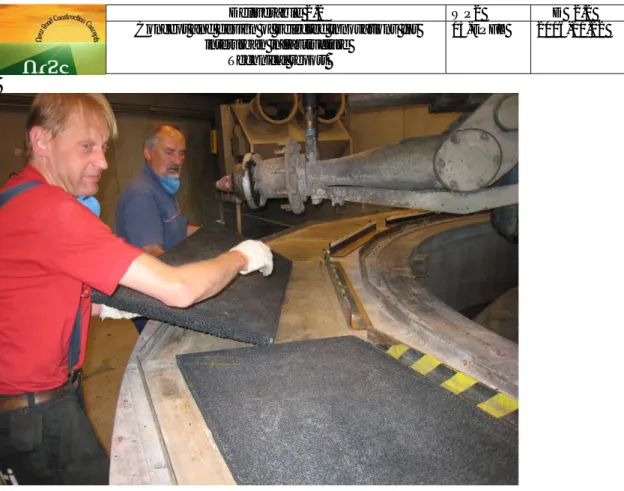
For simulation of the polishing effect of rolling tyres on a road surface, the VTI pavement testing machine will be used. The pavement testing machine is a circular track with a diameter of approximately 5 metres. Four or six wheels are rolling on this surface at a speed up to 70 km/h (see Fig. B.1). The power to the traction of the wheels is delivered by electrical engines attached on each of the wheel axles. The load on each wheel is adjustable but is usually fixed at 450 kg. The wheels do not follow a circular track; rather there is a lateral movement of the wheels to simulate a realistic distribution of wheel paths. The test can be made in dry or wet conditions. When wet conditions are used, fresh water is constantly sprinkled over the surface. The evolution of the friction will be tested with the British Pendulum method and by manually pushed equipment developed at VTI which measures the friction on a partially slipping wheel pushed at a speed of approximately 5 km/h.
Figure B.1: The Pavement Testing Machine at VTI.
In the planned test, the test track in the pavement testing machine will be divided in five different sections. In each section, a different type of mix will be produced. After curing and initial check of friction, stiffness and permeability, the traffic polishing will commence in wet conditions. At regular intervals the friction and rutting will be measured. The test will continue until several years of traffic polishing has been simulated.
B.2 Stability of block pavement
In many of the previous experiments the lack of adhesion between the poroelastic layer and base-layers was the reason for failures. This is also the reason for choosing a pavement structure where poroelastic layer is laid on concrete (paving) blocks. In this way the critical gluing can be made in a more controlled and proper manner and environment.
Taking into account problems and reasons for failure of previous test fields in Japan, the project participants identified and selected a key point topic for further research work at the ZAG institute; namely the foundation for the blocks (bedding layer) has to be improved, intending to avoid the Japanese failure.
05-FEHRL
Page 9 of 42
Contract TST3-CT-2003-505831 Authors : D. Kokot, B. Kalman, U.
Sandberg
File : D2.2-Technical report-In.2.4-Submitted to approval.doc
To solve problems with displacement of the intermediate layer of asphalt-coated sand on which the interlocking blocks in the Japanese tests were placed, ZAG did focus on the bedding layer onto which the cement concrete blocks were placed. The entire pavement structure was designed to be as “strong” as possible to avoid bearing capacity failures, but the intention was also to have it as traditional as possible.
Except for the poroelastic layer, the prepared pavement structures for testing in Slovenia are traditional pavement structures for stone/cement concrete blocks paved on roads in Slovenia, and for preparing them, only the local materials were used.
Four different setups were tested, as illustrated in Figure B.2. First, tests were performed on a structure where cement concrete blocks with a glued poroelastic overlay were placed onto a sand bedding layer. The second test setup was the same only that it included watering of the pavement structure. The third and fourth setups were parallel cases, except that the cement concrete blocks were placed onto a cementitious screed bedding layer.
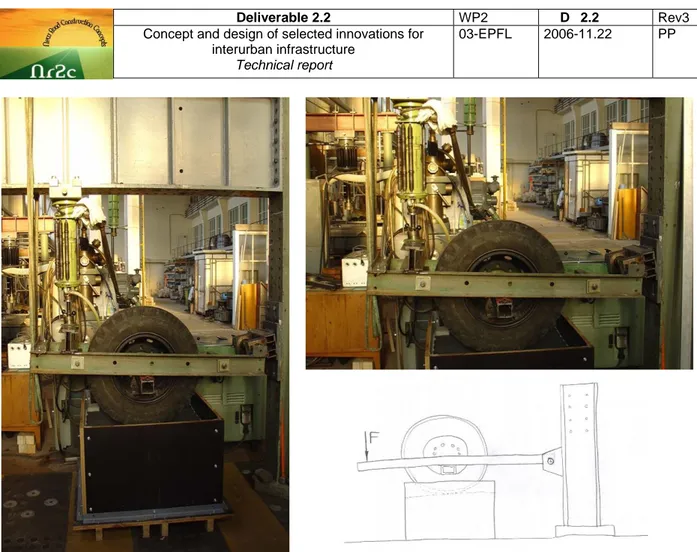
In total there were four test cycles. One cycle consisted of a piston-induced dynamic loading of the test structure, as can be seen in Figure B.3. There were 100,000 vertical loadings applied through a heavy vehicle tire, each time of maximum load of 35 kN. The loading equals 100,000 passes of 140 kN axle load. The vertical displacement of the structure was monitored and followed by three LVDTs, mounted on a framework and placed along the tire.
unbound layer 30 cm asphalt layers 6 + 3 cm sand, bedding course 5 cm cement concrete blocks poroelastic overlay
unbound layer 30 cm asphalt layers 6 + 3 cm sand, bedding course 5 cm cement concrete blocks poroelastic overlay
A) Construction with sand bedding layer B) Sand bedding layer, adding water
unbound layer 30 cm asphalt layers 6 + 3 cm cementitious screed,
bedding course 5 cm cement concrete blocks poroelastic overlay
unbound layer 30 cm asphalt layers 6 + 3 cm cementitious screed,
bedding course 5 cm cement concrete blocks poroelastic overlay
C) Construction with screed bedding layer D) Screed bedding layer, adding water Figure B.2: The four different test setups
05-FEHRL
Page 10 of 42
Contract TST3-CT-2003-505831 Authors : D. Kokot, B. Kalman, U.
Sandberg
File : D2.2-Technical report-In.2.4-Submitted to approval.doc
05-FEHRL
Page 11 of 42
Contract TST3-CT-2003-505831 Authors : D. Kokot, B. Kalman, U.
Sandberg
File : D2.2-Technical report-In.2.4-Submitted to approval.doc
C - Wet skid resistance
C.1 Raw
material
Rubber granules.The maximum density of the rubber granules was determined with the method EN 12697-5. The density was 1.141 g/cm3.
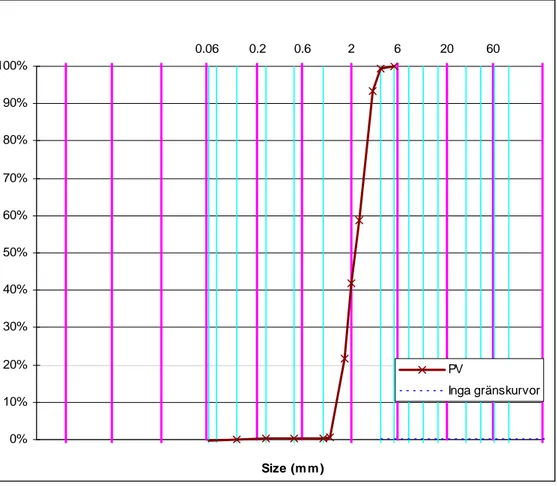
Since the grading curve of the rubber granules proved to be very narrow a combination of a large number sieves with nominal sizes around 1-5 mm was used. The grading curve of the rubber granules is presented in figure C.1. The sizes of the granules ranged from 1.4 mm to 4.0 mm.
0.06 0.2 0.6 2 6 20 60 0% 10% 20% 30% 40% 50% 60% 70% 80% 90% 100% Size (m m ) PV Inga gränskurvor
Figure C.1: Grading curve of the rubber granules (PV). Hardened rubber granules
The hardness of tire rubber is usually about 50-60 Shore A. The hardness of the rubber could to some extent be adjusted to higher values if the rubber is artificially aged. In order to check the influence of rubber hardness towards the durability to friction, a part of the rubber granules were artificially aged in a forcefully ventilated oven at 90°C for 12 hours. The granules were kept in 5 L buckets without lids. The granules were noticeable harder but the hardness could not be checked with a shore meter as the granules are too small to make any measurement with a conventional Shore meter meaningful. Polyurethane
Two types of polyurethane binders were tested..
The first one, Flexilon 1109, is a prepolymerized MDI polyurethane produced by Rosehill Ltd. UK. The density of this binder is 1.10g/cm3 and the hardness of the cured product matches the hardness of rubber, e.g. approximately 60 Shore A. This binder is referred to as the soft binder in this report.
05-FEHRL
Page 12 of 42
Contract TST3-CT-2003-505831 Authors : D. Kokot, B. Kalman, U.
Sandberg
File : D2.2-Technical report-In.2.4-Submitted to approval.doc
The other product tested, was specially produced for our tests. The Swedish representative for Lagomat/Elastogran/BASF. The product was a two component polyurethane binder with a design hardness of the cured product of approximately 90 Shore A. This specially formulated product didn’t have any name and is referred to as the hard binder, in this paper.
Catalyst
A substituted morpholine compound was used as catalyst to decrease the curing time. Friction enhancing material
Silicon carbide, or carborundum, was used to improve the wet friction of the poroelastic material. The material was delivered from Saint Gobain Abrasives. The product used was SIKA ABR IV F150 i.e. the carborundum granules passed a 0.104 mm sieve. The density of the material is 3.22 g/cm3.
C.2 Production of test material
The production of the test materials were done mixing all compounds in a single mixing pot followed by curing in a mould with a fixed volume. Having précis control of the amount of the mixed material and their densities enabled us to tune the air void content to the design value of 21%. The design value for the air void content was chosen to be rather low to what is possible, but since the purpose of the experiment polishing and the durability of wet friction, a high air void content could give less wear resistance and thus jeopardize the aim of the experiment.
05-FEHRL
Page 13 of 42
Contract TST3-CT-2003-505831 Authors : D. Kokot, B. Kalman, U.
Sandberg
File : D2.2-Technical report-In.2.4-Submitted to approval.doc
Figure C.3: Production of test material.
05-FEHRL
Page 14 of 42
Contract TST3-CT-2003-505831 Authors : D. Kokot, B. Kalman, U.
Sandberg
File : D2.2-Technical report-In.2.4-Submitted to approval.doc
Figure C.5: Production of test material. Mounting the material in the PVM.
The following mixes were produced: Number &
Name Rubber Binder Rubber content
%(w/w) Binder content %(w/w) Silicon carbide content %(w/w) 2 Hard, reference
Un-aged Hard, two
component 79 21 -
4 Hard, abrasive
Un-aged Hard, two
component 65 16 19
5 Hard abrasive and
aged
Aged Hard, two
component 65 16 19
6 Soft, abrasive
Un-aged Soft, one
component 65 16 19
1 Rosehill abrasive
Not available Not available Not
available available Not Not available
Two plates, A and B, were produced of each mix type and mounted in the PVM for polishing and wear tests.
05-FEHRL
Page 15 of 42
Contract TST3-CT-2003-505831 Authors : D. Kokot, B. Kalman, U.
Sandberg
File : D2.2-Technical report-In.2.4-Submitted to approval.doc
C.3 Test
description
Pavement testing machine PVMThe VTI Pavement testing machine (PVM) is a circular test track with a track diameter of 5.25 m. The machine can be used to do accelerated tests of tire road interactions. The machine has been used for accelerated road wear studies, accelerated traffic polishing studies and studies of emissions of particulate matters form tire road interaction etc. In this study the intention is to focus on traffic polishing, but wear will also be an issue. The wheels in the PVM are driven by electrical engines. Beside the circular movement of the wheels, there are also lateral movements of the wheel, to make the wheel tracks more realistic.
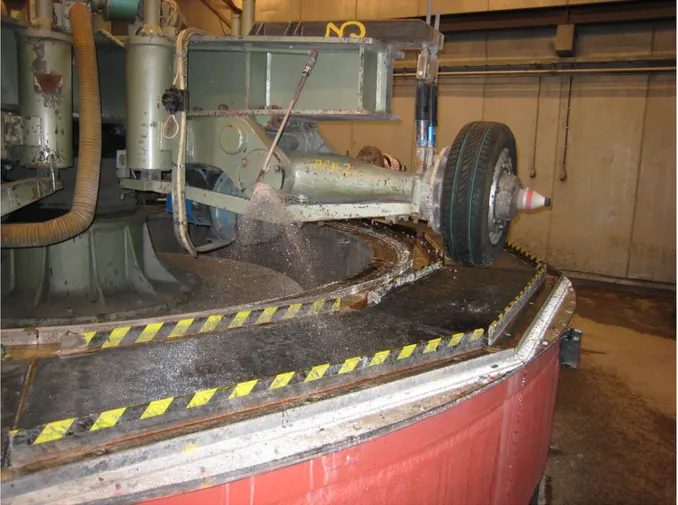
During the test water was sprinkled over the surface with a rate of 6-8 L/minute, see figure C.6.
Figure C.6: The surfaces were sprinkled with water @ 6-8 L/minute during the accelerated traffic polishing tests.
The air temperature in the test hall was kept at 10-12°C during the tests. The PVM was fitted with four wheels with the dimensions 185/65 R15. The tires were inflated to a pressure of 2.5 bar. Each tire was pushed against the road surface with a load equal to 450 kg. Two types of tires were used. For the first 102 000 revolutions Nokian Nrhi tires was used. These tires are of normal summer type. After the first 102 000 revolutions the tires were shifted to Nokian Hakkapelitta Q tires and the PVM run for another 50 700 revolutions. These tires are used in winter time in the Nordic countries but they are not fitted with studs, rather the grip is accomplished with softer rubber composition in the tread and more sipes in the tread pattern. Such tires are commonly referred to as “friction tires”. The purpose of shifting the tires was to see if the tire type had a decisive role for the traffic polishing effect.
The speed was kept at 60 km/h for the first 23 000 revolutions but was then increased to 70 km/h. Higher speed increase the traffic polishing effect and the wear of the tires per revolution.
05-FEHRL
Page 16 of 42
Contract TST3-CT-2003-505831 Authors : D. Kokot, B. Kalman, U.
Sandberg
File : D2.2-Technical report-In.2.4-Submitted to approval.doc
Friction tests
Friction coefficients was measured with a device developed at VTI called the Portable Friction Tester, PFT. The friction was measured on wet surfaces. The PFT is a small device, weighing 38 kg, which is pushed by the operator, see figure C.4, and measures the friction coefficient for a wheel at constant slip, i.e. the measuring wheel is rotating at a lower speed relative the road surface than the device traction wheels. The measuring wheel has a slip of 21%, i.e. the measuring wheel is rotating at 21% of the speed of the device traction wheels. The friction coefficient is measured at normal walking speed. In Sweden, the wet friction coefficient should be above 0.5, although the device for measuring the normative friction coefficient is not the same as the PFT, rather a full size car equipped with a fifth measuring wheel. Friction was measured on the poroelastic material in the rolling direction of the PVM.
Figure C.7: The Portable Friction Tester used for measuring the wet friction coefficient at walking speed on the poroelastic surfaces. In the figure the PFT is placed with the measuring wheel on a road marking.
C.4 Results
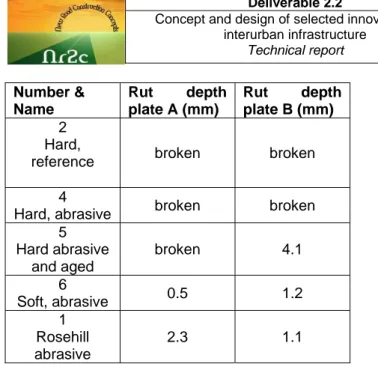
The accelerated test was performed for in total 152 700 revolutions, i.e. the surfaces was run over by a tire for 610 800 times. The first 23 000 revolutions were done at 60 km/h and the rest at 70 km/h. Initially and at seven intervals the machine was stopped and the friction coefficient was measured in the rolling direction of the wheels, with the PFT. Already at the first stop at 23 000 revolutions both plates of one surface and one plate of another surface was broken down. There were tendencies on some of the other test plates that some of the material wasn’t durable enough. At the second stop at 45 000 revolutions there was in total 2 sections that was broken down and one plate of another section that was broken, see figure C.5 for an example of a broken test plate. From there and onwards the remaining plates were intact except for some wearing. All broken plates had to be replaced with dummy plates not to prevent the wheels to jump up and down when they passed the broken part of the track. At the end of the experiment the rut depth was measured with a straight edge. The rut depths are presented in table C.1.
05-FEHRL
Page 17 of 42
Contract TST3-CT-2003-505831 Authors : D. Kokot, B. Kalman, U.
Sandberg
File : D2.2-Technical report-In.2.4-Submitted to approval.doc Number & Name Rut depth plate A (mm) Rut depth plate B (mm) 2 Hard,
reference broken broken
4
Hard, abrasive broken broken
5 Hard abrasive and aged broken 4.1 6 Soft, abrasive 0.5 1.2 1 Rosehill abrasive 2.3 1.1
Table C.1: Rut depth at the end of the accelerated testing in the PVM.
Figure C.8: Broken plate at after 23 000 revolutions in the PVM. The friction coefficients are presented in table C.2.
05-FEHRL
Page 18 of 42
Contract TST3-CT-2003-505831 Authors : D. Kokot, B. Kalman, U.
Sandberg
File : D2.2-Technical report-In.2.4-Submitted to approval.doc # revo- lutions Plate number 0 23000 45000 65000 102000 120000 152700 175650 2 A 0.65 B 0.58 4 A 0.55 0.58 B 0.56 5 A 0.97 0.73 0.97 0.73 0.97 0.73 0.97 0.73 B 0.55 0.67 0.69 0.69 0.72 0.82 0.83 0.87 6 A 1.14 1.05 1.08 1.00 0.95 1.00 0.92 0.95 B 1.04 1.00 1.06 1.03 0.95 1.03 0.99 1.05 1 A 0.72 0.95 0.96 0.91 0.88 0.92 0.94 0.94 B 0.87 1.03 1.04 1.03 0.97 0.99 1.00 1.00
Table C.2: Evolution of wet friction coefficient in the accelerated polishing test. At 102 000 revolutions the tires were shifted from regular summer tires to friction tires.
The friction coefficients presented in table C.2 for the material with silicon carbide additions are very high. It is also obvious from the table that that the silicon carbide addition did give the poroelastic material a lasting wet friction and the polishing action of the tires was weak for silicon carbide.
Some of the material had a very poor wear resistance and that the artificial ageing of the rubber only made poroelastic material perform worse. The best performing materials were the material produced by Rosehill with addition of abrasive material and the material produced with a soft one component binder with silicon carbide as friction enhancing material.
05-FEHRL
Page 19 of 42
Contract TST3-CT-2003-505831 Authors : D. Kokot, B. Kalman, U.
Sandberg
File : D2.2-Technical report-In.2.4-Submitted to approval.doc
D - Stability of block pavement
D.1 Pavement
structure
and
materials characteristics
The pavement structure can be seen from Figure D.1. Poroelastic material was cut in the shape of the cement concrete blocks and glued to them. Blocks were placed into a bedding layer (send or cementitious screed, 5 – 6 cm), that was laid onto two asphalt layers (6 + 3 cm). At the bottom of the structure there was laid the unbound layer (30 cm).
Figure D.1: Structure of the tested pavement
D.1.1 Poroelastic cover on cement concrete blocks
The poroelastic material that was used is named “Tokai” and is in more detail described in the EU-project SILVIA report no. SILVIA-VTI-005-02-WP4-141005 [3]. Originally it was prefabricated in rubber panels 1×1m2 and imported from Japan. The same material was used for testing at the test site in a residential area in Stockholm.
The panel thickness is of 30 mm and it is made of the rubber fibres. A polyurethane type binder was used as a binder for the mix. On the underside the panels have a square mesh (200×200 mm) of drainage channels.
From panels there were pieces of the poroelastic material cut in the wavy shape of cement concrete blocks. The shape, a concrete block with poroelastic cover and blocks assembly can be seen in Figures D.2 and D.3.
Figure D.2: Concrete block with poroelastic cover
unbound layer asphalt
cement concrete blocks poroelastic overlay
asphalt layers bedding layer cement concrete blocks poroelastic overlay
05-FEHRL
Page 20 of 42
Contract TST3-CT-2003-505831 Authors : D. Kokot, B. Kalman, U.
Sandberg
File : D2.2-Technical report-In.2.4-Submitted to approval.doc
Figure D.3: Concrete blocks assembly
The cut poroelastic material was glued to the standard commercial cement concrete blocks. The wavy shaped piece of block is 60 mm thick, and it can be seen in Figure D.2.
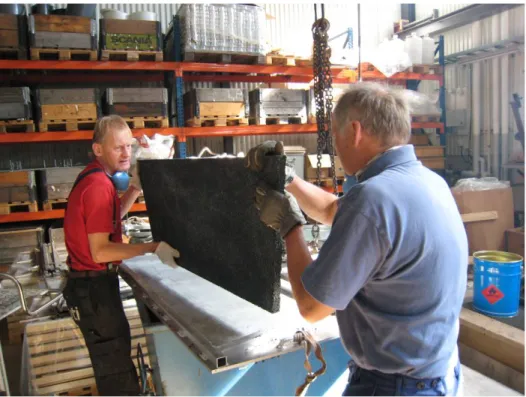
The lack of adhesion between the poroelastic layer and base-layers was the reason for failures in many of the previous experiments. This led to decision to do the critical gluing in a more controlled and proper manner and environment – in a laboratory. The poroelastic material was glued to concrete blocks using a mixture of the two epoxy based adhesives.
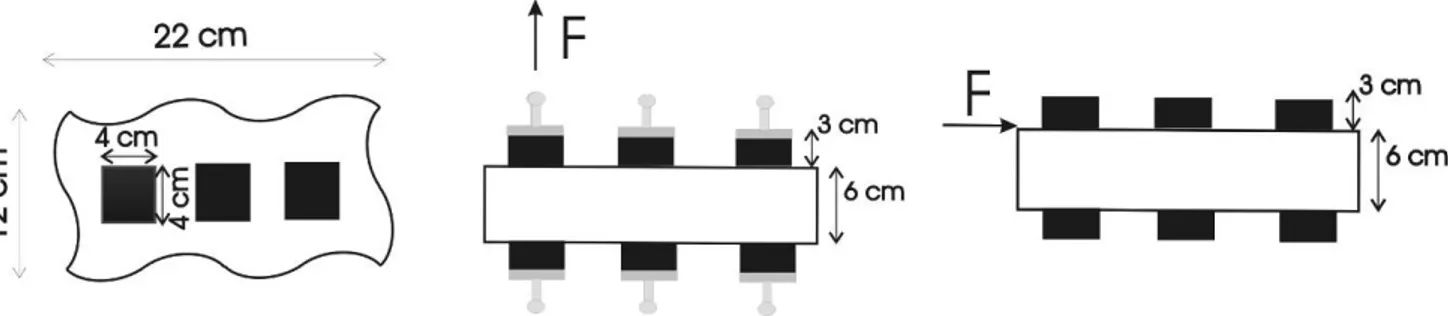
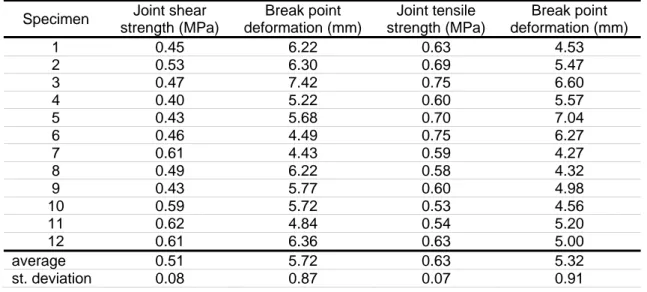
The mechanical properties - tensile strength and shear strength - of the new adhesive were tested before gluing the pieces together. For each test two samples were prepared as shown in Figure D.4. For determining the shear strength, the joint between a piece of poroelastic material and concrete block was loaded in longitudinal direction. For determining the tensile strength, the samples were torn apart using the steel caps that were additionally glued to pieces of poroelastic material.
Figure D.4: Specimen for testing adhesive mechanical properties
The test samples were cured for 72 hours in laboratory conditions (23°C, 50 % r.h.). A testing machine ZWICK Z100 was used for loading specimens, with a rate of loading of 10 mm/min.
05-FEHRL
Page 21 of 42
Contract TST3-CT-2003-505831 Authors : D. Kokot, B. Kalman, U.
Sandberg
File : D2.2-Technical report-In.2.4-Submitted to approval.doc
Specimen Joint shear strength (MPa) Break point deformation (mm) Joint tensile strength (MPa) Break point deformation (mm) 1 0.45 6.22 0.63 4.53 2 0.53 6.30 0.69 5.47 3 0.47 7.42 0.75 6.60 4 0.40 5.22 0.60 5.57 5 0.43 5.68 0.70 7.04 6 0.46 4.49 0.75 6.27 7 0.61 4.43 0.59 4.27 8 0.49 6.22 0.58 4.32 9 0.43 5.77 0.60 4.98 10 0.59 5.72 0.53 4.56 11 0.62 4.84 0.54 5.20 12 0.61 6.36 0.63 5.00 average 0.51 5.72 0.63 5.32 st. deviation 0.08 0.87 0.07 0.91
Table D.1: The results of the shear and tensile strength tests
At both tests and with all the specimens, the weakest point was the poroelastic material. In all cases the breakdown happened in the poroelastic piece, whereas the joints between poroelastic material and concrete block remained in good conditions. The failure was in poroelastic material and not in the adhesive.
When the pavement construction was prepared and the concrete blocks with poroelastic cover laid into the bedding layer, dry siliceous sand 0/2 mm was used to fill the spacing between each block and spacing between block assembly and the wooden mould.
D.1.2 Bedding layer
As a bedding layer there were two options chosen. First option was to lay the concrete blocks in the sand 0/4 mm layer, the second one was to lay them in the cementitious screed layer.
The grading of the sand aggregate (according to EN 993-1) that was used for the bedding layer can be seen from Table D.2.
% passing
Sieve size (mm) 8 4 2 1 0.71 0.50 0.25 0.125 0.090 0.063
Sand 0/4 100 99 76 45 33 29 18 12 10 9.3
Table D.2: Grading of the sand bedding layer
Five samples of the sand aggregate were taken to determine the moisture content. It was found out that the moisture content varied between 6.73 % and 7.72 %.
For the cementitious screed layer, another commercial product was chosen. To make water run through the top layers to the surface of asphalt layer and again over it away from the pavement, we have chosen a PflasterDrainmörtel GK 4 (porous mortar) product from Baumit company as the bedding layer for concrete blocks. The product was prepared and laid into the pavement according to the manufacturer’s directions.
Five samples of the screed were taken to determine the moisture content. It was found out that the moisture content varied between 4.36 % and 5.95 %.
05-FEHRL
Page 22 of 42
Contract TST3-CT-2003-505831 Authors : D. Kokot, B. Kalman, U.
Sandberg
File : D2.2-Technical report-In.2.4-Submitted to approval.doc
D.1.3 Asphalt layers
There were two layers placed into the pavement structure: asphalt concrete BB 8 of 3 cm layer over bituminous well graded crushed stone BD 22s layer (or asphalt concrete base layer; 6 cm). Characteristics of the constituent materials were tested and measured. The results are shown in the following tables.
The characteristics of the binder that was used in different mixes can be seen from Table D.3 .
Binder type bitumen B50/70 bitumen B70/100
Layer Bituminous crushed stone BD 22s Asphalt concrete BB 8
Ball and ring test (°C) 51.2 46.2
Penetration (mm/10) 53.0 86.0
Index of penetration -0.8 -0.9
Table D.3: Characteristics of binder in the asphalt mixes
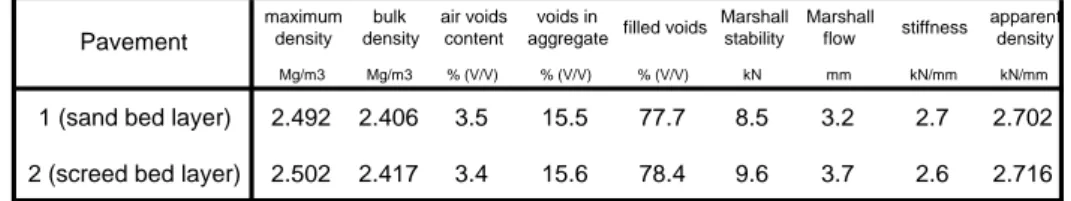
Table D.4 shows the soluble binder content (according to EN 12697-1) and particle size distribution of mineral aggregates (according to EN 12697-2) in BB 8 asphalt concrete. Similar aggregates were used to prepare asphalt concrete mixes for both pavements: the one with sand bedding layer and the second one with the cementitious screed bedding layer. In Table D.5 there are shown other measured characteristics of the same mixes: maximum density (EN 12697-5), bulk density (EN 12697-6), air voids content (EN 12697-8), percentage of voids in the mineral aggregate (EN 12697-8), percentage of voids in the mineral aggregate filled with binder (EN 12697-8), Marshall stability (EN 12697-34), Marshall flow (EN 34), stiffness (EN 34) and apparent density of aggregate (EN 12697-5).
Table D.4: Particle size distribution and binder content in BB 8 mix
Table D.5: Characteristics of BB 8 mix
Figure D.5 shows the average grading curve for both pavements: the one with sand bedding layer and the second one with the cementitious screed bedding layer.
0,09 0,25 0,71 2.0 4.0 8.0 11.2 16.0 22,4 31,5 45,0
% (m/m) % (m/m) % (m/m) % (m/m) % (m/m) % (m/m) % (m/m) % (m/m) % (m/m) % (m/m) % (m/m) % (m/m)
1 (sand bed layer) 5.1 12.0 16.7 26.9 48.2 62.6 99.3 100.0 100.0 100.0 100.0 100.0
2 (screed bed layer) 5.2 12.4 18.0 29.0 52.3 65.3 98.7 100.0 100.0 100.0 100.0 100.0
Binder content
Pavement
Passing / Sieve (mm)
Mg/m3 Mg/m3 % (V/V) % (V/V) % (V/V) kN mm kN/mm kN/mm
1 (sand bed layer) 2.492 2.406 3.5 15.5 77.7 8.5 3.2 2.7 2.702
2 (screed bed layer) 2.502 2.417 3.4 15.6 78.4 9.6 3.7 2.6 2.716
Marshall flow stiffness apparent density Pavement maximum density bulk density air voids content voids in
aggregate filled voids Marshall
05-FEHRL
Page 23 of 42
Contract TST3-CT-2003-505831 Authors : D. Kokot, B. Kalman, U.
Sandberg
File : D2.2-Technical report-In.2.4-Submitted to approval.doc Asphalt concrete BB 8 63 45 31,5 22,4 16 11,2 8 4 2 0,71 0,25 0,09 0 10 20 30 40 50 60 70 80 90 100 0 sieve [ mm ] p a ss in g [ % ( m /m )]
upper limit lower limit average design
Figure D.5: Grading curve for BB 8 mix
Table D.6 shows the soluble binder content and particle size distribution of mineral aggregates in BD 22s bituminous well graded crushed stone. Similar aggregates were used to prepare BD 22s mixes for both pavements: the one with sand bedding layer and the second one with the cementitious screed bedding layer. In Table D.7 other measured characteristics of the same mixes are shown: maximum density, bulk density, air voids content, percentage of voids in the mineral aggregate, percentage of voids in the mineral aggregate filled with binder, Marshall stability, Marshall flow, stiffness and apparent density of aggregate. The different tests were performed according to the same standards as for BB 8 mix.
Table D.6: Particle size distribution and binder content in BD 22s mix
Table D.7: Characteristics of BD 22s mix
Figure D.6 shows the average grading curve for both pavements: the one with sand bedding layer and the second one with the cementitious screed bedding layer.
0,09 0,25 0,71 2.0 4.0 8.0 11.2 16.0 22,4 31,5 45,0
% (m/m) % (m/m) % (m/m) % (m/m) % (m/m) % (m/m) % (m/m) % (m/m) % (m/m) % (m/m) % (m/m) % (m/m)
1 (sand bed layer) 3.3 6.1 9.2 15.4 29.1 40.6 55.9 66.7 77.6 98.9 100.0 100.0
2 (screed bed layer) 3.5 6.9 9.6 14.5 28.6 44.5 60.8 71.8 84.5 100.0 100.0 100.0 Pavement
Binder content
Passing / Sieve (mm)
Mg/m3 Mg/m3 % (V/V) % (V/V) % (V/V) kN mm kN/mm kN/mm
1 (sand bed layer) 2.556 2.389 6.5 14.3 54.2 9.4 3.0 3.1 2.694
2 (screed bed layer) 2.549 2.391 6.2 14.4 56.8 14.0 3.1 4.5 2.696
stiffness apparent density Pavement maximum density bulk density air voids content voids in
aggregate filled voids Marshall
stability Marshall
05-FEHRL
Page 24 of 42
Contract TST3-CT-2003-505831 Authors : D. Kokot, B. Kalman, U.
Sandberg
File : D2.2-Technical report-In.2.4-Submitted to approval.doc
Bituminous crushed stone BD 22s
0,09 0,25 0,71 2 4 8 11,2 16 22,4 31,5 45 63 0 10 20 30 40 50 60 70 80 90 100 0 sieve [ mm ] p a ssi n g [ % (m /m )]
upper limit lower limit average design
Figure D.6: Grading curve for BD 22s mix
D.1.4 Unbound layer
For the unbound layer the crushed stone aggregate 0/32 mm was used. The grading of this mineral aggregate can be seen from Table D.8. The fines content of the aggregate is 4 %. The tests were performed according to EN 993-1.
% passing
Sieve (mm) 63 45 31.5 22.4 16 11.2 8 4 2 0.71 0.25 0.090 0.063
Sand 0/4 100 94 92 78 65 53 43 29 19 10 6 4 4.0
Table D.8: Particle size distribution of the mineral aggregate for unbound layer
Table D.9 shows some other characteristics of the aggregate that were also determined: geometrical properties (flakiness index – according to EN 993-3, and shape index – according to EN 993-4), fines content, sand equivalent (EN 993-8) and methylene blue test results (EN 993-9), Los Angeles coefficient (EN 1097-2), micro Deval (EN 1097-1), particle density and water absorption (EN 1097-6). Five samples of the unbound material were taken to determine the moisture content. It was found out that the moisture content varied between 2.94 % and 4.03 % when the first pavement with sand bedding layer was prepared, and that the moisture content varied between 2.23 % and 2.81 % when the second pavement with screed bedding layer was prepared.
05-FEHRL
Page 25 of 42
Contract TST3-CT-2003-505831 Authors : D. Kokot, B. Kalman, U.
Sandberg
File : D2.2-Technical report-In.2.4-Submitted to approval.doc Geometrical properties Flakiness index % 17 Shape index % 18 Fines content % 4 Assessment of fines
Sand equivalent test % 45
Methylene blue test g/kg 1.4
Resistance to fragmentation
(Los Angeles coef) % 24
Resistance to wear
(micro Deval) % 9
Particle density and water absorption
ρ Mg/m3
2.71 WA
24 % 0.4
Table D.9: Characteristics of the mineral aggregate for unbound layer
D.2 Preparation of test pavements
For the testing purpose a special wooden mould (1.0 m×1.0 m×0.7 m) was prepared. The mould is shown in Figure D.7. First, two 15 cm layers of unbound material were laid into the mould. Both layers were mechanically compacted, but because of the mould’s limited dimensions (1 m2) this showed up to be a very difficult job to do. Nevertheless, we were able to compact the layers to about 96 % (from 95.3 to 97.35 %). The measured moisture content varied from 1.40 % to 1.95 %. Both, the degree of compaction and the moisture content were measured by a nucleodensimeter.
Preparation of the pavement is shown in Figures D.7 to D.9.
Figure D.7: Wooden mould and compaction control
On the unbound layer, the two asphalt layers were placed, on which the bedding layer was laid (sand or cementitious screed). Finally, into the bedding layer the cement concrete blocks with poroelastic cover were placed. All spaces between blocks and spaces between block assembly and the mould margins were filled with dry siliceous sand. While testing the pavements it helped the load to distribute easier among concrete blocks and to limit the load effect on the pavement.
05-FEHRL
Page 26 of 42
Contract TST3-CT-2003-505831 Authors : D. Kokot, B. Kalman, U.
Sandberg
File : D2.2-Technical report-In.2.4-Submitted to approval.doc
Figure D.8: Compaction of asphalt layers and placement of cement concrete blocks with poroelastic cover on bedding layer (sand in this case)
Figure D.9: The test construction is finished
D.3 Test
setup
D.3.1 Testing procedure
Four different setups were tested on two different pavement structures, as illustrated in Figure B.2. First, one test cycle was performed on a structure where the concrete blocks were placed onto a sand bedding layer. The second test setup was the same as the first one (with the same pavement) only that it included watering of the pavement structure. The third and fourth setups were parallel cases, except that the cement concrete blocks were placed onto a cementitious screed bedding layer.
In total there were four test cycles. One test cycle consisted of a hydraulic piston-induced dynamic loading of the test structure, as can be seen in Figure B.3. There were 100,000 vertical loadings applied through a heavy vehicle tire, each time of maximum load of 35 kN. The loading equals 100,000 passes of 140 kN axle load. In total, 200,000 loading cycles (100,000 cycles without watering and another 100,000 cycles with watering the pavement) were applied to each of two pavement
05-FEHRL
Page 27 of 42
Contract TST3-CT-2003-505831 Authors : D. Kokot, B. Kalman, U.
Sandberg
File : D2.2-Technical report-In.2.4-Submitted to approval.doc
structures. When preparing the second pavement, the same concrete blocks were used. The blocks were rearranged in a way that the blocks on which the load was applied (central blocks) were moved to outer position and vice versa. In this way a 200,000 load cycles were applied to the same group of blocks.
The frequency of applying the load to the pavement surface was of 0.25 Hz. One loading cycle was performed in about 4 seconds, with minimal loading of 5 kN ad maximal loading of 35 kN. The vertical displacement of the structure was monitored and followed by three LVDT sensors, mounted on a framework and placed along the test tire.
Figure D.10 shows a close-up of the LVDT sensors, which are positioned next to the test tire and as much as possible close to it. One sensor was located to a transversally placed block (in the following figures referred to as sensor L1), two of them to a vertically placed block (sensors L2 and L3).
The test tire was inflated according to manufacturer’s directions up to the pressure of 7 bar.
Figure D.10: LVDT sensors next to test tire
D.3.2 Watering pavements
In the second and fourth test setup, water was poured into the pavement. The amount of water was defined to reflect the average amount of rainfall in the area of Slovenia’s capitol, Ljubljana. It was decided to simulate two different rain variants: first, a light rain that reflects the average daily amount of rain in a year, and the second one, a heavy rainfall. The average daily amount of rain in last years was 8 litres of water per 1 m2, and it was poured into the pavement in 8 hours, 1 litre in the beginning of each hour. The heavy rain equals to 45 litres of water poured into the pavement (1 m2 area) in 30 minutes.
For both pavements, the watering was done in three cycles: during first 20,000 loading cycles a light rain was simulated, after about 40,000 and 60,000 loading cycles two heavy rains were simulated. The water was free to run-off the pavement surface or to move through the pavement. Figure D.11 shows containers and utensils for capturing the run-off or run-through water. In the same figure a part of the test tire and the frame with LVDT sensors mounted on it can be seen.
05-FEHRL
Page 28 of 42
Contract TST3-CT-2003-505831 Authors : D. Kokot, B. Kalman, U.
Sandberg
File : D2.2-Technical report-In.2.4-Submitted to approval.doc Water added 8 l light rain 45 l heavy rain 45 l heavy rain 98 l all
Table D.10: Characteristics of the mineral aggregate for unbound layer
Figure D.11: Test assembly
98 litres of water was the total amount that was poured into each of the two pavements. The water was captured at three levels: at the pavement surface, at the surface of asphalt layers and at the bottom of pavement construction.
When performing the tests it was supposed that the “real” pavement, made on site, would have good drainage system helping water run off and away of the pavement.
05-FEHRL
Page 29 of 42
Contract TST3-CT-2003-505831 Authors : D. Kokot, B. Kalman, U.
Sandberg
File : D2.2-Technical report-In.2.4-Submitted to approval.doc
D.4 Results
D.4.1 Pavements deformation
When testing the pavements, the cycles and the deformation (deflections) resulting from loading the pavements, were recorded. Due to the hydraulic piston restraints, the loading procedure was to load the pavements with load varying from 5 kN to 35 kN every 4 seconds. For one of the LVDT sensors, the typical results with varying deflections can be seen from Figure D.12. On the right side of figure, the test results of the pavement that was watered are presented. Due to the loading procedure, the results are in shape of band instead of a line. The upper envelope of the band represents deflections as a result of maximal loading of 35 kN. For further analyses these envelopes were extracted and are represented in the following figures.
Figure D.12: Typical results
Figures D.13 to D.16 show the results for each of the four test setups: the pavement with sand bedding layer (pavement 1), the same pavement into which the water was poured into during the testing, the pavement with screed bedding layer (pavement 2), and again the same pavement that was watered. On each figure there are three lines, representing the result of deflection measurements of each of the three LVDT sensors. The sensors position can be seen from Figure D.24.
PAVEMENT STRUCTURE 1 0,0 0,1 0,2 0,3 0,4 0,5 0,6 0,7 0,8 0,9 1,0 1,1 1,2 0 10000 20000 30000 40000 50000 60000 70000 80000 90000 100000 Cycles D e fl e c ti o n (m m ) Sensor: L1 (1) L2 (1) L3 (1)
05-FEHRL
Page 30 of 42
Contract TST3-CT-2003-505831 Authors : D. Kokot, B. Kalman, U.
Sandberg
File : D2.2-Technical report-In.2.4-Submitted to approval.doc
PAVEMENT STRUCTURE 1 + WATER
0,0 0,1 0,2 0,3 0,4 0,5 0,6 0,7 0,8 0,9 1,0 1,1 1,2 0 10000 20000 30000 40000 50000 60000 70000 80000 90000 100000 Cycles D e fl e c ti o n (m m ) Sensor: L1 (1+W) L2 (1+W) L3 (1+W)
Figure D.14: Results for tests on pavement with sand bedding layer, and simulating rain
PAVEMENT STRUCTURE 2 0,0 0,1 0,2 0,3 0,4 0,5 0,6 0,7 0,8 0,9 1,0 1,1 1,2 0 10000 20000 30000 40000 50000 60000 70000 80000 90000 100000 Cycles D e fl e c ti o n (m m ) Sensor: L1 (2) L2 (2) L3 (2)
05-FEHRL
Page 31 of 42
Contract TST3-CT-2003-505831 Authors : D. Kokot, B. Kalman, U.
Sandberg
File : D2.2-Technical report-In.2.4-Submitted to approval.doc
PAVEMENT STRUCTURE 2 + WATER
0,0 0,1 0,2 0,3 0,4 0,5 0,6 0,7 0,8 0,9 1,0 1,1 1,2 0 10000 20000 30000 40000 50000 60000 70000 80000 90000 100000 Cycles D e fl e c ti o n (m m ) Sensor: L1 (2+W) L2 (2+W) L3 (2+W)
Figure D.16: Results for tests on pavement with screed bedding layer, and simulating rain From figures D.13 to D.16 it can be seen that the levels of deflections measured by sensors are considerably closer each to other by the pavement with screed bedding layer (porous mortar) than by the sand bedding layer pavement. This is attributed to higher stiffness and compactness of the screed layer, compared to the sand layer. Although the concrete blocks were laid into the sand layer and compacted as much as possible, it seems that the load applied to the pavement was distributed much more uniformly to lower layers through the screed bedding layer than through the sand layer.
When looking at the results for sand bedding layer pavement and comparing the deflections registered by sensor L1 to deflections by sensors L2 and L3, it can be seen that the first sensor values vary between the values of the remaining two. Since these two sensors were located to the opposite ends of the same block, we can find out that the bedding layer of this block was deformed much more at one end than at the other. There was almost no such effect with the pavement with screed bedding layer. Deflections of the concrete blocks on screed bedding layer were relatively very uniform.
05-FEHRL
Page 32 of 42
Contract TST3-CT-2003-505831 Authors : D. Kokot, B. Kalman, U.
Sandberg
File : D2.2-Technical report-In.2.4-Submitted to approval.doc SENSOR L1 0,0 0,1 0,2 0,3 0,4 0,5 0,6 0,7 0,8 0,9 1,0 1,1 1,2 0 20000 40000 60000 80000 100000 120000 140000 160000 180000 200000 Cycles D e fl ect io n ( mm) Sensor: L1 (1) L1 (1+W) L1 (2) L1 (2+W)
Figure D.17: Cumulative results for LVDT sensor L1
SENSOR L2 0,0 0,1 0,2 0,3 0,4 0,5 0,6 0,7 0,8 0,9 1,0 1,1 1,2 0 20000 40000 60000 80000 100000 120000 140000 160000 180000 200000 Cycles D e fl e c ti o n (m m ) Sensor: L2 (1) L2 (1+W) L2 (2) L2 (2+W)
05-FEHRL
Page 33 of 42
Contract TST3-CT-2003-505831 Authors : D. Kokot, B. Kalman, U.
Sandberg
File : D2.2-Technical report-In.2.4-Submitted to approval.doc SENSOR L3 0,0 0,1 0,2 0,3 0,4 0,5 0,6 0,7 0,8 0,9 1,0 1,1 1,2 0 20000 40000 60000 80000 100000 120000 140000 160000 180000 200000 Cycles D e fl e c ti o n (m m ) Sensor: L3 (1) L3 (1+W) L3 (2) L3 (2+W)
Figure D.19: Cumulative results for LVDT sensor L3
The results from all three sensors show that the pavement with screed bedding layer was deformed under load applied more than the pavement with sand bedding layer for first 100,000 cycles. From that point on, the trend changed radically and deflections of the screed bedding layer pavement stayed almost at the same level throughout next 100,000 loading cycles, like the screed has hardened and the layer was compacted to its maximal state. Contrary, the deflections of sand bedding layer pavement increased for all the loading time ending with the deflections (much) higher than by the other pavement.
Tables D.11 to D.14 show the deflections at the beginning of loading and at the end of loading the pavement, minimal, maximal and the range of different pairs of deflections.
Bedding layer: sand; deflections in mm
LVDT L1 range L2 range L3 range
start 0.30 0.37 0.31 0.48 0.26 0.30 end 0.67 0.79 0.56 min 0.30 0.37 0.31 0.48 0.26 0.30 max 0.67 0.79 0.56
Table D.11: First pavement: ranges of deflections Bedding layer: sand; watering; deflections in mm
LVDT L1 range L2 range L3 range
start 0.67 0.25 0.80 0.30 0.56 0.34 end 0.92 1.10 0.90 min 0.67 0.31 0.79 0.37 0.56 0.39 max 0.98 1.16 0.95
05-FEHRL
Page 34 of 42
Contract TST3-CT-2003-505831 Authors : D. Kokot, B. Kalman, U.
Sandberg
File : D2.2-Technical report-In.2.4-Submitted to approval.doc
Bedding layer: screed; deflections in mm
LVDT L1 range L2 range L3 range
start 0.42 0.42 0.44 0.41 0.43 0.37 end 0.84 0.85 0.80 min 0.42 0.44 0.44 0.43 0.43 0.39 max 0.86 0.87 0.82
Table D.13: Second pavement: ranges of deflections Bedding layer: screed; watering; deflections in mm
LVDT L1 range L2 range L3 range
start 0.83 0.03 0.85 0.03 0.81 -0.03 end 0.86 0.88 0.78 min 0.82 0.06 0.85 0.06 0.77 0.07 max 0.89 0.91 0.84
Table D.14: Watering second pavement: ranges of deflections
D.4.2 Effects of watering pavements
From figures D.14 and D.16 immediate effects of the water that was poured into the pavements can be observed. The effects were three-fold. There was no effect observed for simulating the light rain. When simulating the extreme rain for the first time, there was a short-term effect on the pavement deflections increase. The result of the second extreme rain was in a considerable prolongation of duration of the effect or/and in the increase of deflection values.
Figures D.20 to D.23 show reaction of the pavements to the “rain”.
PAVEMENT STRUCTURE 1 + WATER
0,0 0,1 0,2 0,3 0,4 0,5 0,6 0,7 0,8 0,9 1,0 1,1 1,2 10000 15000 20000 25000 30000 35000 40000 Cycles D e fl ect io n ( m m ) Sensor: L1 (1+W) L2 (1+W) L3 (1+W)
05-FEHRL
Page 35 of 42
Contract TST3-CT-2003-505831 Authors : D. Kokot, B. Kalman, U.
Sandberg
File : D2.2-Technical report-In.2.4-Submitted to approval.doc
PAVEMENT STRUCTURE 1 + WATER
0,0 0,1 0,2 0,3 0,4 0,5 0,6 0,7 0,8 0,9 1,0 1,1 1,2 60000 65000 70000 75000 80000 85000 90000 Cycles D e fl ect io n ( m m ) Sensor: L1 (1+W) L2 (1+W) L3 (1+W)
Figure D.21: Second heavy rain on pavement with sand bedding layer
PAVEMENT STRUCTURE 2 + WATER
0,0 0,1 0,2 0,3 0,4 0,5 0,6 0,7 0,8 0,9 1,0 1,1 1,2 10000 15000 20000 25000 30000 35000 40000 Cycles D e fl ect io n ( m m ) Sensor: L1 (2+W) L2 (2+W) L3 (2+W)
05-FEHRL
Page 36 of 42
Contract TST3-CT-2003-505831 Authors : D. Kokot, B. Kalman, U.
Sandberg
File : D2.2-Technical report-In.2.4-Submitted to approval.doc
PAVEMENT STRUCTURE 2 + WATER
0,0 0,1 0,2 0,3 0,4 0,5 0,6 0,7 0,8 0,9 1,0 1,1 1,2 25000 30000 35000 40000 45000 50000 55000 Cycles D e fl ect io n ( m m ) Sensor: L1 (2+W) L2 (2+W) L3 (2+W)
Figure D.23: Second heavy rain on pavement with screed bedding layer
As can be seen from Table D.15, there was almost no difference in the effect of the two “heavy rains” on the pavement with screed bedding layer. Also, there was a limited effect of watering this pavement. Pavement with the sand bedding layer was affected in much different way. Increase in deflections caused by the first “heavy rain” was the same as for the other pavement, only that the duration was shorter. On the other hand, the second “heavy rain” affected the pavement for much longer time and with considerable increase in deflections compared to the first “heavy rain” and to the other pavement.
bed layer watering range (cycles) peak (cycles) duration (hours) effect (mm)
sand first 23000 25300 24000 2.5 0.02
second 66400 82300 72000 17.7 0.05
screed first 16900 23600 20400 7.5 0.02
second 37700 44600 40600 7.7 0.02
05-FEHRL
Page 37 of 42
Contract TST3-CT-2003-505831 Authors : D. Kokot, B. Kalman, U.
Sandberg
File : D2.2-Technical report-In.2.4-Submitted to approval.doc
D.4.3 Wheel track
Figure D.24 (on the left side) shows the imprint of the test wheel that was observed after finishing the tests on the pavements. The profile of the imprint was measured in five lines which are presented in Figure D.26.
Figure D.24: Measuring profile of wheel imprint
Figure D.25: Sketch of measured lines
As expected, there was a deeper imprint of the test wheel in the poroelastic layer when the pavement was watered for simulating the rain. The average (of five measured lines) difference between the imprint depth in “wet” and “dry” pavement was of about 26 %.
It was found out that about a week time after finishing the tests on the pavement the poroelastic layer returned into its initial position making the wheel imprint not any more visible.
, 2 , 4 5
L1
L2
05-FEHRL
Page 38 of 42
Contract TST3-CT-2003-505831 Authors : D. Kokot, B. Kalman, U.
Sandberg
File : D2.2-Technical report-In.2.4-Submitted to approval.doc Line 1 (10 mm) -4 -3 -2 -1 0 1 2 0 50 100 150 200 250 300 350 400 450 L hor [mm] L v e r [ mm] Cycle 4 (water) Cycle 3 Line 2 (50 mm) -4 -3 -2 -1 0 1 2 0 50 100 150 200 250 300 350 400 450 Lhor [mm] Lv e r [ m m] Cycle 4 (water) Cycle 3 Line 3 (100 mm) -4 -3 -2 -1 0 1 2 0 50 100 150 200 250 300 350 400 450 Lhor [mm] Lv er [ mm] Cycle 4 (water) Cycle 3 Line 4 (150 mm) -4 -3 -2 -1 0 1 2 0 50 100 150 200 250 300 350 400 450 Lhor [mm] Lv er [mm] Cycle 4 (water) Cycle 3 Line 5 (190 mm) -4 -3 -2 -1 0 1 2 0 50 100 150 200 250 300 350 400 450 Lhor [mm] L v er [ mm] Cycle 4 (water) Cycle 3
Max deflections (mm) Line 1 Line 2 Line 3 Line 4 Line 5
without water 1.66 1.77 2.65 3.96 2.30
pavement watering 2.92 2.14 2.84 4.33 2.63
05-FEHRL
Page 39 of 42
Contract TST3-CT-2003-505831 Authors : D. Kokot, B. Kalman, U.
Sandberg
File : D2.2-Technical report-In.2.4-Submitted to approval.doc
D.4.4 Deformations of cement concrete blocks with poroelastic cover
There were another short loading tests performed on concrete blocks with poroelastic layer. The maximum load 35 kN was applied to a single block to find out the reaction to this extreme situation. There was no load distribution to neighbouring blocks, since there were none during this test. There was no load distribution neither to lower pavement layers, since only a block with poroelastic layer was tested.
Two tests were performed: one with a naturally humid block and the second one with a block soaked with water. Comparison of the results is shown in Figure D.27.
DEFLECTIONS OF CEMENT CONCRETE BLOCK WITH SOFT COVER
0,0 1,0 2,0 3,0 4,0 5,0 6,0 7,0 0 10000 20000 30000 40000 50000 60000 70000 80000 90000 100000 Cycles D e fl ect io n ( mm)
BLOCK: Dry Wet
Figure D.27: Loading single concrete blocks with poroelastic cover
There was relatively small difference in deflections of both blocks. Maximum measured deflection for “dry” block was 6.3 mm, and for the “wet” one 6.6 mm. Maximal difference between deflection values ranged up to 19.5 %, with the average value of 8.4 %.