Nr 180 - 1979
Statens väg- och trafikinstitut (VTI) - FaC'k - 581 01 Linköping
|SSN 0347-6030 ' National Road & Traffic Résearch ,Institute ' Fack - S-581'01 Linköping Sweden'-
_
Road Insulation
180
* with Polystyrene Foam
Nr 180 - 1979
Statens väg- och trafikinstitut (VTI) - Fack - 581 01 Linköping
ISSN 0347-6030 National Road & Traffic Research Institute - Fack - S-58101 Linköping - SwedenRoad Insulation
'th Polystyrene Foam
PREFACE
Polystyrene foam of different qualities has been tested at the National Swedish Road and Traffic
Research Institute (VTI) since 1966. The tests have
mainly been made in collabortion with the National
Swedish Road Administration, which, in 1976, issued
building technical specifications for the use of polystyrene foam on the public roads.
In this report the properties and the function of polystyrene foam as a frost insulating material in roads are dealt with. The aspect of the bearing capacity is only touched upon.
This report has been prepared with the quidance of results from previous tests and investigations and has been financed by the institute.
Linköping, April, 1977
Rune Gandahl
NOTE
This report was published 1977 in Swedish in the series Rapport
as No. 126, entitled "Vägisolering med styrencellplast", including
abstract and summary in English.
TABLE OF CONTENTS
SUMMARY
l. INTRODUCTION
2. FROST HEAVING ON UNINSULATED ROADS 3. FROST HEAVING ON AN INSULATED ROAD
4. INFLUENCES ON THE BEARING CAPACITY OF THE SUBGRADE
5. THE RISK OF EARLY AUTUMN ICING
6. DIFFERENT QUALITIES OF POLYSTYRENE FOAM 7. THE CHANGE OF MOISTURE IN POLYSTYRENE FOAM
IN ROADS
8. INSULATED ROAD BASE CONSTRUCTIONS BIBLIOGRAPHY VTI RAPPORT 180 Page 15 17 20 23 25 32
Road Insulation with Polystyrene Foam
By Rune Gandahl
National Swedish Road and Traffic Research Institute Fack
S-581 01 LINKÖPING Sweden
SUMMARY
By insulating the base of a road with polystyrene foam it is possible to reduce or completely to prevent
freezing in the subgrade. If the subgrade is frost susceptible, damaging frost heavings can be avoided in
that way. The magnitude of the frost heaving depends on the local conditions and, on the whole, on the amount
of frost. In Sweden the greatest frost heavings may vary from 5 to 40 cm in different parts of the country during an average cold winter. Earlier it was possible to affect frost heaving by increasing the thickness of the base, by draining the road structure, and by in-stalling freezing resistance layers (bark). Now it is also possible to prevent frost heaving by installing heat-insulating layers, such as polystyrene foam layers. At the same time the bearing conditions will be more
favourable to the road.
One disadvantage of heat-insulating layers in roads may be the risk of early autumn icing. This risk is reduced if a suitable superstructure is placed on the heat-insulating layer. In its building technical specifica-tions the National Swedish Road Administration
recommends a thickness of the superstructure of 50 cm,
and thus the requirements for bearing capacity are also met.
A certain minimum of strength is required for a
polystyrene foam layer. A low thermal conductivity is also required. The thermal conductivity determines directly the thickness of the insulating material that
II
is needed to meet the requirements for insulation. The
thermal conductivity depends very much on the moisture
of the polystyrene foam board and on the distribution
of water in the polystyrene foam board. In this respect
different qualities of polystyrene foam differ. The
ex-truded type is the most suitable one, then polystyrene foam expanded in one step into the size of the board comes. Both these types of polystyrene foam are of a
high quality. Polystyrene foam expanded into big blocks
and cut into boards is inferior and has proved to ab-sorb large quantities of water in the road.
A heat insulating base consists technically of three layers, i.e. superstructure above the insulating layer, insulating layer and substructure below the insulating
layer, here called insulating bed. The insulating layer
has, of course, a dominating influence on the insulating
effect, but also the insulating bed constributes greatly. In its specifications the National Swedish Road
Admini-stration has taken the importance of the insulating bed into consideration when determining the required thick-nesses of the insulating layer which appear from the design table for public roads below.
Table 4. Design table of the National Swedish Road
Ad-ministration for road bases insulated with
plastic foam /7/
Average free- Thickness of the insulating bed in mm I
zing index 100 200 300 400 500 600 700
OC-d Thickness of the plastic foam layer in mm
< 500 35 30 25 20 - - -500 - 600 40 35 30 25 20 - -600 - 700 50 40 35 30 35 20 -700 - 800 60 50 40 35 30 25 20 800 - 900 70 60 50 40 35 30 25 900 - 1000 80 70 60 50 40 35 30 1000 - 1100 90 80 70 60 50 40 35 > 1100 90 90 80 70 60 50 40
VTI RAPPORT 180
III
Other design tables can be applied to streets, rail roads and runways at airfields, and to certain other objects, such as ice-rinks and buildings that are susceptible to movements.
An insulating layer of polystyrene foam boards can be made as a one-layer or as a two-layer system. The advantages and the disadvantages of these two alternatives involve water absorption and gaps
occuring between the boards. If there are no gaps
between the boards, the one-layers system is to prefer, as a thick board absorbs a smaller quantity of water. If, in using a one-layer system, the boards are exposed to the risk of sliding apart, the resulting thermal conductivity may increase considerably and the
insulating capacity may decrease to an unacceptable value. In such cases a two-layer system is to prefer, to which formations of gaps are of little consequence. Transition from sections insulated with polystyrene foam to uninsulated ones can be made by making the layer thinner towards the uninsulated road sections. Other methods, for instance by increasing the width of the gaps, are also possible, but have not been tested.
1. INTRODUCTION
By insulating the base of a road with polystyrene foam it is possible to reduce or completely to prevent
freezing in the subgrade. If the subgrade is frost susceptible, damaging frost heavings can be avoided in that way. Thus the polystyrene foam has a frost pro-tecting effect, in the first place by retarding frost heavings and in the second, consequently, by mitigating the reduction of the beaering capacity during thawing. The insulating degree required depends on the base
construction, the frost susceptibility of the subgrade,
on the winter cold, and on the requirements for pre-venting damaging freezing.
2. FROST HEAVING ON UNINSULATED ROADS
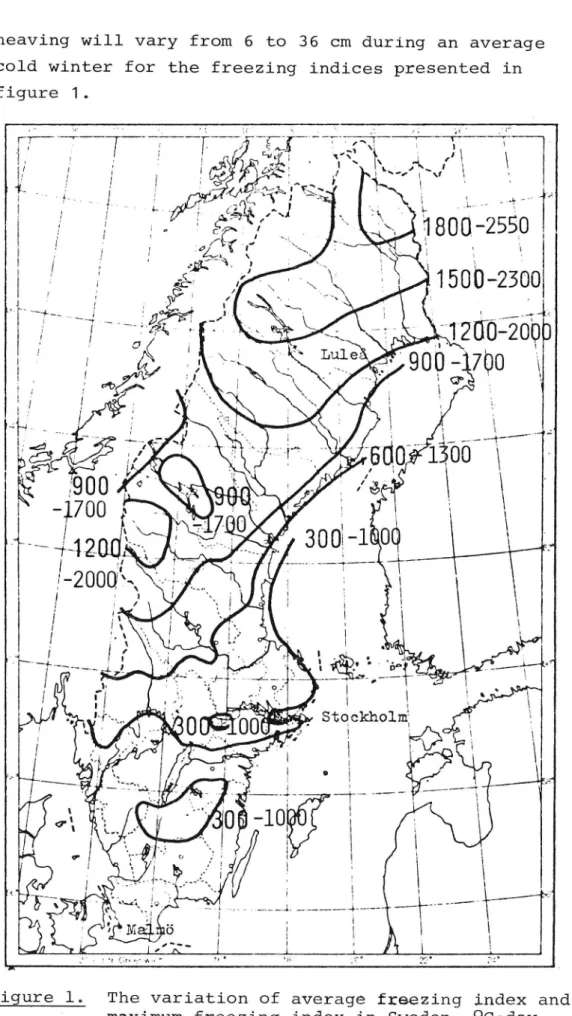
How great the frost heaving will be on a certain road section in the winter mainly depends on the winter cold arisen, which can be expressed as the freezing index, i.e. as the number of negative degree days
ob-tained. The variation of the average freezing index and the maximum freezing index in this country appears from figure 1. Observations on test roads for several
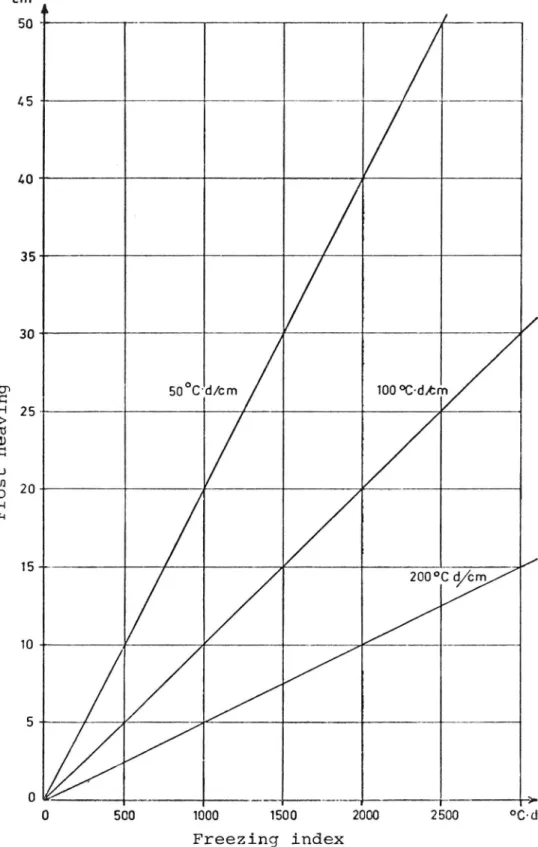
years revealed that in the majority of cases there is a practically rectilinear relationship between freezing index and frost heaving. On very frost susceptible road sections the quotient of freezing index and frost heaving, here called the frost heaving
quotient, amounted to 50 OC-d/cm. It was higher at less frost susceptible locations. In the diagram, figure 2, the relationship between frost heaving and
freezing index for three quotient values, 50, 100 and
200 Oc.d/cm, is exemplified. It is now possible
to estimate the variation of frost heaving in this
country if it is known how high the frost heaving quotient is. If it has the value of 50, the frost
heaving will vary from 6 to 36 cm during an average cold winter for the freezing indices presented in figure 1.
' ., ,11. l. .m I' ' I i
.
,I \\
\
I . ' ' ,1, I, 1' kg i 'I I' _ _q .JJ.80042550
'150b-2300
?1 .-UA1"',12ÖU:§OÅQ
i
L238 3900-1700 \.
Wu
ä \ \X\ J11l .'
iç? :
i
o. E_ i *i "l a K | ! -ä i : Stdckholml'.
_----_
___
___
_4.
-__
___
-_
i 1xFigure 1. The variation of average freezing index and
maximum freezing index in Sweden, OC'day
cm 50 45 40 35 30 25 20 F r o s t h e a vi ng 15 m
50°C'd/cm 100 °C-d,tm 200 °c cycm 0 500 1000 1500 2000 2500 00-0 Freezing index
Figure 2. Exemplification of how great frost heavings
that may occur when the frost heaving quotient is assumed to be 50,
OC-d/cm
VTI RAPPORT 180
A quotient value as high as 200 produces frost heavings
of 1.5 to 9 om.
are presented in figure 3.
Frost heavings estimated in this way
Frost heaving (cm) When 1 cm requires: 200°ca SOOCd lOOOCd 36 18 9 30 15 7,5 24 12 6 18 9 4,5 12 6 3 6 3 1,5
3. Average freezing index (OC°d) in this country
and the corresponding frost heavings for the
fäost heaving quotients of 50, ( C°d/cm)
VTI RAPPORT 180
5
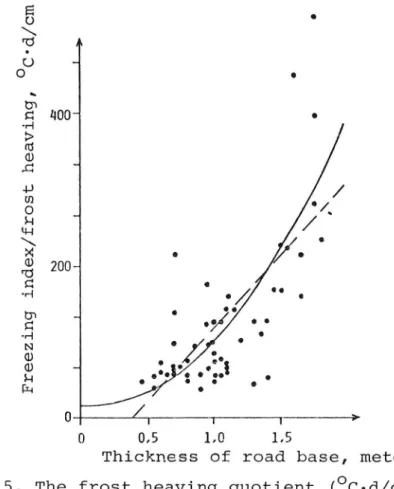
The frost heaving quotient depends on the road base as well as on the subgrade. From a statistical investiga-tion made by means of frost heaving values and freezing index values from some 70 test sections it appeared that the thickness of the road base had the best positive correlation, i.e. when the thickness of the road base increased the quotient increased, too. This implies that when the thickness of a road base increases a higher_freezing index is needed to produce a frost
heaving. See figure 4 and 5. The causes of this positive correlation are, for instance:
1) An increased freezing index is needed to freeze the
road base and less remains consequently to freeze
the subgrade.
2) A lower temperature gradient for "cold transport" to the subgrade (=the insulating effect).
3) A greater surcharge. °C'd/cn' AL 450
m
i
350 / m ., _vn / 250 . Fr os t he avi ng quo ti en t 150 -' i 100 / .__4,/
0 50 100 150 200 250 300 c rr.
Thickness of the road base
Figure 4. The frost heaving quotient (OC-d/cm) as a function of the thickness of the road base on
the test road Broängen 1961 (average freezing
index of 1200 OC-d) where road bases consist
of gravel and sand materials. VTI RAPPORT 180
400" 200* F r e e zi n g i n d e x/ f r o s t hea vi n g , O C ' d / C m 0 05 LG 15
Thickness of road base, meter
Figure 5. The frost heaving quotient (OC-d/cm) as a func-tion of the thickness of the road base on
10 different test roads with varying types of road bases
Average freezing index = = 900 (OC-d) o ' 3 -A C'J G .. .i b 0 _ N O m0' eo* 60' 4 T h ic k n e s s o f r o a d b a s e 1.0 20. J i
3
/
2001
4/
1.00 600 em: *Iw/f 1000 °C'dA ve r a g e f r e e zi n g i n d e x a f t e r f r e e zi ng of the r o a d b a s e
Figure 6. The freezing index (OC-d) available for freezing in the subgrade when the thickness
of the road base is increasing VTI RAPPORT 180
The freezing index available for freezing grade when the thickness of the road base during a winter that has a freezing index (average freezing index assumed) is shown
in the sub-increases
of 900 OC-d
in figure 6.
The temperature gradient that decreases with an in-creasing road base thickness is illustrated sche-matically in figure 7, which shows the vertical
temperature distribution at different road base
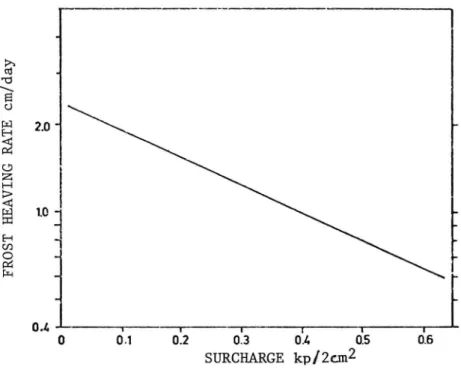
thick-nesses . The importance of the surcharge has been
studied in the field among others by Aitken /1/.
Figure 8 shows the result from his test surfaces, which clearly shows that when the surcharge increases, the rate of frost heaving decreases.
Temperature t SOcm -> 103 Cm -Th ic kn ess of ro ad ba se 150cm * 20007:-- _- --- .- _- _. Figure 7.
gradient (=insulating effect).
An illustration of how an increased road base
thickness results in a lower temperature Schematic curves of temperature describe the vertical temperature distribution for different road
base thicknesses selected (50,
VTI RAPPORT 180
:>s CU .4 'U \ 5 U g 20* r (3 Z
51
§
m-m ' .1 __ä
ä f _ T -J . OJ: 1 r I I I I 0 0.1 0.2 0.3 0.10 0.5 0-5 SURCHARGE kp/ztm2Figure 8. The importance of the surcharge to the amount of frost heaving. Results from Aitken's
tests /1/.
Another important factor that has an influence on the frost heaving quotient is the position of the ground water table. The diagram in figure 9 is a summary of test results from a large number of test sections and it describes the increase of the frost heaving quotient when the thickness of the road base is increased at some autumn levels of the ground water table. It
appears from the diagram that if the thickness of the road base (a road base of gravel and sand) is increased from 90 to 140 cm, the frost heaving quotient changes
by (460-130) Oc-d/cm = 330 Oc-d/ cm in the case of the
ground water table >65 cm below the subgrade surface,and by (190-70) Oc-d/cm = 120 OCod/cm in the case of
the ground water table S 6 cm below the subgrade
sur-face. When increasing the thickness of the road base
from 90 to 140 cm the effect on the frost heaving
quotient and on the reduction of frost heaving will consequently be approximately three times greater when
the ground water level is more than 65 cm below the
subgrade surface compared with the case when the ground water level coincides with the subgrade surface.
Djup till grundvaftenyta från ferrassyta
Depth to graundwafer surface from subgrade surface I => 65cm I 1 i / 30-*65cm /
//:/, o;
////
m
Jø/
"50 100 750 c m Over-byggnadsfjacklek Thickness of road base'C dyg n/ cm Fr os ti ndex pe rfr as fh ea ving °C .d ays /c m Köl dm a' ng dpe r fj äl ly ftn/ ng
Figure 9. The frost heaving quotient (OC°d/cm) as a function of the thickness of the road base
at some ground water levels in the autumn on
10 different test roads with varying types
of road bases
3. FROST HEAVING ON AN INSULATED ROAD
When calculating the plastic foam thicknesses that would be needed at the highest freezing indices in this country the thicknesses arrived at are far from reasonable. The
problem is the same in permafrost areas though the
other way round. There the function of the plastic foam insulation is to prevent the frost from thawing and, consequently, the warmer the summers are,the thicker insulating layers will be needed. In both these cases
the essential thing is, however, to reduce the variations
10
of temperature in the subgrade by the plastic foam insulation (as heat insulation). An example of such an effect appears from the test results from test roads at Edsvalla in the province of Värmland, see figure 10. From this figure it appears that the variations of
temperature in the subgrade decrease with an increasing insulating degree (=increasing thickness of the plastic foam layer) and that the temperature gradient in the unfrozen part of the subgrade decreases in the same
direction, too.
Table 1. Thickness of plastic foam layers at different freezing indices and thickness of sublayers. The thicknesses are calculated in accordance with Skaven-Haug /2/. Freezing index 1800 1800- 1500- 1200- 900--300 -300 -300 -300 OC'd =1500 :1200 =900 =600 Thickness of the insulating 0 20 40 0 20 40 0 20 40 0 20 40 0 20 layer, cm
Plastlc foam 83 41 27 23 17 13 10.7 8.4 6.7 6.0 4.7 3.7 3.1 2.3
layer, cmNote: In calculating the plastic foam thicknesses a superstructure above the plastic foam layer consisting of a bituminous pavement of 5 cm, 15 cm of base course gravel and 30 cm of re-inforcement sand was assumed.
11
*0 +5 +10 +15 +20 +4 .
1 § i ; . 4 . v
3
#øø
" The lower edge ok the _ i::f:;:SLMa--"t
.'- I
i
plastic foam lager -"'"f'"_ ./
:3 0ch ?cm
18m» chm; Lcmz Zcm Oc
§
100--\
z
: \\
/
L
i
i:
\\
///
.
\ .
'I //
T Depth, cmThe vertical temperature distribution in the
road base and in the subgrade where the base
was insulated with polystyrene foam layers
of different thicknesses (2, 4 and 8 cm) on
the test road Edsvalla, the province of Värm-land
Figure 10.
It appears from the vertical temperature distribution in figure 10 that also for insulated road bases
negative degrees were obtained below the plastic foam layer, whose lower edge is situated about 40 cm below the road surface. At uninsulated road sections the frost depths (the position of the OO-isotherm) are
120 cm,
75 cm
foam). A plastic foam layer with a thickness of 8 cm and at sections insulated with plastic foam (2 cm of plastic foam) and 55 cm (4 cm of plastic completely prevented freezing below the plastic foam layer. Thus it is only at the insulation of 2 cm that a marked freezing occured below the plastic foam
layer. The question is how great a frost heaving that such a freezing can give rise to when the freezing
12
occurs in a subgrade that has a frost heaving tendency.
The lower temperature gradient will probably produce
a smaller frost heaving, which has been shown by S Fredén /3/, see figure ll.
Fr os t heavi ng , cm /d 47 II l 100 200 3b0
Temperature gradient x constant, W/mK
Figure ll. The frost heaving rate in silt as a function of the temperature gradient. After Fredén /3/. As appears from Fredén's curve the relation is
approxi-mately linear under certain conditions (at a lower tem-perature gradient). Another thing that indicates a
re-duced frost heaving is the fact that only a small portion of the pore water is frozen at the relatively small nega-tive temperatures, which is the case when the subgrade
13
below the plastic foam layer is frozen. At the labora-tory L Stenberg /4/ has determined, at some different temperatures, the content of frozen water on subgrade materials from Edsvalla of the same kind as found at the road sections where the temperature measurements
presented in figure lO were made. Figure 12 shows a Z by weight L 100 90 80 LO P a r t f r o ze n wa t e r 8 I
/w
Z by 0 x- 0 o0 5 m m m 5 *weight
The water content of the soil material
Figure 12. The part of frozen water as a function of
the water content of soil materials, fine
clay. After L Stenberg /4/.
result from one of his tests. It appears from Stenberg's investigation that also at a temperature as low as -6 0C
and at a water content of the clay of 20 percent by
weight not more than 60 % of the pore water is frozen.
«The corresponding value for the same water content of the clay but with a temperature of -2 0C appears to be 45 %.
14
In the light of the above-mentioned the conclusion is
that, after the frost has penetrated a plastic foam insulated road base, only a small frost heaving is to be expected when the subgrade freezes, Basic frost physical investigations are, however, required to exactly estimate the amount of this frost heaving. An investigation on a limited scale has been made at Malgovik, the province of Västerbotten, with the object of determining the relation between freezing index and frost heaving for a locality on a road insulated with plastic foam. See the results in figure 13.
OC'days
*' C'r'r'i'1*
v *3=FREEZING lNDEX 600°C«UAY5
ff X=FREEsz :max 870 ?campa/s
A: FREEZING INDEX 1290 °C°DAYS
-. A FR EEZI NG IN DE X / FROS T HE AV IN G r r I I I T"'""""T_"' 1 2 3 4 5 6 7 cm THICKNESS OF INSULATION
Figure 13. The frost heaving quotient (OC-d/cm) as a
function of the thickness of the polystyrene foam layer on the test road Malgovik 1973 in the province of Västerbotten
15
The thickness of the plastic foam layer varies from 1.5 to 7 cm. At the same time the frost heaving
quotient for freezing in the subgrade varies from 75
to 150 or 300 Oc-d/cm.
4. INFLUENCES ON THE BEARING CAPACITY OF THE SUBGRADE
The critical period of the bearing capacity of the road takes place, as is well known, during the spring
break-up period. By heat-insulating with polystyrene foam freezing and frost heaving in a frost susceptible sub-grade can be prevented. If no freezing takes place in the subgrade, there will consequently be no frost break-up. Even if the insulation only is partial, i e freezing occurs in a frost susceptible subgrade and a certain
amount of frost heaving with water concentration occurs,
the break-up that follows cannot be severe. The cause
of it is that also at a moderate insulating degree the
frost heaving becomes relatively small and, consequently, the water quantity concentratedin the frost area be-comes relatively small, too. Furthermore, judging from the rapid frost penetrations that can be noted at a low
insulating degree, the water concentration seems to
occur by distribution at a greater depth in the subgrade.
As an example see figure 14, which describes the course of the frost penetration at three different road
sections with different insulating degrees. There is another reason why the bearing capacity should be rather high, relatively Speaking, on a road with partial
insu-lation and that is the fact that thawing of the frost
occurs to a relatively great extent from below and not from above as under insulated conditions. The cause of it is that in the spring the polystyrene foam layer has a heat-insulating effect by retarding the heat flow directed downwards. Unfortunately, no systemathical
VTI-RAPPORT 180 Ai r te mp er atur e 0
(O
C)
F r e e zi ng i n d e x(O
C-d)
Fr o s t d e p t h (C m) +Z OI _* Se-p t OM. N W . D H L Jo n. Fe bn M o r s Ap ñt M m -2 01 50 0 10 00 4 1500 1 2 c m"\
\_
*§§L
*
\Lc m
F i g ur e 14 . F r o s t pen e t r a t i o n a n d t h a win g a t t h r e e s e c t i ons wi t h d i f f e r e n t i n s ul a t i n g d e g r e e s o n t h e t e s t r o a d G a m m e l s t a n 1 9 7 3 (p la st ic f o a m t h i c k n e s s e s of 12 , 8 a n d 4 cm )
bearing capacity has been obtained.
no information about the details of the course of the
period on roads insulated with polystyrene foam and so measurements were madeduring the spring break-up
17
5. THE RISK OF EARLY AUTUMN ICING
Early in autums the risk of icing is greater on a heat-insulated road than on a road where the road base only consists of materials of gravel and sand. How great the difference will be depends on many factors, such as the thickness of the plastic foam layer, its location below the road surface, the material quality of the layer above the plastic foam layer and especially on the autumn climate. The difference in autumn climate re-garding the curves of air temperature for a couple of selected places in this country appears from figure 15, which also shows the temperature trend in the autumn
and the average critical period during which hoar frost
I) Sept. Okt. Nov. Dec. Jon.
0C _.
+5 ' Karlstad
+4 :uiim. -__w__r;-?<_._-35 days, ;__i____mpi..iwi_miâ
x \ 5 +2 n *ä* \\ \\1§\ S + 0 T \ \n \ x\\. .\\\_ .\ o " x '\\ -X \\ L\ H 4 \ ° :j _. 2 ,1 \ . \ \« . \ 4-) x $\ \.\ .å :1:3 '-4 -4 \ \.-\\\ \ *\ \\\ | x \ \ ' Y \ *7 m . \§\ 5 _5_ \\ \\\\\\\ *\\\ .äb g E* . ,rm x .\ * * . " 8 -l --- -'---' \x \, i \\ . q \ \\ ' 2 '10 -1 Y.
4
\\
.
-12 i '' -w- = Air temperature (monthly average) _____ = The temperature of the road surface
(assumed to be 2 OC lower than the air temp) u_+__ = The temperature of the road surface
(assumed to be 4 0C lower than the air temp) _._._ : Dew point
km--ä Risk of icing
Figure 15. The average variation of the air temperature at Karlstad and Kiruna in the autumn. (Assumed critical periods exposed to the risk of autumn icing are marked).
formations may be expected to occur on the roadway. The period was determined on the basis of experience gained from investigations at test fields /5/, where it was
18
observed that when the temperature of the road surface reached the dew point there was an immediate risk of hoar frost formations. From figure 15 it appears how much lower the dew point is at Karlstad and Kiruna than the air temperature. If at the same time the temperature of the roadway is lower than the air temperature and corresponds with or is lower than the dew point, there is a risk of hoar frost formations. How much lower the temperature of the roadway will be depends on the in-coming and outgoing radiation of heat, but the out-going radiation predominates when the nights are cloud-less. If the temperature of the roadway is assumed to be 2 0C lower than the air temperature, the dew point
would not have been reached at Kiruna during the
critical period assumed during which the temperature of the roadway falls 0 to -4 0C. The dew point would, how-ever, have been reached at Karlstad. If the temperature of the roadway is assumed to be 4 0C lower than the air temperature, the temperature of the roadway is lower than the dew point at the two places and the periods exposed to the risk of hoar frost formations
(the temperature of the roadway 0 to -4 0C) are 18 and 35 days, respectively. How much lower the temperature of the roadway is in comparison with the air temperature on different road bases in different parts of this
country is not known except for a few localities.
Information about how severe the icing can be on a heat-insulated road can be obtained by frictional measurements.
Such measurements have been made on several test roads,
e.g. on the Edsvalla test roads (Värmland). In figure 16
a typical result is presented. The average quotients
of friction (quotient of friction = the relation be-tween the friction of the section and the friction of an uninsulated section conventionally constructed with materials of gravel and sand) that are shown in the
figure serve as a measure of the relative friction. The lowest quotient of friction, 0.72, is found on
19 . . p r? 1,0 0.85 0.77 ägo 0, 0,5 um um 1Iq 0,77 0.82 0,85 I 1,0 1,0 0,5' 0,5 xm' ' i i \ ' ' | '0 ' V "- --:T°-:: ' ' 5 ' | . tf 'A A 'p' A *53.: "31'":'°'* L* "57' ;17' /7«.-"=:'.-"-?»."_=.r. 4 1 * 'I ^ * ' * .... ... .. ...'."'.' ...0.0.0.O.'.'.'.'.'.°t']' . . o u c o o i". 0 o 0 i 0 0 LJL...0... ...v. AAAAAÅAJlAAÅAAÅA-r ° - 0 0 i -o 0.0.0.1_ *AAA* 16 17 18 19 20
= Ab, BG (bitumen bound grayel) um = Average quotient
[IIIB = CG (cement bound gravel) of friction 3:31: Base course gravel_
[DIE] = Styrofoam
2:7' = Sand
Figure 16. Average quotient of friction for frictional measurements carried out in the autumn of
1972 on the test road Edsvalla 1967 A
20
section 14, which has a plastic foam layer of 4 cm and a base course of bitumen bound gravel. The corresponding
construction, but with a base course of gravel instead of bitumen bound gravel, is section 12, which has a
higher quotient of friction, 0.81. A similar section is section 17 with cement bound gravel, which has the
quotient of friction of 0.82. An additional comparison will be made and that is between section 2 with a
plastic foam layer of 4 cm and section 3 with a plastic
foam layer of 8 cm. In other respects these sections
are constructed in the same way. The differing thickness of the plastic foam layer has a strong effect and that is indicated by the quotients of friction of 0.85 and 0.77, respectively. These examples are enough to
illustrate how the different parts of the road base
have an influence on the friction, or conversely, on
the degree of icing. Investigations by means of
fric-tional measurements have now been intensified.
In summary, it can be noted that the risk of icing
mostly occurs early in autumns and that the
super-structure on top of the plastic foam layer has a strong
influence. For roads that carry heavy traffic it is recommended, for the time being, that the building
specifications of the National Swedish Road
Administra-tion (VV) are followed, which say that the super-structure on tOp of the plastic foam layer has to be
at least 50 cm.
6. DIFFERENT QUALITIES OF POLYSTYRENE FOAM
The design table of the National Swedish Road
Ad-;ministration for the use of polystyrene foam in roads is primarily applicable to a certain material quality, namely Styrofoam HI. As regards the strength, the
specifications require:
- a compression strength at the prOportionality limit
21
on the curve of deformation >0.25 MPa (2.5 kp/cmz) and
at a deformation of 5 % >0.35 MPa (3.5 kp/cm2) in
accordance with DIN 53421.
\
and as regards the thermal conductivity:
- thermal conductivity, the value of Å at -5 0C after
5 years in a road construction <0.035 W/mK
(0.030 Kcal/mh OC) in accordance with the methods
VVSI-1964 modified by SP.
There are mainly three variants of polystyrene foam
1. Extruded
2. Expanded in one step into the size of the board 3. Expanded into big blocks
Polystyrene foam expanded into big blocks and then cut
into boards has varying gualities regarding density, strength and water absorption. This product has been
tested on roads in Sweden (Edsvalla in the province of
Värmland) and the result obtained was negative. Both polystyrene foam expanded in one step and the extruded polystyrene foam type can be produced in a uniform and high quality. There are, however, differences in quality.
The most important one involves the water absorption and, consequently, the thermal conductivity. In order to be
able to distinguish between the two materials last
mentioned as regards differences in quality (the extruded
type = Styrofoam HI, polystyrene foam expanded in one step = Styrolit road board) a determination of the thermal conductivity was made on equivalent samples taken along a test road in the province of Västernorr-land (Lasele 1972) after 3 years in the road. In table 2
the results of these testing are shown. This table shows
the interesting and important fact that the thermal con-ductivity of the polystyrene foam materials is lower in
a frozen than in an unfrozen condition, which is an ad-vantage when making a frost insulation. If the two material
22
gualities are compared with regard to the thermal con-it will be found that the thermal
conduc-tivity of the Styrolit is 22-25 % higher than that of ductivities,
the Styrofoam. Test calculations show that if other
parameters included are given practical values, the
plastic foam thickness required will increase by the
same percentage when using Styrolit boards instead of Styrofoam HI.
Table 2. Comparison between thermal conductivities of Styroanm HI (thickness 7 cm) and Styrolit road boards (thickness 8 cm) on the basis of
measurements carried out at the National Swedish Institute for Materials Testing on
samples taken along the test road Lasele 1972
on October 22, 1975
Approximate Thermal conductivity (kcal/mh OC) Increase of
average tem- the thermal
perature on Styrofoam HI, Styrolit road conductivity
determina- the average of boards, the of the
Styro-tion of Å samples No 12 average of lit above that
(OC) and No 13 samples No 10 of the
Styro-and 11 foam (%)
-(9-lO) 0.0225 0.0280 24
-(7-8) 0.0230 0.0280 22
+(7-8) 0.0238 0.0293 23
+10 0.0238 0.0298 25
On a test road at Gammelstan 1973, where road base con-structions suitable for roads with light traffic are
being tested, the insulating materials Styrofoam HI and
Styrolit road boards have been tested. Results of frost
depth measurements made on these investigations are
shown in table 3.
23
Table 3. Frost depth on March 1st, 1976 on the test road Gammelstan 1973. At this date the frost heaving was less than 1 cm.
Polystyrene foam
Styrofoam HI Styrolit road boards
Thickness, cm 4 8 4 8 12
Frost depth, cm 90 70 110 80 60
As appears from the table the frost depth is greater on the sections that were insulated with Styrolit road
boards. Frost depth as the measure of the insulating capacity of a road base is not perhaps quite correct as the measured frost depth strongly depends on the
water of the subgrade. In this case the comparison is probably correct as the frost heaving was insignificant on all sections, and the water absorption was
con-sequently low, which implies that practically only the
stationary pore water of the subgrade froze during the
frost penetration. Hence it may be concluded that on this test road Styrofoam HI had a better retarding
effect on the freezing in the subgrade than Styrolit
road boards. This is in accordance with the conclusion
that could be drawn from the above-presented determina-tions of the thermal conductivity for these polystyrene foam qualities.
7. THE CHANGE OF MOISTURE IN POLYSTYRENE FOAM IN ROADS
The investigations that were made at the Royal College
of Forestry by burying chemically different types of plastic foam in a soil with different cultures of bac-teria showed that polystyrene foam had the best
resisti-bility and did not decay bacteriologically /5/.
Neither was a bacteriological decay found ocularly
24
in polystyrene foam in roads.
In October-November, 1976, 10 year old samples of poly-styrene foam, Styrofoam HI, were taken along the test road Edsvalla 1966 in the province of Värmland. The water content was determined on these samples. The water content values determined, on an average 3
per-cent by volume on 42 samples (thickness 4 cm), show an
average water content increase of 0.3 percent by volume a year during these 10 years. On a previous sampling after 5 years in the road a water content increase of 2 percent by volume on an average was noted, which is equivalent to a water content increase of 0.4 percent by volume a year in comparison with the 5 following years during which the water content increase was
0.2 percent by volume. Thus, the water content increase
is not rectilinear, but it seems to follow a curve with an asymptotic course.
Frigolit, a variant of polystyrene foam that is ex-panded into big blocks and cut into boards, was tested on the test roads at Edsvalla, too. The quality of this product was low and varying, and the absorption of
water averaged 20 percent by volume after 5 years. Styrolit road boards, which are expanded in one step and cut into boards, have not been tested for so many years in roads. Regarding the absorption of water a comparison can, however, be made between Styrolit road boards and Styrofoam HI on the samples in equivalent
positions (a test road at Lasele in the province of
Västernorrland) that were taken from the road after 3 years. The absorption of water for Styrolit road boards (thickness 8 cm) was 1.4 percent by volume and for Styrofoam HI (thickness 7 cm) 0.7 percent by
volume. Since 1971 Styrolit road boards are being tested on the test road Vingåker 1971.
A summary of the determinations of water content of
25
polystyrene foam in roads so far made is shown in
figure 17 regarding Frigolit (Edsvalla), Styrolit road boards (Vingåker) and Styrofoam HI (Edsvalla).
%üqdmmâ
20-
18-.J36*
14--
FRIGOLIT
12-4thefå
-§8 .
H5*6 .
.
3 4
31 YROFOAM HI
-
STYROLIT
uø_._ø_____,__.-ø-**"""
2 .4 o ' 1 I I I 1 T I I I ._7 0 1 2 3 4 5 6 7 8 9 .m YearsFigure 17. A summary of the determinations of the water content of polystyrene foam in roads so far
made regarding Frigolit (samples from Eds-valla), Styrolit road boards (a few samples
from Vingåker) and Styrofoam HI (Edsvalla)
8. INSULATED ROAD BASE CONSTRUCTIONS
A horizontal plastic foam layer in the base of the road has a heat-insulating effect and form together with the other road base layers, especially the one located
26
below the plastic foam layer, a frost insulated road base construction by means of which the freezing in the subgrade can be reduced or prevented. The plastic foam thickness required to avoid freezing in the sub-grade as a function of the thickness of layers of non-frost active materials located below the plastic foam
layer, such as sand or old road bases, are shown in figure 18 with regard to a given road base and two
freezing indices assumed. The diagram shows clearly
how necessary it is to take the frost insulating contri-bution of underlying layers into consideration when
designing a plastic foam insulated road base. Thickness of insuiotion (Å=0,03 kcal/°C-h-m) Isoleringens tjockiek (260,03 kcal/°C-h-m) cm ' -v '.,Asfoltic concretc /jAsiuLtbz-:tong t _
22
» 0 .. §13?
WUUZHP ln5ul0_tian X X Isolenng X X cm 2 X X Sandw h 1 l Is ol er in ge ns tj oc kl ek T hi ck ne ss of in sul at io n .-0 L r I I 0 16 20 30 40 åh 60 in 80 Thickness of sandlayer (Z) °"" Sondlogrets tjocklek (Z)
Figure 18. The thickness of the plastic foam layer as a function of the thickness of the under-lying layer of non-frost active material
27
When 10 years ago heat insulation of roads with plastic foam was introduced it was thought that the heat
insu-lation could be made 100 %, i e that freezing in the subgrade would not be permitted. Now the experience is, if not complete, at least so reliable that it can be justified to design plastic foam insulated road bases for a partial frost insulation, i e to allow a certain
amount of freezing in the subgrade. The frost
insu-lating degree can, however, be discussed depending on
the requirements for retarding the frost movements.
Thus the requirements can be higher for fast trackbound traffic than for traffic on conventional roads. In its building specifications that recently appeared, the
National Swedish Road Administration, which has carried out an extensive test road project, has adopted the
partial frost insulation concept for one plastic foam
quality, Styrofoam HI, when designing plastic foam
insulated road bases on public roads, which carry, as a
rule, rather heavy and fast traffic. Table 4 represents the design table of the National Swedish Road
Administra-tion for plastic foam insulated road bases. It appears
from the table that the frost insulating contribution
of the layer, here called the insulating bed, that is located below the plastic foam layer has been taken into account.
Table 4. Design table of the National Swedish Road Ad-ministration for road bases insulated with
plastic foam
Thickness of the insulating bed in mm
AverageofreeZing
100 200 300 400 500 600 700
index' C°d Thickness of the plastic foam layer in mm
< 500 35 30 25 20 - - -500 - 600 40. 35 30 25 20 - -600 - 700 50 40 35 30 25 20 -700 - 800 60 50 40 35 30 25 20 800 - 900 70 60 50 40 35 30 25 900 - 1000 80 70 60 50 40 35 30 1000 - 1100 90 80 70 60 50 40 35 > 1100 90 90 80 70 60 50 40 VTI RAPPORT 180
28
Roads that are insulated with plastic foam in accordance with the design table of the Road Ad-ministration will freeze during winters with higher freezing indices than the designed ones, but the
re-sultant freezing in a subgrade that is normally frost
susceptible will not produce greater heavings than what may be accepted on these roads. Other design tables may be applied to streets, rail roads and runways at
air-fields, and to certain other objects, such as ice-rinks
and buildings that are susceptible to movements.
As indicated above, the requirements for insulation on the public roads have to be relatively high. There has been a feeling that the requirements can be lower in streets in housing areas. In a housing area at Gammel-stan in the province of Norrbotten road base construc-tions with a superstructure above the plastic foam layer of 17-33 cm are being tested for the time being. Furthermore, plastic foam thicknesses below the ones stated in the Specifications of the Road Administration
are being tested. The investigations have not been
concluded yet, but they indicate that it is easier to manage with thinner total road bases in streets and above all on footpaths and the like that carry light traffic than it is on the public roads that carry heavy
traffic.
A plastic foam layer can be made either as a one-layer
or as a two-layer system. This can be of importance to
the insulating effect. The fact is that the
heat-insulating capacity of a plastic foam layer that
con-sists of separate boards is affected if there are gaps filled with soil material between the boards. Made as a two-layer system without gaps throughout, the average thermal conductivity changes only slightly. Made as a one-layer system, on the other hand, the thermal con-ductivity changes markedly should there be any gaps
filled with soil material. In this respect see figure 19,
29 One layer: M M cp O TWO layers: Ez' \
Tu'
U 1,0_1 'x .-4 g: 0,87 H > -4E
0 05-8 -Z O n 4J One layer L) ur .-1 _. ä 0,2_ [1.] m a Two layers F! OM
4
.
r
7 I T T 1 I I I 10 15 20 25 30 35 40 45 50 55 60 cm Width of gapsFigure 19. The effective thermal conductivity of plastic foam layers with gaps between the boards
(width of boards 60 cm) as the function of the width of the gaps determined in accordance with the method of pr0portionality
which shows how the thermal conductivity determined in accordance with the method of pr0portionality changes with the width of the gaps when the gaps are assumed to be filled with sand. If, when repairing an old road,
the plastic foam boards are installed on a firm bedding,
such as existing pavements, base courses or subgrades, and closely tOgether, there is no risk of gaps being formed. The boards can slide apart if the subgrade moves, which may happen when there is a combination of earth flow in the subgrade, heavy construction traffic and thin superstructures above the plastic foam layer. Even if the risk of the boards sliding apart in the
plastic foam layer is, on the whole, small, it must be
notêd that it may be necessary to take some precautions
30
if the bearing capacity turns out to be low when
con-structing the road. In difficult cases it may be
suitable to stabilize the subgrade (with lime), for instance. As a rule, however, it is enough to apply
an insulating bed, which must not be thinner than 10 cm. A two-layer system of polystyrene foam is better if
there is a risk of earth flow in the terrace. The requirement for "pegging" the plastic foam boards so that they cannot move during the construction operation can be determined from case to case. Protective layers,
which can be subbases or base courses, should be placed
upon the polystyrene foam layer. The specifications of the Road Administration are recommended, which say that 20 cm of base course gravel or subbase material of
material type A or 25 cm of subbase material of material type B should be applied.
Between an insulated and an uninsulated road section it may be necessary to make a tapering of the insulating
.layer in order to obtain an acceptable transition with
regard to frost heaving. This is particularly of
importance when insulating with plastic foam against
rock and culverts. A transition from insulated to un-insulated layers can always be carried out by making the insulating layer thinner and in that connection it
may be necessary to reduce the volume of the insulating
boards at the end of the transition by making holes in
the boards, for instance. See figure 20. Another
possible construction of the transition from insulated to uninsulated sections is to space the boards with an increasing gap between each. However, the effect of such a transition has not been completely investigated
yet.
31
Figure 20. Transition from insulated to uninsulated
sections of plastic foam layers. The
insula-ting capacity of the outermost boards has
been reduced by the making of holes in the
boards.
32
BIBLIOGRAPHY
l. G.W. Reduction of frost heave by surcharge
1974.
Aitken,
stress. CRREL, Technical Report 184, Hanover, Skaven-Haug, S. Frostfundamenters dimensionering.
Frysevarme og jordvarme. Frost i jord, nr 3, Oslo 1971.
S. Studier Över tjällyftningsmekanismen. Stockholm 1964.
Fredén,
SVI, Specialrapport 22,
Stenberg, L. Bestämning av frusen vattenhalt i leror enligt kalorimetermetoden. VTI, Internrapport 232,
Linköping 1975.
Gandahl,
1974.
rapport 213,
R., Ljunge, M. Halkfält DKV, Stockholm
1. Undersökningar vintern 1974. VTI
Intern-Stockholm 1975.
N., T. Soil Burial Tests on
Packaging Material in Four Different Soils.
Nykvist, Troedsson,
Skogs-högskolan.
BYA, Statens Vägverk,
Stockholm 1976.
Byggnadstekniska Anvisningar,