IMPACT OF ENERGY STORAGE
TECHNOLOGIES IN A DISTRIBUTION
GRID
An analysis of Key Performance Indicators relating to a local grid’s
performance characteristics
KEVIN DAUN
School of Business, Society and Engineering Course: Degree Project in Energy Engineering Course code: ERA403
Credits: 30 hp
Program: MSc. Energy Systems
Supervisor: Maher Azaza, Mälardalen University Examinor: Eva Thorin
Date: 2021-06-07 Email:
ABSTRACT
The energy system is undergoing a transformation on a never before witnessed scale. The changes are driven by global market forces and technological advancements, improving on a seemingly exponential scale. This in turn has led to the price of both renewables and the accompanying technology decrease over time, making the transition into renewables more economically viable. The drawback of variable renewable energy is that it is variable and dependent on the surrounding environment. Therefore, storing the energy during hours of production, to be used at a later stage when energy demand is higher is becoming ever more important and an attractive option. The purpose of this degree project is to, from a set of performance indicators, evaluate three different energy storage technologies and their respective impact on a distribution grid. The examined storage technologies are: Batteries, Capacitators and a H2 Fuel cell. A literature study was performed in order to find out how
grid performance is evaluated, and how the different storage technologies operate. The obtained literature comes from scientific reports, and papers, found by utilizing Mälardalens University library-database. A model representing a Swedish grid with a connection point to the distribution side was created. The model is taken from previous credited work, and customized to fit the operational parameters of a Swedish grid. It was decided that the key indicators for evaluating the state of a grid was to look at the: voltage- and frequency variations, load factor, capacity factor and the overall system efficiency. The simulation is a discrete time simulation that utilizes parameters indicative of one full day of data. The results showed that, from a technological standpoint, the supercapacitor performed better in more categories than the Li-ion battery and H2 fuel cell. However, the Li-ion battery reduced the
peaks of the frequency measurements which is a key metric when deciding on grid health. Also, there is the added benefit of the battery and fuel cell of having a longer operational time before the state of charge is depleted. This increases the flexibility of the technology and could therefore be more beneficial in other applications where power supply is more scarce. Keywords: Energy Storage, Grid Flexibility, Key Performance Indicators, Power Grid, Variable Renewable Energy, Li-ion Battery, Supercapacitor, H2 Fuel Cell, Photovoltaic,
PREFACE
This is a graduating project performed with the intent to obtain a Degree of Master of Science in Engineering – Energy Systems at Mälardalen University in Västerås, Sweden. The project was supervised by Maher Azaza from January 2021 to June 2021 in the school of Business, Society and Engineering.
I want to give special thanks to Maher Azaza at Mälardalen University for assisting me through the course of this degree project. Providing me with useful information, tips and a great deal of professionalism.
Västerås, June 2021
SAMMANFATTNING
Energisystemet genomgår en global omvandling på en skala som aldrig tidigare bevittnats. Förändringarna drivs till stor del av globala marknadskrafter och teknologiska framsteg som till synes förbättras exponentiellt. Detta har lett till att priset för både förnybar energi, samt teknik för brukandet av dessa energikällor har minskat över tid, vilket möjliggör övergången till förnybart mer ekonomiskt lönsam än vad den har varit tidigare.
Nackdelen med förnybar energi är att den är varierande och starkt beroende av yttre väderförhållanden. En solcell producerar exempelvis ingen elektricitet under skymda skyar med låg solinstrålning. Ett alternativ för att kunna kapitalisera på den producerade energin, även när energibehovet inte är högt, är att implementera energilagring. Energilagringen är ett attraktivt alternativ och börjar bli mer och mer populärt runt om i världen, då den möjliggör lagring av energi vid perioder av lågt energibehov för att senare kunna användas när energibehovet ökar igen.
Syftet med detta examensprojekt är att från en uppsättning prestandaindikatorer utvärdera tre olika energilagringsteknologier och deras respektive inverkan på ett distributionsnät. De undersökta energilagringsteknologierna är: Batterier, superkondensatorer och en H2-bränslecell. En litteraturstudie genomfördes för att ta reda på hur nätprestanda utvärderas och kontrolleras i svenska nät och samt för att bilda sig en uppfattning om hur de olika lagringsteknologierna fungerar. Den erhållna litteraturen kommer från vetenskapliga rapporter och artiklar som hittats genom att använda Mälardalens Universitets biblioteksdatabas.
En modell som representerar ett svenskt nät med en anslutningspunkt till distributionssidan var tvungen att användas. Modellen är hämtad från tidigare krediterat arbete och anpassad för att passa de operativa parametrarna som är vanliga för ett svenskt nät. Här beslutades det att de nyckelindikator, för att utvärdera hälsotillståndet hos ett nät, som var mest angelägna att titta på var: spännings- och frekvensvariationer, belastningsfaktorn, kapacitetsfaktorn och den totala systemeffektiviteten. Simuleringen är en diskret tidssimulering som använder parametrar som är indikativa av en hel dag med data.
Resultaten visade att superkondensatorn, ur teknisk synvinkel, presterade bättre i fler kategorier än batteriet och bränslecellen. Batteriet minskade dock topparnas max-värde hos frekvensmätningarna, vilket är ett viktigt mått när man tittar på nätets operativa hälsa. Här finns också den extra fördelen med batteriet och bränslecellen att de har en längre drifttid innan de laddar ur. Detta ökar flexibiliteten och kan därför vara mer fördelaktig i andra applikationer där det råder en ökad strömförsörjning.
Nyckelord: Energilagring, Nät Flexibilitet, Nyckelindikatorer, Kraftnät, Variabel Förnybar Energi, Batteri, Superkondensator, H2 Bränslecell, Fotovoltaik, Energilagringsteknologier
CONTENT
1INTRODUCTION ... 1
1.1
Background ... 1
1.2
Purpose ... 3
1.3
Research questions ... 3
1.4
Delimitation ... 3
2
METHOD ... 4
3
LITERATURE STUDY ... 6
3.1
The Swedish Power Grid ... 6
3.1.1
Grid support for an increased share of VRE ... 7
3.2
Grid flexibility ... 8
3.2.1
Sources of power system flexibility ... 9
3.2.2
Tracking flexibility ... 10
3.2.3
Relative flexibility of ESTs ... 10
3.3
Energy storage ... 11
3.3.1
State of energy storage ... 12
3.3.2
Benefits of energy storage ... 13
3.3.3
Batteries ... 16
3.3.4
Capacitators & Supercapacitors ... 18
3.3.5
Fuel cells ... 19
3.3.6
Vehicle to Grid ... 20
3.4
Performance indicators ... 21
3.4.1
Voltage variations ... 21
3.4.2
Frequency variations ... 21
3.4.3
Capacity factor ... 22
3.4.4
Efficiency ... 22
3.4.5
Load factor ... 22
4
CURRENT STUDY ... 23
4.1.1
PV Generation ... 24
4.1.2
Energy storage system ... 25
4.2
Energy storage control system ... 26
4.3
Simulations ... 26
5
RESULTS ... 28
5.1
ESS ... 28
5.2
Standard test conditions ... 29
5.3
ES Integration ... 30
5.4
Relative EST Comparison ... 33
6
DISCUSSION ... 34
6.1
Key performance indicators ... 34
6.2
EST impact on grid ... 35
6.3
Grid flexibility ... 36
6.4
Power grid model ... 37
6.5
Limitations ... 37
7
CONCLUSIONS ... 39
8
SUGGESTIONS FOR FURTHER WORK ... 40
REFERENCES ... 41
APPENDIX A: MATLAB CODE
APPENDIX B: SIMULINK MODEL OF GRID APPENDIX C: SOLAR MODULE DATA SHEET
APPENDIX D: ENERGY STORAGE CONTROL SYSTEM
LIST OF FIGURES
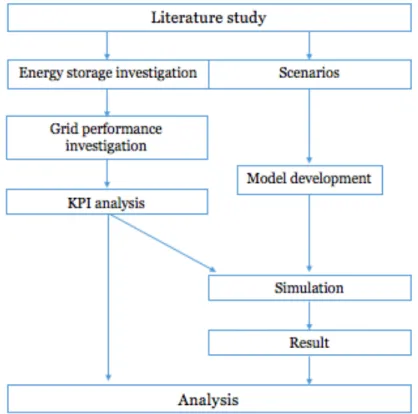
Figure 1: Flow chart of project methodology ... 5
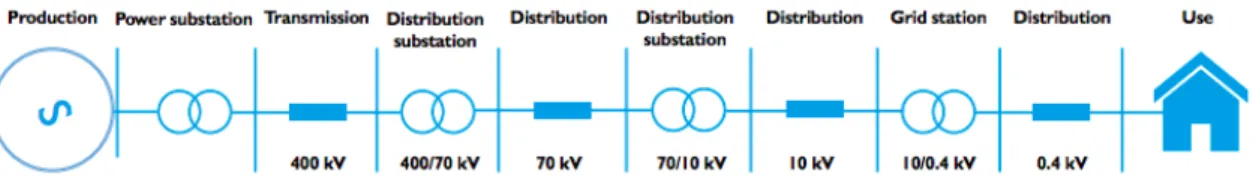
Figure 2: Illustrative representation from production to use through the electrical grid ... 6
Figure 3: Sources of power system flexibility ... 9
Figure 4: Relative flexibility of ESTs plotted against the power capital cost of product ... 11
Figure 5: Global energy storage power capacity by technology ... 13
Figure 6: Energy storage technologies mapped by capacity and power discharge rate ... 14
Figure 7: Energy storage load profile with peak shaving ... 15
Figure 8: Hydrogen fuel cell operating scheme ... 19
Figure 9: Global battery electronic vehicles sales projection ... 20
Figure 10: Single line diagram of the power grid model ... 24
Figure 11: Supplied power to grid ... 24
Figure 12:Modeled irradiance and temperature signal ... 25
Figure 13: Battery and supercapacitor SOC during ESS simulation ... 28
Figure 14: ESS current and reference current controlling the PI controller during ESS simulation ... 29
Figure 15: Voltage variations at STC ... 29
Figure 16: Frequency variations at STC ... 29
Figure 17: Frequency variations with integrated Li-ion battery ... 30
Figure 18: Voltage variations with integrated Li-ion battery ... 31
Figure 19: Frequency variations with integrated Supercapacitor ... 31
Figure 20: Voltage variations with integrated Supercapacitor ... 32
Figure 21: Frequency variations with integrated H2 fuel cell ... 32
Figure 22: Voltage variations with integrated H2 fuel cell ... 32
Figure 23: Relative comparison between technologies relating to the obtained KPIs from the simulations ... 33
Figure 24: Simulink model of power grid ... 3
Figure 25: Data sheet for solar module ... 4
Figure 26: Control system for the ESS ... 5
Figure 27: Distribution side of the power grid model ... 6
LIST OF TABLES
Table 1: Relative advantages and disadvantages of various ESSs ... 12Table 2: Chemical energy storage technologies for grid applications ... 17
Table 3: Relative advantages and disadvantages with different type of chemical energy storage technologies ... 17
NOMENCLATURE
Symbol Description Unit
C Capacity kW E Energy kWh L Load kW P Power kW T Temperature ℃ f Frequency Hz i Irradiance W/m2 𝜂 Efficiency % t Time Hours
ABBREVIATIONS
Abbreviation DescriptionAL-TES Aquiferous Low-temperature Thermal Energy Storage CAES Compressed Air Energy Storage
CES Cryogenic Energy Storage DTS Discrete Time Simulation
EDLC Electronic Double Layer Capacitor ESS Energy Storage System
EST Energy Storage Technology EU European Union
EV Electronic Vehicle
ICE Internal Combustion Engine KPI Key Performance Indicator MPPT Maximum Power Point Tracking NaS Sodium Sulphur
NiCd Nickel Cadmium PHS Pumped Hydro Storage PV Photovoltaic
RES Renewable Energy Supply SLD Single Line Diagram
Abbreviation Description SOC State of Charge
STC Standard Test Condition UPS Uninterruptable Power Supply V2G Vehicle to Grid
VRE Variable Renewable Energy VSC Voltage Source Converter
DEFINITIONS
Definition Description
MATLAB A programing language primarily intended for numerical computing.
Simulink MATLAB based graphical programming environment for modelling, simulating and analysing multi-domain dynamical systems.
1 INTRODUCTION
Over the past few decades, a more thorough understanding of climate related challenges that our world faces and a rising interest to combat them, have increased dramatically. This is due to most countries committing to the Paris Agreement where they aim to increase the share of renewable energy into their respective energy mix. This has led to most energy projections indicate that there will be an increase in renewable energy supply (RES) all over the globe. Renewable energy however, is very climate dependent and thus sporadic in its behaviour. Examples of such energy is solar and wind. A solar cell only produces electricity when it’s sunny, and respectively, wind power is only produced when it’s windy. This is why the need for an increase in variable renewable energy sources, leads to an almost equal need for energy storage technologies (EST) that can store the obtained energy during surpluses, and send it back out to the grid on a demand basis.
This implementation of more renewables is not easily done. The distribution grids also have to be modified and upgraded in order to handle this transition into more renewables. Currently they – the grids - are dimensioned to handle a specific amount of load, and work within a pre-determined voltage range. Any changes to the system without the right
adjustment can lead to grid instability, and in worst cases a complete shutdown of power supply. This is a reduction in grid quality that is best avoided, and thus regularly improving the grids to be able to handle this transition is at the forefront of most grid operators. The trends we currently see in storage technologies is a shift towards Li-ion batteries, but other countries have also chosen to invest more in hydropower with pumped storage. Here local restrictions and legislations plays a large part behind the reasoning of which technology to invest in, while also affecting the grid in different ways. There is a relatively new concept of vehicle to grid (V2G) taking place. Although this third option is probably a couple years down the line, the rapid pace of progress cannot be ignored and thus its concept can come to play a part in the renewable transition as well. Therefore, figuring out what type of EST that is most effective and most preferable becomes an important question for legislators and grid
operators alike.
This degree project aims to investigate how the different types of energy storage technologies can come to affect the grid in different ways, seeing as a local grid can only handle so much before becoming unstable. The evaluation is based upon a set of performance indicators that grid operators look at when determining grid stability.
1.1 Background
The energy system is undergoing a transformation on a never before witnessed scale. The changes are driven – mostly - by global market forces and technological advancements,
improving on a seemingly exponential scale. This in turn has led to the price of both renewables and the used technology decreasing over time, making the transition into renewables more economically viable. It is also forecasted that by 2025, the Nordic energy grid will increase their share of variable renewable energies (VRE) while reducing their share of coal and gas. In fact, most published papers indicate that the amount of renewables such as solar-, wind and hydro power is expected to increase in the coming years (REN21, 2020). The changes bring with it both new possibilities and challenges that grid operators must overcome. In a report from 2016, the four Nordic power grid companies identified four main challenges that the power grid will face, and also provided solutions for changing the grid into something capable of overcoming the future challenges. The main challenges are: an increased demand for flexibility, security of energy supply, frequency quality, and securing inertia in the system (Svenska Kraftnät et al, 2016).
In relation to grid operations, flexibility is defined as the controllable part of production and consumption that can be used to change input or output power for balancing purposes (Svenska Kraftnät, 2020). It comes to no surprise that when talking about an increasing demand for flexibility, we are realistically talking about increasing our capacity for storing various forms of energy to be used at a later stage. It follows naturally that the proposed solutions to overcome the first challenge of ensuring grid flexibility, is an overall increase in energy storage capabilities. This will help balance the variations in energy demand, and is a controllable part of production and consumption (Svenska Kraftnät et al, 2016).
Hydropower in Sweden currently covers about 45% of the generated electricity, and 75% of the available waterpower is developed for power production purposes. The focus now
however is not to increase this number to operate at full capacity, but rather to improve upon the current facilities from an ecological standpoint and to make sure they comply with new environmental regulations (Naturskyddsföreningen, 2020). In Sweden, before a new hydropower station can start up, the current regulations demand that a reasonable
performance balance is performed, where the benefits of the added power are weighed to the possible negative effects it can have on to local wildlife (Miljöbalk, 1998). This does not however discredit the fact that the storage capabilities of hydropower are large. Currently, pumped hydro storage (PHS) accounts for about 95% of all utility-scale energy storage. It also has a very low CO2 emission factor, a low carbon footprint, and very long life span (VGB
Powertech, 2018).
Even though hydropower is becoming more and more limited by current regulations, one storage technology that is on the uptick is batteries. This trend can be witnessed in Sweden with new companies like Northvolt – a battery manufacturing company of Li-ion batteries – being granted funds upwards of 52,5 million euros from the European Investment Bank, and collectively about 25 million euro in grants from different Swedish instances such as the Swedish energy agency. The batteries are used for both electro mobility, but also as state of the art storage technologies.
One such technology comes in the form of a relatively new concept of Vehicle-to-grid. What V2G does is that it turns the electric cars of the public into virtual power plants (Wagner, 2014). Although the same battery technology – in the form of mainly Li-ion batteries – is
used in the cars as in alternatively strictly for energy storage purposes, this concept aims to optimize the dichotomy between transport and power production in everyday life. What makes this such an attractive alternative is mainly due to the fact that electrical cars are becoming more common, thus simultaneously increasing the amount of available storage capacity, without the need for specific deployment of large scale energy storage by outside actors. It is basically a problem that – in the best case scenario - is solving itself.
1.2 Purpose
The purpose of this study is to, from a set of performance indicators, be able to evaluate different energy storage technologies and their respective impact on a local distribution grid. The examined storage technologies are: Batteries, Capacitators and a H2 Fuel cell.
1.3 Research questions
• What indicators should be used to evaluate the performance of a grid? • How do the different energy storage technologies affect the grid?
• Which of the examined technologies is most preferable – from a technological standpoint – for a local grid?
1.4 Delimitation
The project is delimited to only focusing on the Swedish power grid, and its parameters relating to grid quality. The simulation is performed as a discrete time simulation (DTS), utilizing parameters to represent 1 day of events occurring, thus neglecting degradation and thermal effects on equipment. The different technologies have to be commercially available. Furthermore, the performance of the grids resiliency is neglected since the simulation period is short and does not cover the span of a full year.
2 METHOD
To get an understanding for how grids are evaluated in the Swedish sector, a literature study was conducted. The study focuses on what characterises a stable grid, and what type of parameters are commonly used for this type of grid stability evaluation process. The obtained literature comes from scientific reports, and papers, found by utilizing Mälardalens
University library-database. Here, keywords included: power grid, indicators, stable grid characterisation, key performance indicator (KPI), and Swedish power grid.
There are many different types of indicators one can chose from when trying to evaluate the performance of a distribution grid. For example, one could pick indicators purely relating to customer satisfaction, and other economic variables. Hence, in order to keep the analysis on a technological level, indicators were picked with the idea in mind that they are able to follow the power grid transition that promotes: flexibility, reliability, and VRE integration.
A similar research methodology was used when searching for previous, and related works of comparing different energy storage technologies, and their respective impact on a
distribution grid. Here the key words used were: energy storage technologies, power quality, and power grid flexibility. In this case Google Scholar was mainly used in order to pool the results from all available public domains and sorted by publication date. Research from 2018 and forth was prioritised over other older works, since the concept of grid flexibility is a very recent and trendy concept when discussing power quality in grids.
In order to analyse the impact of the respective EST, a model representing a Swedish distribution grid had to be set up. The model was built using Simulink – in MATLAB - and used a power grid model from previous credited work as an outline for constructing the model (Lindstens, 2017). Here MATLAB was the preferred software to use, seeing as it is optimal for mathematical and technical computations. Temperature data and irradiance data was modelled using a ramp up and down simulation block, seeing as real world data for such parameters can be difficult and expensive to obtain. The overall impact on the results
utilizing this approach is negligible. Here four key performance indicators (KPIs) were chosen to assess the grid quality: voltage variations, frequency variations, capacity factor, efficiency, and the load factor. After the simulation was performed, and relevant results were obtained, the evaluation of the selected KPIs could be performed.
The figure below presents the process of the methodology.
3 LITERATURE STUDY
In this chapter, the main aspects of the Swedish power distribution grid are explained, with focus on the local level for a smaller distribution network. Here the characteristics of what indicates a grid of good performance are explored, and the KPIs presented. Furthermore, the different energy storage technologies are explained, and the challenge of grid integration for more renewables is explored through the lens of achieving a higher grid flexibility.
3.1 The Swedish Power Grid
Essentially, a power grids main task is to facilitate the transport of energy generation to the end user. The generated energy itself can come from different types of primary resources such as: wind, solar, hydro, coal, oil or nuclear. The load to this system is represented by the consumers of the system i.e. households and industries. Here there is a mismatch between the generated energy and the loads, where the loads are significantly larger than the
generation itself, and the energy is supplied instantaneously when produced. Therefore, there is a need for effective transmission of the power from the generation to the loads.
A power grid, as we know it, is made up of two categories: the transmission grid and the distribution grid. However, in Sweden these categories are split into three categories, here we have the national grid, regional grids and the local grids. Currently there are no exact
regulations for what categorizes the type of grid you’re observing, but there are voltage intervals that more or less correlate to a specific type of grid (Andersson, 2008). The national grid is our transmission grid with the main objective to transmit power over very long
distances, with only minor losses to the regional grids. It’s operating voltage is between 220 kV and 400 kV and is managed by the public enterprise Svenska Kraftnät. They are
responsible for managing the relationship between load and production, and ensuring that the power demand is met throughout the country at all times. The regional grids operate between 20 kV and 130 kV and send the power out to cities, where the local grids – operating within the specified voltage range of 0.4 kV and 20 kV - main focus is to distribute the
acquired power out to the end consumers such as local households and industries (Nordling & Nordling, 2016). It is common for the regional grids to be owned by smaller grid
companies, since responsibility of power supply can be delegated down the chain and is an effective way of keeping operating procedures simple. The figure below gives a very
illustrative picture of how this chain is connected.
The Swedish power grid can be seen as one entire system, tying together producers,
consumers and equipment alike. In Sweden, the equipment and frequency that our systems operate from is set to 50 Hz. It is therefore one top priority to have the grid always operate at this specific frequency. Parts of the power system also need to be strong enough to handle interruptions or failures. Meaning that they need to keep supplying the system with the same amount of power even though their interconnections to other equipment that is failing can drastically limit their efficiency and working capacity. If they were unable to do so, there is an increasing risk for system collapse (Lindholm, 2020).
In Sweden, the standards for a healthy grid is a grid that operates within the given frequency and voltage limits. The frequency should always be as close to 50 Hz as possible. Here there is an acceptable operating window between 49.9-50.1 Hz. If the frequency is outside this range, there is a mismatch between consumption and production. This balance is regulated both automatically and manually by an increase or decrease of production. Maintaining the voltage is also a most important aspect, and depending on what type of grid you’re dealing with there are specific voltages that needs to comply (Lindholm, 2020).
3.1.1 Grid support for an increased share of VRE
When it comes to Sweden’s share of renewables, the country’s power system is largely already de-carbonised, thus putting it well ahead many other countries in the European Union (EU) of meeting the goals from the Paris agreement. Sweden is able to do so by having a large share of hydro- and nuclear power, while also incorporating a large share of biomass for district heating. There is an ambitious goal set up by the Swedish authorities to have a power system by 2040, being fully reliant – 100% - on renewables and completely de-carbonized by 2045 (IRENA, 2020). Doing this while simultaneously complying with policies and
regulations, and ensuring grid stability demands innovative solutions. One part of the proposed solutions which deals with enabling technologies, is an increased share of energy storage via utility scaled batteries, and the concept of smart charging.
Increasing the amount of VRE into the distribution grid is not as simple as building more renewable power generating stations and connecting them to the distribution grid. The main problem with VREs is that they are – for better or for worse – variable. The random
uncontrollable power production from these resources therefor put a lot of pressure on the grids to be adaptable and handle the random fluxes in production with a high efficiency, and minimal losses. More commonly it is referred to as a need for the grid be stable, flexible and adequate. The stability is the grids ability to quickly – down to milliseconds – be able to maintain power quality with a fast response to load variations, flexibility is required to compensate for variability in supply and demand while maintaining its balance, and adequacy is the ability to meet the energy demand for end-users at all times (Feller, 2019). The question then remains: how much more energy storage is needed to achieve Sweden’s 2040 renewables goal? In an article researching the optimal storage amount needed for incorporating large shares of renewables to an energy system, it was found that an optimally utilized storage of about daily average demand would be sufficient to ensure a 90%
little different. The International Energy Agency (IEA) estimates that the global capacity of energy storage needs to increase by about 40.5% by 2030 to keep the global warming target of 2℃ in check (EESI, 2019). In Sweden, the figures from 2019 indicated that the average daily electricity demand was 382 GWh (SCB,2020). This would indicate that solutions not solely related to domestic energy storage is needed to achieve the goal of becoming 100% fossil free by 2040.
With an influx of storage capabilities to the grid, we will continue to see positive side-effects from an increased share of VRE. The grid can continue to support this transition up to a point to where the variability becomes too much. Thus we can support more renewables, but at a limited level due to the way our power system network is set up. Here we would have to see more cooperation on an international level in order to ensure green energy supply, and even then making sure that the energy that comes in is of the same clean nature that is generated on domestic soil, is another challenge in and of itself. This solution to grid
flexibility is something that is very real. It’s becoming more and more common for countries to cooperate and match their energy demand across borders. Improvements to the grid itself is also necessary to foster this transition (IEA et al, 2015). At current state, the grid would be unable to support this transition, since VRE penetration of 100% is very challenging unless a system is adequately interconnected (IRENA, 2018).
3.2 Grid flexibility
Flexibility – in regards to power system studies – describes the degree to which a power system can adjust the electricity demand or generation in reaction to uncertainties
(Babatunde et al, 2020). Similarly, it’s described as the ability to reliably and cost-effective manage variability of demand across all relevant time-scales (IRENA, 2018).
Today, the power system industry is undergoing major changes. These changes are mainly of technological and economical nature, both via deregulatory actions and a total restructure of the power system market as we know it. This is mainly due to the raise in competitors across sectors, where efforts towards increasing research activities for integration of large-scale renewable sources has been the main focus, but also the overall changing of policy framework that encourages, and thus increases, the penetration of these intermittent energy sources to the energy mix. These changes are expected to reduce emissions, satisfy the electricity
demand, and ensure an environmentally viable energy system. The features of VRE resources cause uncertainties in meeting the energy demand, while reliably operating within the limits of voltage and frequency variations that ensures power system operational quality. In order to do this effectively, there is a need for increased flexibility. The flexibility will play a key role in the energy transition and evolution of the power system as we know it, since it secures the integration of more renewables into the energy mix while also reducing emissions
(Babatunde et al, 2020).
The increase of VRE introduces additional levels of uncertainty in the net load of the system. This is problematic since the net load is a very important metric, used to extract important information for long-term power system design (IRENA, 2018). Therefore, in order to
increase the share of VRE into power grids, substantial transformations of the current grids are necessary in order to increase flexibility (IEA et al, 2015). In their report on renewable energy integration for power grids, IEA, ETSAP and IRENA put forth four main ideas that would help with increasing grid flexibility:
• Allowing electricity flow from small producers and users • Establish intelligent grid demand management
• Improve grid interconnections nationally and internationally • Increase energy storage capacities
These solutions would aid the transition in different ways. The flow from smaller producers would ensure grid stability during times of installing distributive generation. The grid demand management deals with reducing peak loads, while an added amount of interconnections ensures security of supply and furthers balancing capabilities. Energy storage helps in various ways, but here mainly it’s mentioned as a means of storing energy at times of energy surplus, which later can help with general energy balancing within the power system network (IEA et al, 2015).
3.2.1 Sources of power system flexibility
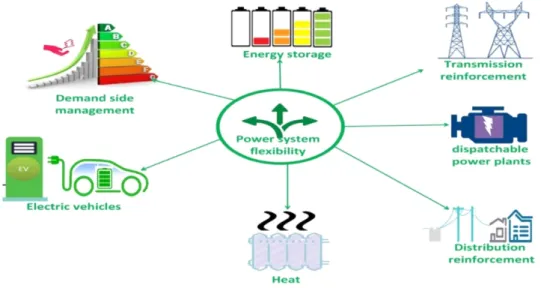
In the past, power system networks used dispatchable power plants as a means for achieving flexibility. At this time, VRE was very limited, therefore i.e. gas turbines that quickly could be activated and deactivated was the preferable choice. Today there are other ways of achieving a high level of flexibility within the power system network. Some of these are: Demand side management (DSM), energy storage, electric vehicles, transmission- and distribution reinforcement. These can be seen in the figure below.
Figure 3: Sources of power system flexibility (Babatunde et al, 2020)
As we can see energy storage is a very attractive way of achieving system flexibility in today’s age. However, when compared to DSM and the other sources of power system flexibility, energy storage is more expensive due to high installation and production costs. Most common today is to deploy larger scale energy storage systems – such as PHS - on the
transmission network, and medium and small scale energy storage on the distribution network. At the smaller to medium scale, batteries, fuel cells, capacitors, and fly-wheels are some common alternatives. This way of energy storage implementation has proven results of achieving a higher flexibility within the power system network (Babatunde et al, 2020).
3.2.2 Tracking flexibility
Several studies that assess system flexibility either have an overall system perspective, while other studies are very specific in their way of pinpointing flexibility. There is no general consensus of what defines a system as flexible, but in recent years several attempts have been made towards this goal. In general, the definitions vary too much and are either too specific or very general in their execution. It is therefore necessary to include a metric for assessing flexibility that includes both technical and non-technical metrics to avoid this problem. The proposed metric for tracking the flexibility of a system – that is most recent – takes technical, market, regulatory and policy domains into consideration and asses them on a relative scale of 1-5, going from not flexible to very flexible. The categories here are created with the idea in mind that higher VRE penetration levels will force the power system to be stable and reliable during the transition, thus ensuring flexibility (Papaefthymiou et al, 2018).
Explored here are the five categories of: supply, demand, grid, storage and markets. The assessment is either done quantitatively, or by quality assessment. This entirely depend upon the study itself, where obtained data or extensive studies lay the groundwork for the depth of the respective analysis (Papaefthymiou et al, 2018). Within the five main categories there are a number of sub categories for assessing flexibility. Here one would have to specify the type of domain to look at, and pic relevant KPIs from there. This is what’s mentioned in the paper as a comparative analysis, where one can examine very complex systems – such as a
countries relative flexibility in several domains – in a very simplified and readable way. The results are commonly transferred into a radar chart with five axes.
3.2.3 Relative flexibility of ESTs
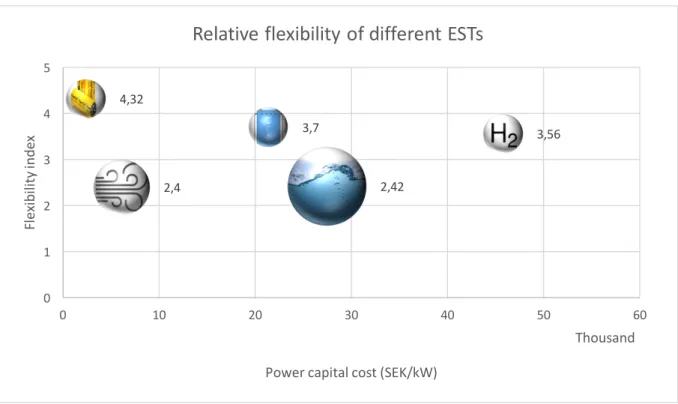
To get an understanding for the relative flexibility between different ESTs, a diagram that plots the flexibility against the cost of the technology has been created. This was done by assessing different source material from reports that deal with energy storage for grid applications. Here considerations that foster flexibility towards VRE integration for the long run generates high scores, while technologies that are limited by time will score lower. Batteries are considered a short term storage option when it comes to grid applications, and in comparison to PHS - which has a much longer storage time - would here generate a lower score in that area. The total flexibility score for each technology was then generated, taking categories such as: charge-, storage, discharge time, application range, environmental impact, life time, and efficiency into consideration. It was then plotted against the power capital cost of the product. The scores are relatively assessed, meaning that they are compared to one another on a relative scale with non-dimensional numbers. The resulting figure can be seen below. The technologies on display are: Supercapacitors, CAES, PHS, Li-ion batteries, and a H2 Fuel Cell.
Figure 4: Relative flexibility of ESTs plotted against the power capital cost of product (Das et al, 2018; Evans et al, 2012)
What the figure shows it that the supercapacitor – having a relative flexibility of 4.32 – is a very flexible and cheap alternative compared to the other technologies. This should however be taken with a grain of salt, seeing as the storage time is the shortest of all technologies and thus is more relevant for frequency regulations, rather than large bulks of energy storage. The Li-ion batteries scored higher – 3.56 - than the H2 Fuel Cell, and is the cheaper alternative.
3.3 Energy storage
For distribution networks, the primary objective of an Energy Storage System (ESS) is to convert the electrical energy into a form that can be stored and converted back to electrical energy when needed (Das et al, 2018). There are mainly four different types of storage technologies: mechanical, thermal, chemical, and electrical (Evans et al, 2012). The types explored in this project are electrical storage, via the use of capacitors and supercapacitors, electrochemical storage via batteries, and chemical storage via a fuel cell. Seeing as each of the presented technologies comes with its own advantages and disadvantages, a way of selecting the most suitable system for the specific application becomes important. Deploying an ESS is also a large investment and selecting ESSs appropriately on the basis of
performance expectations is very difficult (Das et al, 2018).
In the table below, different types of potential ESS for grid applications can be seen. Here their advantages and disadvantages are presented in order to better understand the reasoning when weighing technologies against each other. Here aspects such as
environmental impact and technical aspects have been summed up in order to efficiently
4,32 2,42 2,4 3,7 3,56 0 1 2 3 4 5 0 10 20 30 40 50 60 Fl ex ib ili ty in de x Power capital cost (SEK/kW) Thousand
Relative flexibility of different ESTs
display the overarching aspects that are considered when choosing a technology for energy distribution purposes.
Table 1: Relative advantages and disadvantages of various ESSs (Das et al, 2018; Evans et al, 2012)
Category ESS
technology
Advantages
Disadvantages
Electrical
Capacitator Fast responseHigh cycle life
Low capacity Low efficiency Super capacitator High efficiency Long life
Toxic and corrosive Low energy density
Mechanical
PHS High capacityLow cost/unit capacity
Disturbance to local wildlife and water level
CAES (large scale)
High capacity
Low cost/unit capacity
Difficulties with site selection
Electrochemical
Lead acid Low capital cost Low energy densityLi-ion High power and energy density
High efficiency
Require recycling of costly lithium oxide and salt
Chemical
H2 Fuel cell Almost zeroself-discharge
Long term storage Wide range of applications
Expensive catalyst
Thermal
CES High capacityLow cost
Low efficiency AL-TES Environmentally
sustainable Low lifetime
3.3.1 State of energy storage
It is clear from the previous section that no matter what energy storage system one might chose, it comes with its relative advantages and disadvantages. Current trends in energy storage globally favours mechanical storage via PHS, which currently holds the highest share of capacity by all technologies. Several new PHS facilities were underway in 2019 globally, specifically to facilitate the integration of more renewables (REN21, 2020). Batteries in both European and global markets increased their share of storage capacity from batteries. China added 855 MWh, USA added 1113 MWh, while Europe contracted 1 GWh of storage capacity. Currently, USA is leading the market in stand-alone utility scale batteries, but other
European countries, such as Germany, had the highest installed capacity of batteries for residential storage in 2019. This can be directly tied to the policies and subsidies that
currently exists in the German market that makes energy storage a viable economical option for its population. In general, there was a very notable cost improvement for batteries which increased the manufacturing capacity, with the cost of electricity from Li-ion decreased by half and average unit cost of such a battery fell by 85% between 2010 and 2018. These changes are making VREs compatible with more traditional fossil fuel dependent technologies (REN21, 2020).
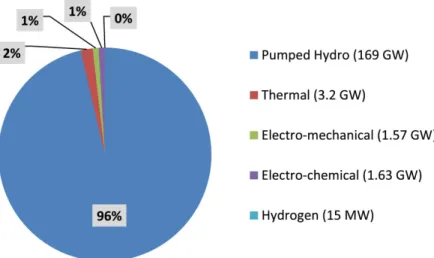
In the figure below, we can see how the current distribution of the technologies are globally. Here the storage technologies are in various stages of maturity, and are applicable for different scales of operations. Pumped Hydro Storage (PHS) is most suited for large scale applications, and globally covers 96% of total installed capacity. Thermal energy storage currently covers about 2% of the total capacity, followed by electrochemical energy storage via the use of batteries, electro-mechanical at 1% and finally hydrogen storage coming in at <1% (Argyrou, 2018).
Figure 5: Global energy storage power capacity by technology (Argyrou et al, 2018)
3.3.2 Benefits of energy storage
When discussing the potential benefits of an ESS, it is important to be specific about the actual application of where such a system gets implemented. For one, energy storage is a very wide area of expertise, and it is not certain that the benefit of one storage technology
automatically carries over between industries. You can think of an example with a very large battery being installed for smaller community. It is bound to bring with it some positive effects. The question then follows: would the same battery installed at – let’s say – a power plant have the same type of impact? In a way it would, seeing as it can perform the same tasks, but the effect on this type of end user is significantly less in comparison. The choice of the ideal storage method therefore is dependent on several factors, such as: amount of required energy, is the scope long term or short term storage? environmental issues and so forth (Argyrou, 2018). Today energy storage is not a fix-all solution for the shortcomings of our electricity delivery system, but it may one day become a vital part of it, and the current benefits indicate just that (EPRI-DOE, 2003).
Today there are a lot of potential problems that could affect a grid and its ability to supply power qualitatively and reliably. The most common way to group these problems is into three categories: Uninterruptable power supply (UPS), grid support and for energy management. In the figure below, all storage technologies have been summarized by their power capacity and power discharge time. This is useful when considering what technology is most suitable for the application.
Figure 6: Energy storage technologies mapped by capacity and power discharge rate (Argyrou et al, 2018) Energy storage can provide advantages to all three of these aspects which relates to the power grid distribution chain: generation, transmission and distribution (Lindstens, 2017). There are a number of ways to categorize the benefits of energy storage. Down below some of the most important aspects are shown, and explored further.
• Emergency response • End-user • Grid infrastructure • Peak shaving • Power quality • Renewable integration Emergency response
In the case of a larger network failure, energy storage can act as an immediate supplier of energy in attempts to cover the demand till the network is restored. Similarly, a larger reserve of energy can come in handy in the case of a so called “back start” having to be put to use. A back start is a complete start-up of the network from a shutdown condition. There is also the need for maintaining an uninterruptable supply of energy. This problem is not limited to larger network operations, but also useful for security centres, and larger servers, where data must be protected. Here there can be no delay in the supplied power, since it would result in immediate data losses. For all cases, a fast response time is vital. Therefore, batteries and super capacitators are very suitable methods. In some cases, hybrid systems have proven useful (Argyrou, 2018).
End-user
The end-user, can draw several benefits from energy storage in grid applications. The main benefits include – but are not limited to - managing cost for electric service, reducing financial losses due to poor power quality, and reduced financial losses due to unacceptable electric service reliability (EPRI-DOE, 2003). Primarily, electrical storage is most suited for commercial and industrial end-users whose overall energy cost is high and where a power-related down-time has high cost. Here the cheap energy is stored during times where the electricity price is low, and then later utilized during times when the energy demand is increased, along with the price rate.
Grid infrastructure
Storage can help with power supply and improved power quality at areas where there are problems with the transmission, or downstream from main transmission lines. Here an ESS can reduce the strain on the transmission system during peak demand hours. Potential benefits from this is reduced energy losses, and a longer lifetime of equipment since the thermal stress posed on the system during peak hours is reduced (EPRI-DOE, 2003). Peak shaving
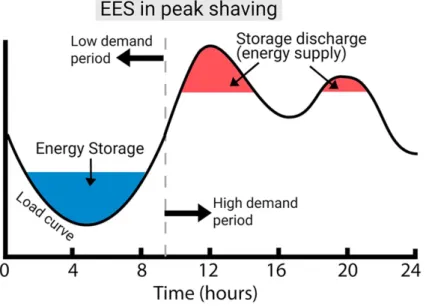
Peak shaving is a term relating to energy usage optimization, by shifting the pattern of energy supply so that energy consumption during peak hours – when demand is high – shifts to the hours of off-peak periods (Argyrou, 2018). In other words, the energy is stored during periods of excess VRE, and then later released to the grid when the demand is high. For this to work efficiently, the EST has to be scalable and able to provide a continuous supply of energy for some time – minutes to hours. Here using batteries and/or fuel cells is very common, seeing as they have a fast response time and can provide energy for the specified time interval. In the figure below the concept behind peak shaving can be visualized.
Power quality
Frequency and voltage stability is also an area where energy storage can help balance the shortcomings in the power grid and thus provide a clean, stable and qualitative power flow, which is what we refer to as a having a high power quality. Common contributors to voltage instability is the reactive power flow and presence of transients and harmonics throughout the network. The installed equipment in the network is set to work for a specific frequency, and if this is continuously altered, the sensitive parts of the equipment can be damaged. Similarly, the frequency can change depending on the load from the system. This is because the generators in the network are asynchronous machines, and will slow down if the load is increased and wind up if the load decreases. This causes the frequency to change, and since large frequency fluctuations can cause a system collapse, this is very important to keep hold on. Energy storage can help counteract both these problems. Here a fast dispatch rate is important, since it can help cover these shortcomings in power supply and in turn it improves the power quality for both producers and consumers alike. For Photovoltaic (PV) systems and wind turbines, supercapacitors have been shown to smooth these fluctuations caused by the irradiance variations (Argyrou, 2018).
Renewable integration
Ways of trying to integrate more and more renewables such as: solar, wind and hydro are quite limited. The main downside to these type of intermittent resources is that they do not produce power on a demand basis, meaning that the output from these intermittent
resources are very difficult to predict. Therefore, energy storage can aid when trying to integrate more renewables into the grid, since it is a way to maximize the benefits by time shifting the output of non-dispatchable renewables generation (EPRI-DOE, 2003). Here there will also be an increased demand for storage capacity, since they – renewables and storage – naturally complement one another. Some additional benefits here is a reduced environmental impact, and an overall reduction in fossil emissions that would otherwise occur, such as air pollutants and carbon dioxide emission (Loveless, 2012).
3.3.3 Batteries
As mentioned earlier, batteries are a form of chemical energy storage. The basic design of an electrochemical cell consists of a positive and a negative electrode, separated by an
electrolyte, creating a flow of electrons (Berg, 2015). The cells are then, depending on the application, connected in series and/or parallel to achieve the required voltage, power and capacity. This connection of cells is what we more commonly refer to as a battery. On the market today, there are a variety of different battery technologies to choose from. Slowly emerging to become the most widely used technology, is that of the Lithium ion battery (Li-ion). However, as of today, when relating chemical storage to grid applications, Li-ion is still considered an immature technology, whereas Lead-acid is the more preferable and
considered of mature nature. In general, however, batteries are considered mature for energy storage applications, is classified as a long-term energy storage device (Argyrou et al, 2018).
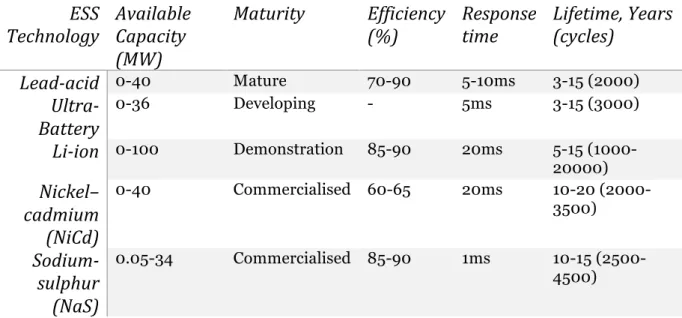
In the table below, the different type of electrochemical storage technologies is presented in the way of development status, relating to grid applications. Here there are many different type of technologies, and the only one with mature status is the Lead-acid one. Most other technologies are in either development status, or for demonstration purposes. However, this does not exclude them from future use, seeing as Li-ion is still the preferable choice for Electronic vehicles (EVs) and every day electronic devices.
Table 2: Chemical energy storage technologies for grid applications (Das et al, 2018)
ESS
Technology
Available
Capacity
(MW)
Maturity
Efficiency
(%)
Response
time
Lifetime, Years
(cycles)
Lead-acid
0-40 Mature 70-90 5-10ms 3-15 (2000)Ultra-Battery
0-36 Developing - 5ms 3-15 (3000)Li-ion
0-100 Demonstration 85-90 20ms 5-15 (1000-20000)Nickel–
cadmium
(NiCd)
0-40 Commercialised 60-65 20ms 10-20 (2000-3500)Sodium-sulphur
(NaS)
0.05-34 Commercialised 85-90 1ms 10-15 (2500-4500)The main advantage with batteries is that they are not location bound. Where hydropower needs running water to function, batteries can be deployed seemingly anywhere. When looking at some key power grid applications that can be affected by introducing chemical energy, which are: renewable integration, energy management, voltage support and power quality. They – the batteries – all show the same result of having a proven positive impact on the intended application (Das et al, 2018; Lindstens, 2017). In the table below, the relative advantages, disadvantages with the different battery chemistries are presented.
Table 3: Relative advantages and disadvantages with different type of chemical energy storage technologies (Das et al, 2018)
ESS
Technology
Advantages
Disadvantages
Lead-acid
Low capital cost Low energy densityUltra-Battery
Low capital cost
Better performance than lead-acid Low energy density
Li-ion
Higher power and energy densityHigh efficiency
Require recycling of costly lithium oxide and salt
NiCd
Higher power and energy densityGood efficiency Highly toxic
NaS
Higher energy density and efficiencyAlmost zero self-discharge
High production cost Needs recycling of Na
Where the future of batteries is heading is somewhat unclear. As the price of Li-ion batteries is steadily declining, and newer recycling methods that prevents resource exploitation is deployed, the near future seems to tend towards a larger share of Li-ion batteries for most industries. Improving upon areas within the battery itself to try and increase the capacity, improve its energy density, and cycling life, with the end goal to further reduce the overall cost of production. There are batteries in development that have different forms of chemical compositions and could potentially quickly take over the market, but like the previous tables have shown, these are still not commercialized.
3.3.4 Capacitators & Supercapacitors
A capacitor works almost in the same way as battery, in a sense that it stores energy by some means. Although the amount of energy stored is not as great in comparison to a battery, the speed at which one can access that energy is drastically enhanced in a capacitor. This is why a capacitor is used in almost every electrical application, since it smooths out the energy
supply. You can think of it as a circuit connected to flashlight and a battery. If by some interruption that circuit is broken, the light will stop until we connect it again. If a capacitor would be added to the circuit, we could maintain a steady supply of light from the flashlight even though small interruptions in the connectivity between the battery and flashlight were to occur (Evans, 2019).
Capacitors operate by storing energy in an electric field between the two electrodes, separated by an insulating material. Their storage capabilities are promoted with an
increased electrode surface area, and a reduced thickness of the insulating material (Evans et al, 2012). What holds them back for further consideration within energy storage circles is their low energy density coupled with a low capacity. Here they are outperformed by supercapacitors which is currently the preference when dealing with large scale storage applications.
The supercapacitor have the same operating procedures as a normal capacitor. However, the separating material is replaced by electrolyte ionic conductor, thus achieving a much lower separation distance between the electrodes (Evans et al, 2012). The supercapacitor is what’s known as an electric double layer capacitor (EDLC). The advantages with supercapacitors are many. With a high capacity, long cycle life, a wide temperature operating window, and fast charging. In some cases, they have also shown to decrease voltage and power fluctuations for grid connected fixed-speed wind generators, thus positively impacting the grid compared to the normal capacitor (Evans et al, 2012). Taking this into consideration, it is easy to see why they are attractive when discussing energy storage for grid applications.
What currently holds a mass implementation of this technology back as a storage option is that they have a negative effect on the voltage - with a low output voltage and large voltage variations – and also a high rate of self-discharge. This add to the complexity of the
integration into the power system as more technology needs to be added as a safe-guard towards these implications. Therefore, they are more suited for energy smoothing within the grid, rather than energy storage (Valvo, 2021).
3.3.5 Fuel cells
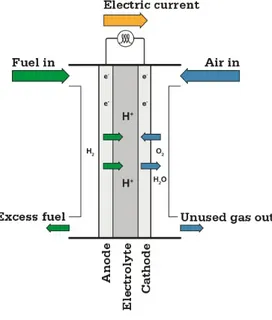
A fuel cell is an electrochemical construction that converts electrochemical energy into electricity and is able to store it. Electricity is produced when the fuel (anode) and oxidant (cathode) react in the presence of an electrolyte, it’s what commonly referred to as a redox reaction (Evans et al, 2012). Fuel cells are different from common batteries in that they can produce electricity continuously for as long as fuel and oxygen are supplied. Evans explains it as follows: “This is possible because a reversible fuel cell is designed so that the reactant and electrolyte produce electricity plus products, which can be reversed by the addition of electricity to change the product back into the initial reactant” (Evans et al, 2012).
The fuel cell consists of two electrodes – the anode and cathode – were the former is
negatively charged and the second has a positive charged. They are both emerged around the electrolyte, and fuel is supplied to the anode, while air is supplied to the cathode. At the anode, a catalyst separates cells into electrons and protons. The electrons then go through an external circuit, which creates a flow of electricity (Energy.gov, 2021).
Figure 8: Hydrogen fuel cell operating scheme (Power Cell Sweden, 2020)
So why would one suggest using fuel cells as a means for energy storage? For one, they have an uninterruptable energy supply (UPS) which makes them very useful for portable power applications in the military sector and for usage in other portable devices. At large scale, they can be used as a power backup for various energy systems, due to their very low emissions compared to other technologies, and a rather high efficiency, around 35-60%, compared to an ICE for example that operates around 20-40%. Its operations are also very silent, the system itself is not very complex, and it can operate for much longer periods of time compared to a battery (Valvo, 2021).
As of today, fuel cells are not cost effective enough to be used at scale. They also have a very slow reaction speed compared to other storage technologies, which could be a drawback for counteracting variations in the power supply. This reaction speed can however be improved by increasing the electrode area and/or the temperature, but then again this increases the
costs of the system which are already very high. On top of this, the fuel – primarily hydrogen - is very difficult to handle and transport safely (Valvo, 2021).
3.3.6 Vehicle to Grid
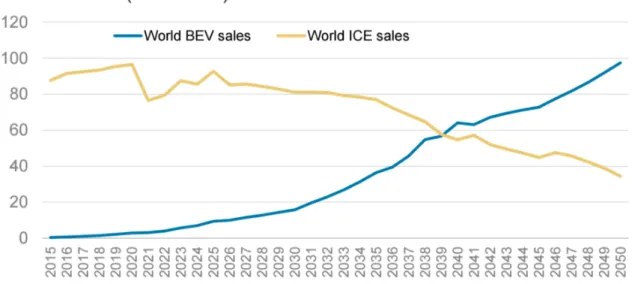
Although Vehicle to Grid is not stand alone technology, but rather is dependent on the progress within the battery industry itself, with batteries becoming more efficient and having an increased storage capacity, the option to integrate the natural transition into electronic vehicles into the energy system is becoming increasingly tempting. The technology is making integrating renewables more efficient, it mitigates grid bottlenecks and minimizes grid volatility. It is therefore seen as a key component in strategies to address climate change (ABB, 2021). Before 2050, most sources indicate that the amount of electronic vehicles will surpass the internal combustion engine (ICE) in its amount of users, and the progressions are ever increasing in the same direction (Desjardins, 2018). This can be seen in the figure below.
Figure 9: Global battery electronic vehicles sales projection (Desjardins, 2018)
As mentioned previously, V2G aims to optimize and change the way we think about and interact with transport in everyday life. The concept is rather simple. Since EVs have a battery that at times need charging via grid connected charging stations, utilities will be able to access the renewable energy stored in vehicles to better balance loads (ABB, 2021). One single car itself would not be enough, since the capacity would be too small, but as a
collective, electric cars would store and dispatch electrical energy stored in networked vehicle batteries that together act as one collective battery fleet (Wagner, 2014).
This opens up the door for new markets. With bi-directional charging stations – stations where the EV is grid connected while charging – the option to sell back power during peak demand hours will become possible. Thus feeding back power to the grid from one’s car battery, and earning compensation from the utilities company. Wagner theorised that – and consulted data from other projects - when the electric utility would like to buy power from the network, they would hold an auction between the EV owners. With defined parameters in
place, each owner would then sell energy from their battery pack while maintaining enough capacity for future transport (Wagner, 2014).
A possible problem with this new integration is that EVs could potentially increase the demand for electricity at peak hours. Seeing as the charging habits of EVs are strongly correlated to the daily energy demand patterns of the consumers (IEA, 2015). This is where other forms of energy storage could play a huge part in off-setting this supply and demand imbalance. Because for the majority of the time – about 95% - the EVs are left parked and un-used. Which would allow for them to be used as an energy buffer to the grid.
3.4 Performance indicators
To accurately assess the impact of storage technologies on the power system network, a need for a set of performance indicators is necessary. This enables cross table comparison, and ensures an accurate and fair comparison. With the connection of renewable electricity generation to the grid, follows a need to analyse several factors which may impact the grids operation (IEA, 2015). This is because with the connection of any VRE to the grid, follows a lack of kinetic inertia and the electrical high frequency characteristics of the converter, that connects the power station to the grid (Feller, 2019).
The following KPIs are inspired with the idea in mind to maintain a power system that fosters flexibility and power stability through operations. They are derived from a scaled down approach from the five main flexibility options within the grid and storage category. From these sets of flexibility options, the most common aspects that ensures stable power transmission, and is a key metric from a grid operator perspective, are: voltage variations, thermal limit of grid components, and frequency variations. Here some other very common indicators such as: efficiency and the capacity factor are included for an increased depth of analysis.
3.4.1 Voltage variations
To measure the voltage variations, a different approach to applying a formula is necessary. Energiforsk (2015) proposes that a suitable indicator would be to measure the number of times the voltage is ±5% from the nominal voltage of the grid. As an example, with a nominal voltage of 220 kV then, we would count the number of times the voltage would divert outside the range of 209, 231 . In Sweden, the voltage cannot vary more than 10% from the nominal voltage value (EIFS, 2013).
3.4.2 Frequency variations
Keeping the frequency regulated around a nominal value is very important, since certain frequencies can harm sensitive equipment (Amelin, 2017). The Swedish system should operate close to 50 Hz. Here there is an automatic control set up to keep the frequency within
the 49.9 – 50.1 range which is of operational range in Sweden. Any smaller deviations outside this range requires quick handling by either increasing generation, which would increase the frequency, or the load which would decrease the frequency. This fix is automated, and is what’s referred to as a primary control system (Amelin, 2017).
An equation of assessing the frequency can be seen below. Here ∆𝐺 is generation in MW, R is the gain i.e. added loads to the system, and ∆𝑓 is the measured frequency in Hz.
∆𝑓 =∆𝐺 𝑅 𝐻𝑧
3.4.3 Capacity factor
The capacity factor evaluates how well the installed capacity of the grid is utilized. It is a ratio of the delivered energy, to the installed capacity. The formula can be seen below.
𝐶𝐹 = 𝐸789
𝑡789 𝐶;<=>8??@7 %
Here 𝐸789 is the daily energy production (kWh), 𝑡789 is the number of hours for the simulated time-period, and 𝐶;<=>8??@7 is the installed capacity of the system (kW).
3.4.4 Efficiency
A very important metric for grid operators is to have minimized transmission losses in the grid. A way to measure this efficiently is to calculate the ratio between the lowest power value and the highest power value measured from a day’s operation. It can be measured using hourly data, where 𝑃B;<is the minimum power (kW) and 𝑃B8C is the maximum power (kW).
𝜂 =𝑃B;< 𝑃B8C
𝑘𝑊 𝑘𝑊
3.4.5 Load factor
This one is defined as the ratio between the mean power and the maximum power. In the grid, it is good to have reduced flow of load peaks, since it increases the capacity and in turn allows for an increased share of renewables being added to the grids energy mix.
If the Load Factor (LF) is low, then the system is bound to have a high power variation with many load peaks. With a high LF, the electricity of the system is more evenly utilized, which would indicate the state of a healthy grid.
𝐿𝐹 =𝑃B@8< 𝑃B8C
𝑘𝑊 𝑘𝑊
4 CURRENT STUDY
In this part the implemented model is described, along with the obtained parameters and used input data. This chapter also describes the type of performed simulation that had to be used in order to reach the aim of the thesis.
4.1 Power grid model
The model was created in MATLAB Simulink, and can be seen in Appendix B. The model represents a medium sized distribution system, connected to a solar power plant as a means to produce power to the entire system. It is built as a radial network with the generation feeding the distribution grid. The generation takes place in a voltage power grid at 260 V, along with a three phase three level Voltage Source Converter (VSC), a 5 kHz DC-DC boost converter, a 10 kvar capacitor bank that filters the harmonics produced from the VSC system, and a three phase coupling transformer. This system is connected to a utility grid at 25 kV via a transformer. The utility grid consists of two different sized feeders, representing grounded distribution lines that uses impedance values taken from real world examples, and
customized to fit the model of a Swedish power grid. The lines separate the power production point from the actual distribution part of the system. Furthermore, the distribution side, consists of a variable and one constant load, and at the far end a 120 kV equivalent transmission system. The distribution part of the model can be seen in Appendix E.
As mentioned, the model implements a grid operation technique known as the incremental conductance and integral regulator technique via the MPPT controller by means of a
Simulink® model at the boost converter. The boost converter increases the voltage from the
PVs natural voltage of 273V DC at maximum power to 500 V DC in order to extract the maximum power from the modules. This is regulated via the MPPT controller by varying the duty cycles. The job of the VSC is then to convert the 500 V DC link voltage to 260 V AC. Here there is a control system in place to try and regulate the DC link voltage variations to not deviate much from ±250 V.
The control for the energy storage system works in the following way. When there is a surplus of energy in the generation network, the EST will act as a load that consumes the margin power from the power grid. When there is not enough power in the power grid, it will instead act as a voltage source that assists the generation units (Lindstens, 2017). In theory, the EST can be connected at any bus throughout the system, but there are optimal placement
strategies that one could follow here. For the sake of simplifying, the EST is connected closer to the distribution side within the 120 kV power grid. In the figure below, the model can be seen as single-line diagram (SLD).
Figure 10: Single line diagram of the power grid model
Here the solar power plant is denoted by PV, the utility grid by UG, the harmonics filter by H, the voltage source converter by VSC, and the MPPT controller by MPPT. The number is indicative of the bus for the system where the ESS can be connected. It is also at the bus where the voltage, and frequency variations are monitored.
The power capacity of each EST was decided by comparing the generated energy with the loads consumption, and sized to cover the power shortages in the utility grid. The power production can be seen in the figure below. Here it was determined that the ESTs needed at least a power capacity of 20 kW. All other parameters used in the model can be seen in
Appendix A.
Figure 11: Supplied power to grid
4.1.1 PV Generation
The generation part of the model is entirely dependent on the production from a solar PV array. The PV array uses irradiation, and temperature data as input parameters to simulate its power production. Here it was determined to utilize a signal builder block which is connected to the PV array inputs. The signal block imitates a normal irradiance and