Customer Satisfaction in Public Transportation
A study of SJ traveler’s perception in Sweden
Veronica Korale
Jacqueline Mandari
Melissa-Ray Suh
FOA214 Bachelor Thesis in International Business Management June 5, 2015
Mälardalen University: School of Business, Society and Engineering (EST)
Tutor: Anna Larsson
ABSTRACT
Title: Customer satisfaction in Public Transportation: A case study of SJ traveler’s perception in Sweden. Date: June 5, 2015
University: Mälardalen University, School of Business, Society and Engineering Level: Bachelor’s Thesis in Business Administration
Authors: Veronica Korale Jacqueline Mandari Melissa-Ray Suh (891229) (900120) (920309) Tutor: Anna Larsson
Keywords: Customer satisfaction, service quality, public transportation, customer gap, expectation,
perception, service marketing triangle.
Research question: How does public transportation service quality impact customer satisfaction?
Purpose: The purpose of this study is to investigate if service quality has an impact on customer
satisfaction in the public transport industry. SJ AB is used as a case study to investigate the research question and the factors, which affect customer satisfaction.
Method: A qualitative approach was used to answer the research question. A semi-structured face to face
interview was conducted with one of SJ’s managers, to find out what the company thinks customer expectations are, which service recovery strategies they have in place, and how they keep their customers satisfied. Customer interviews were also conducted with the aid of a well-structured interview guide, to find out what customers’ perceptions of service quality are, what their expectations are and whether they are satisfied with the services provided by SJ AB.
Conclusion: SJ is aware of their customer expectations. So they need to find effective ways to deliver
services, which match these expectations if they want to have satisfied customers. Also, SJ needs to make sure its employees have the right tools to provide good service.
ACKNOWLEDGEMENT
We would like to thank our supervisor Anna Larsson for her support during this process. Your guidance, feedback and input made it possible for us to continuously develop this thesis. We would also like to thank all our seminar mates for all the time and effort they put into giving us constructive criticism.
Additionally, we would like to express our gratitude to the SJ manager who gave us the chance to conduct an interview with him. His willingness to provide us with all the necessary information we needed greatly improved the quality of our work.
Writing this paper would not have been possible without the data we collected from the 90 SJ customers who were gracious enough to answer our interview guide and any further questions we had. We are grateful to them for their participation in the data collection process.
Finally, we also want to thank our parents and other family members for the inspiration and support during the completion of the project.
Thank you!
Jacqueline, Melissa & Veronica Västerås, June 5, 2015
TABLE OF CONTENTS
1. INTRODUCTION ... 1 1.1 Background ... 1 1.2 Problem Description ... 3 1.3 Research Question ... 4 1.4 Purpose ... 41.5 Target Audience for the Thesis ... 4
1.6 Structure of the Thesis ... 4
2. THEORETICAL FRAMEWORK ... 5
2.1 Service Marketing Triangle ... 5
2.2 Service Quality ... 7
2.3 Service Quality Gaps ... 7
2.3.1 The provider gaps ... 8
2.3.2 Provider Gap 1 ... 8 2.3.3 Provider gap 2 ... 9 2.3.4 Provider gap 3 ... 9 2.3.5 Provider gap 4 ... 10 2.4 Customer Satisfaction ... 11 2.5 Conceptual framework ... 12 3. METHODOLOGY ... 13 3.1 Choice of method ... 13 3.2 Research Design ... 13 3.5 Data collection ... 15
3.5.1 Primary Data collection ... 15
3.5.2 Secondary Data Collection ... 17
3.6 Operationalization ... 17
3.7 Ethics ... 19
3.9 Limitations ... 20
4. SJ COMPANY ... 21
4.1 General Overview of the Swedish Rail System ... 21
4.2 Company Background ... 21
4.3 Other Responsible Actors ... 22
4.4 Competitors ... 23
5. EMPIRICAL FINDINGS ... 24
5.2 Empirical Findings from the Customer Interview Guide ... 26
5.3 Difference in Satisfaction between Males and Females ... 29
6. ANALYSIS ... 31
6.1 Customer versus management view of customer expectations. ... 31
6.2 Service Quality ... 32
6.3 Customer Satisfaction ... 34
7. SUGGESTIONS FOR FURTHER RESEARCHERS ... 37
LIST OF REFERENCES ... 38
APPENDICES ... 42
Appendix 1 ... 42
LIST OF FIGURES
Figure 1: The Service Marketing Triangle (source: Zeithaml and Bitner, 1996)……….6 Figure 2: The Service Quality Gap Model (source: Parasuraman, Zeithaml and Berry, 1985, pp.44)……10 Figure 3:Females satisfaction versus dissatisfaction with SJ services……….29 Figure 4:Males satisfaction versus dissatisfaction of SJ services………..30
LIST OF TABLES
Table 1: Operationalization of Theories used in Customer Interview Guide………..17 Table 2: Operationalization of Theories used in Management Interview………18 Table 3: Table of Findings ………27
LIST OF APPENDICES
Appendix 1: Questionnaire……….43 Appendix 2: Interview Questions………...44
1. INTRODUCTION
The first Chapter of the thesis outlines the background of the research area, along with a short introduction of the problem area. Afterwards, the research question and the purpose of the study will be stated. At the end of this section the target audience of the thesis and the structure of the thesis will be presented.
1.1 Background
On July 14, 2010, 250 passengers were trapped for 7 hours in an X2000 SJ train from Stockholm to Gothenburg. Air conditioning stopped working, water supply ran out and they even ran out of food. The temperature went up to 60 degrees and a man passed out due to heatstroke. However, this is an example of an extreme situation which does not happen very often and cannot be particularly used as a benchmark for judging day to day services provided by SJ
(www.aftonbladet.se, 2010). The interest in SJ was inspired by the authors’ experience travelling
with SJ. As a service company, SJ strives to satisfy its customers by ensuring that they meet their needs and expectations. However, as the incident above indicates, they are not always successful. Service quality affects customer satisfaction but what constitutes quality service differs from one customer to the next. The subject of customer satisfaction is broad and has been studied from different perspectives.
According to (Hoffman & Bateson, 2006), customer satisfaction is the comparison of customer expectations to perceptions regarding service encounter.Customer expectations are beliefs about service delivery that serve as standards or reference points against which performance is judged (Zeithaml et al, 2006). A lot of research has been done on the subject and since the early 1970s; it has increased significantly and the majority of the studies have focused on some variation of the expectancy-disconfirmation paradigm, Churchill and Surprenant (1982).
The disconfirmation paradigm implies that satisfaction is related to the size and direction of the disconfirmation, where disconfirmation is related to the individual’s expectations. Disconfirmation occurs when there are differences between expectations and outcomes. Although the term “disconfirmation” has a negative connotation, it is not necessarily the case here since disconfirmation can either be positive or negative. When the outcome meets the individual’s expectations, confirmation occurs. However, positive or negative disconfirmation can also occur. When the outcome exceeds a customer’s expectations, positive disconfirmation occurs. Consequently when the outcome fails to meet the individual’s expectations, negative disconfirmation takes place, Oliver (1980).
The disconfirmation paradigm is made up of four parts: expectation, performance, disconfirmation and satisfaction. Expectation reflects anticipated performance. Consumers may use different types of expectations when forming an opinion about a product’s or services
anticipated performance. According to Miller (1977), there are four types of expectations: Ideal, expected, minimum tolerated and desirable. Performance is used to determine disconfirmation depending on whether the expectations and outcome coincide or not. In the case of disconfirmation, these occur as a result of discrepancies between prior expectations and actual performance. The magnitude of the disconfirmation effect generates satisfaction and dissatisfaction. According to Oliver (1977), there is a need to measure disconfirmation separate from expectation since he maintains the construct has an independent and additive effect on satisfaction. However in the traditional paradigm it is difficult to separate disconfirmation from expectation and performance since it is defined as the difference between the two variables, Churchill and Surprenant (1982). Satisfaction is said to be the outcome of purchase and use as a result of the buyer’s comparison of the rewards and costs in relation to the anticipated consequences.
Another theory that focuses on customer satisfaction is the contrast theory. According to the contrast theory, when the performance of a product falls short of consumer expectations about it, the difference between the expectation and outcome will be exaggerated (Anderson, 1973). The theory argues that when a customer receives a product that is less valuable than expected, it will magnify the difference between the product received and the product expected (Cardozo, 1965). The theory predicts that products that perform poor than expected will be rated worse than they were and consequently products that are good will be rated even better (Oliver, 1977). The downside of this theory is that it focuses on products. This makes it hard to determine if the same patterns will be observed in the case of services.
The dissonance theory (or assimilation) suggests that when a customer expects high value products but receives low value products instead, cognitive dissonance occurs (Cardozo, 1965). According to Festinger (1962), dissonance is a psychological discomfort that will motivate a person to reduce the dissonance and achieve consonance. Not only that, but when dissonance is present, the person will try to avoid information or situations that are likely to increase it. In this case, in order to reduce the cognitive dissonance which is the result of the discrepancy between customer expectation and the service provided or the product. The criticism of this theory centers on its assumption that individuals instead of learning from past post-purchase mistakes, they are likely to repeat them (Anderson, 1973).
Generalized negativity posits that any disconfirmation of an expected result will be perceived as less pleasant or less satisfying than if the expectancy had been confirmed. Therefore, if a customer expected a certain performance from a product but another performance occurred, they will judge the product to be less pleasant than if they had no previous expectation, (Anderson, 1973). Another theory to consider when trying to predict the effect of disparities between expectation and product performance on customer satisfaction is the assimilation-contrast theory. Assimilation-contrast theory posits that satisfaction depends on the magnitude of discrepancies that exists between expected and perceived performance. In the case of assimilation, the consumer tends to adjust their perception of a product or in this particular case the service quality to be in line with prior expectations. However, this is only the case if the discrepancy is small. Contrast effect happens when there is a large discrepancy between the perception of performance and prior expectation. The consumer tends to magnify the perceived difference (Anderson, 1973). Therefore, whether assimilation or contrast effect occurs, depends on the difference between expectations and performance.
1.2 Problem Description
Public transportation via rail is quite common in Sweden. Sweden has an extensive network of railways running across the country which makes travelling by rail accessible. There are a number of train companies in Sweden such as Arriva, DSB and SJ AB.
SJ AB is the major Swedish train company running long distance traffic over almost the whole of Sweden (SJ website, sj.se). Due to limited alternative means of travel, a lot of travelers depend on SJ when travelling to different cities and towns within Sweden. At the same time, SJ has a lot of problems that do not necessarily inspire customer satisfaction. There seems to be a gap between SJ customers’ expectations of service and their perception of it, there is also a gap between service delivery and external communication to customers.
There are other stakeholders who influence how and when SJ provides their services.
Trafikverket is one of the above-mentioned stakeholders. Trafikverket is the Swedish agency responsible for rail construction and maintenance (SJ Sustainability Report, 2010). The existence of third party actors such as Trafikverket and competitors such as MTR affect how and when SJ delivers its services and consequently satisfy its customers in the process. Competitors challenge SJ to provide quality service so as not lose their customers. Trafikverket contributes to SJ delays because when they are working on the rails, trains are forced to wait until rail work is complete. An incident that took place last year around December demonstrates how Trafikverket affects SJ. An electricity accident caused an SJ train to be stuck between Stockholm Södra and Årstaberg for about 30 minutes (www.aftonbladet.se, 2014). After the issue was resolved, the passengers were transferred to another train. Although the passengers were stuck on an SJ train, SJ was not to blame for the incident since they are not in control of what happens on the tracks. An electricity accident is just one of the problems that are out of SJ’s control, extreme weather conditions especially in the winter and the maintenance of the tracks are among other reasons which interfere with SJ’s timely delivery of their services. Regardless of the fact that SJ cannot control certain elements that affect their service delivery, their customers’ dissatisfaction is still directed towards them and the main complaints center around train delays.
There are instances when SJ is directly responsible for certain incidents as was the case when an SJ train bound for Gothenburg missed a stop and as a result some of the passengers had to get off at the next stop. As a means of service recovery, SJ provided alternative means of travel and covered the costs as well. In other cases the customers either get half or their whole fare refunded. However, recently the rules for refunds have changed and priority is given to the SJ cardholders, which has caused a lot of regular SJ customers, who are not cardholders, to complain about the changes (www.aftonbladet.se, 2015).
Conclusively, the problem discussed in this thesis is how the service quality of SJ affects its customers’ satisfaction. Also, what constitutes quality service to different travellers.
1.3 Research Question
How does public transportation service quality impact customer satisfaction?
1.4 Purpose
The purpose of this study is to investigate if customer satisfaction is impacted by service quality in Swedish public transportation, using SJ as a case study to analyze the factors, which influence customer satisfaction. Both customer and management perspectives will be taken into consideration when trying to achieve the purpose of this study.
1.5 Target Audience for the Thesis
The main target of this study is SJ Company, specifically the department responsible for maintaining customer satisfaction. This thesis can also provide a starting point for future students who would wish to do further research on SJ or customer satisfaction in public transport. This study will provide an insight on what different types of customers view as important and what they require in order to be satisfied.
1.6 Structure of the Thesis
The initial section contains background information of the research area, overview of the problem area, research question, purpose, target audience and structure of the thesis. The second section presents the theoretical framework that is related to this study. The third section focuses on the chosen research method, questionnaire, ethics, validity and reliability as well as the limitations of this thesis. The fourth section presents the company being used as the case study and its competitors. The fifth section presents the findings from customer and management interview. Chapter six contains the analysis and conclusion. Suggestions for further research will be presented in the final section.
2. THEORETICAL FRAMEWORK
This chapter will give an overview of literature that is related to the research problem and the purpose. This chapter will introduce the concept of customer satisfaction and service quality.
2.1 Service Marketing Triangle
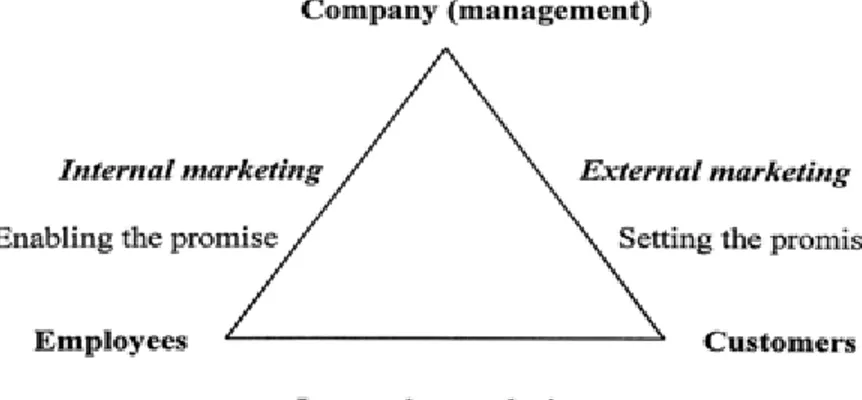
The service-marketing triangle is a useful theory for some of the difficulties of the service offer and it is useful for public transportation industry. Basically, it suggests that all three sides of the triangle as shown in Figure 2, external marketing (setting the promises), internal marketing (enabling the promises) and interactive marketing (Delivering the promises or the moment of truth) must be integrated to ensure that service quality can be achieved (Bitner, 1995). The model also highlights some characteristics in service industry such as inseparability, where the service producer and consumer are in contact at the point when the promise is delivered. It means that the process is visible to the customer who will be in a position to identify any weaknesses (Thwaites, 1999).Anyhow, according to Berry (1983), the foundation for maintaining service relationships is the fulfillment of promises made to customers (Bitner, 1995).
Setting the Promises: External Marketing
Setting the promises includes those elements that contribute to developing customer expectations of service standards (Thwaites, 1999). This part of marketing could include, for example, the traditional elements of the marketing mix (promotion, price and etc.) or aspects of the servicescape (comfortable seats). But for services, other factors also communicate the promise to customers. The service employees, the design and decor of the facility, and the service process itself also communicate and help to set customer expectations (Bitner 1992, 1993; Grove, Fisk, and Bitner 1992). On the other hand, if there is a tendency to overpromise, the relationship may be off to a weak beginning (Bitner, 1995). Therefore, companies must be really careful when they are setting the promises.
Enabling Promises: Internal Marketing
The second way of marketing takes place through the enabling of promises and it is between the organization and the employees who provide the services to customers. In order to deliver the services as promised the company or the employees must have the skills, abilities, tools and etc. To put it in other words, they must be enabled. Therefore, employees must be recruited, trained and provided with tools and appropriate internal systems, and rewarded for good service to enable the promises (Bitner, 1995).
Keeping Promises: Interactive Marketing
Keeping promises is the third promise-related activity and the most critical from the customer’s point of view (Bitner, 1995). Interactive marketing occurs when the customer interacts with the organization and the service is produced and consumed. According to Bitner (1995), keeping promises is the essence of a mutually beneficial service relationship. But to keep the promises, the other two sides of the marketing triangle-making realistic promises and enabling delivery of service promises should work correctly. However, service promises are most often kept or broken by the employees of the organization or sometimes by the technology, for example, information delivered via online computer services (Bitner, 1995).Even though promises are kept or broken, the reliability of service is experienced every time when the customer interacts with the organization. For that reason, in service organizations, all three types of marketing activities are essential for building and maintaining relationships with customers (Bitner, 1995).
2.2 Service Quality
Service quality is an attitude formed by long-term overall evaluation of a firm’s performance. According to Zeithaml and Berry (1990), service quality is an extrinsically perceived attribution based on the customers experience about the service that the customer perceived through the service encounter. Service quality assessments are formed on judgments of outcome quality, interaction quality and physical environment quality. Service quality is one of the key dimensions, which are factored into the consumer’s satisfaction judgments.
Services are produced and consumed at the same time, which makes it difficult to measure, test and as such specific uniform quality can rarely be set. As a result, it is hard to determine how consumers evaluate the service quality (Parasuraman et al, 1985). On the other hand, the heterogeneity of services implies its delivery differs from producer to producer, consumer to consumer and day to day (Parasuraman et al, 1985). That is also because the consistency of personnel behavior is hard to ensure since what the consumer receives may differ from what the firm intended to deliver, Boom and Bitner (as cited in Parasuraman et al, 1985).
There are inherent difficulties in implementing and evaluating what constitutes service quality. For one, quality perceptions often depend on a repeated comparison of the customer’s expectation about a particular service. Therefore, if a service repeatedly fails to live up to the customer’s expectations it will be perceived as poor service. Secondly, in services, customers evaluate the service process as well as the final outcome (Hoffman & Bateson, 2006). In the case of train travel, that will be whether the train departs on a timely manner, how smooth the journey was, how pleasant the encounter with the train conductor was and if they arrived to their final destination on time.
2.3 Service Quality Gaps
The gaps model of service quality is a useful framework to understand service quality in an organization. The main service quality gap is the customer gap. The customer gap can be defined as the difference between customer expectations and perceptions of service (Zeithaml et al, 2006). Customer expectations can be considered as standards, which customers place on the service experience, based on what they think should happen (Zeithaml et al, 2006). Customer perceptions on the other hand can be thought of as the customer’s valuation of the actual service experience (Zeithaml et al 2006). In order to deliver quality services, a company must have a clear understanding of customer expectations. Customer expectations of services play a crucial role in their evaluation of the service quality. Customer expectations are affected by a variety of
factors such as price, previous experience with the company, the company’s reputation and what the company has promised (Bergman 2010). It is important for companies to understand these factors, which affect customer expectations, since it could be difficult for a company to give quality service if it does not know what customers expect. The gap model provides four gaps, which have to be closed in order for the customer gap to be closed. These four gaps are collectively called the provider gap.
2.3.1 The provider gaps
There are four provider gaps all together. The first provider gap is the gap between customer perception and management’s perception of service. Gap two is the gap between customer- driven service designs and standards, and management perceptions of customer expectation. The third gap is the gap between customer-driven designs and standards and service delivery. Finally, the fourth gap is the gap between service delivery and external communications to customers. (Zeithhaml et al, 2006). Out of these four gaps, this thesis is further going to explain gap 1 and 4 only since the researchers feel that these gaps are the most relevant to the thesis.
2.3.2 Provider Gap 1
Provider gap 1 can be defined as the discrepancy between customers’ expectations of service and management’s perception of customer expectations (Shih Chang & Hung 2013). A lot of companies fail to satisfy their customers because management lacks knowledge of what their customers are looking for or expect. Some managers also fail to have direct interactions with customers. Not having any interaction with customers could cause managers to miss out on vital information about what their customers expect, since customers are more likely to express themselves to employees they come in contact with (Zeithaml et al, 2006). Managers who are in charge of taking important decisions within companies may take wrong decisions and allocate resources incorrectly when they do not understand customer expectations. Taking wrong decisions may lead to customers perceiving the service quality as poor. The gap between customer expectations and managers perception of customer expectations can occur for a variety of reasons. Such reasons include: inadequate marketing research, insufficient relationship focus, lack of adequate upward communication and inadequate service recovery (Zeithaml et al, 2006).
Inadequate marketing research orientation
At times companies fail to conduct market research, which could provide vital information about their customers, as well as their customers needs and expectations. Research approaches such as surveys, interviews, and complaint systems can be adopted in order to stay close to the customer and know whatthey expect from the service. At times, companies conduct market research, which unfortunately focuses on other dimensions and excludes service quality (Zeithaml et al, 2006).
Lack of upward communication
Frontline employees encounter customers all day long and as a result know a lot about what customers expect. It is therefore important for management to be in contact with frontline employees so that they can understand customer expectations better through the information which frontline employees gather from their interactions with the customers (Zeithhaml et al, 2006).
Insufficient relationship focus
Relationship marketing is all about firms retaining customers and building a good relationship with them over time. Firms that do not actively practice relationship-marketing strategies are more likely to have a larger provider gap 1 because they do not know their customers well. Some firms place a larger emphasis on attracting new customers instead of retaining the customers they already have and building a relationship with them. As a result, they may fail to understand their customers changing needs and expectations. (Zeithhaml et al, 2006).
Lack of service recovery
Failure is at times inevitable. It is therefore important for firms to understand the importance of having service recovery strategies, which can be used, when they fail. Companies need to know why people complain, their expectations when they complain as well as how to develop adequate service recovery strategies to deal with service failures. Service recovery strategies could include service guarantees and compensations to the customer. (Zeithhaml et al, 2006).
2.3.3 Provider gap 2
Knowing what customers expect gives firms an edge, but it is not sufficient. Firms also need to have accurate service quality designs and performance standards, which reflect the knowledge they have about customers’ expectations. A lot of companies have difficulty translating customer expectations into service quality designs, which are easy for employees to understand and practice. As a result, provider gap 2 (the gap between management's understanding of customer expectations and the development of customer driven standards) occurs. Customer driven standards are service quality standards which are based on customer expectations and requirements rather than in company goals such productivity. Provider gap 2 could occur for various reasons. Such reasons include: poor service design, absence of customer driven standards and inappropriate physical evidence and landscape such as tangibles, which meet customer expectations. (Zeithhaml, Bitner & Grembler 2006).
2.3.4 Provider gap 3
Provider gap 3 exists when customer driven service standards do not match the service performance of company employees. It is not always certain that employees have the ability to
follow the standards set by the company even when guidelines exist. Service companies must therefore back standards with the right employees, and employee performance must also be measured and compensated. Customer expectations are not met when the service delivery does not meet the set service standards. There are a number of barriers to closing gap 3. One of such barriers is the deficiency, which exists in human resources such as employees who do not understand their roles, poor employee recruitment as well as employees who are not empowered to render services in the best way possible. Furthermore, it may be difficult to close gap 3 if the company has customers who do not know their role in the service delivery process, or if the customers negatively impact the quality of service received by other customers. Also, gap 3 may persist if the delivery of services through intermediaries, franchisees or agents is not properly managed to make sure that they maintain the customer-driven standards, which have been set by the company. (Zeithaml, Bitner & Grembler 2006).
2.3.5 Provider gap 4
Provider gap 4 occurs when the services delivered by a company do not match external communications (Zeithhaml et al 2006). Customer expectations of service quality are usually raised when companies make promises in commercials, media advertising and through their sales force. The discrepancy between actual and promised service could occur as a result of overpromising in advertisements, differences in procedures in various outlets just to name a few. Gap 4 is narrowed when service delivery and external communications are properly coordinated.
2.4 Customer Satisfaction
Nowadays customer focus and satisfaction is a driving force for many companies and organizations. Many organizations see customer satisfaction as a key differentiator and it has therefore increasingly become a key element of business strategy. In addition to that companies and organizations have understood that it is far less costly to keep existing customers than to attract new customers. For that reason, this term has been frequently used in marketing.
According to Oliver (2010) “satisfaction is the consumer’s fulfillment response. It is a judgment that a product/service feature, or the product or service itself, provided (or is providing) a pleasurable level of consumption-related fulfillment, including levels of under-or over fulfillment”. Wilson (2012) defined customer satisfaction as the customer’s evaluation of a product or service in terms of whether that product or service has met the customer’s needs and expectations. According to him there are factors that influence customer satisfaction such as product/service quality, perceptions of equity or fairness, price, personal factors (consumer’s mood or emotional state), and other consumers and so on. Oliver and Swan (1989) expanded the definition and mentioned that customer satisfaction is an affective term and they identify five different types of satisfaction, which are pleasure, relief, novelty and surprise.
According to Wilson (2012), other consumers can also influence the customer satisfaction. Martin and Pranter (1989) also mentioned that incountless service environments, customers potentially influence the satisfaction or the dissatisfaction of other customers. In addition to that pleasurable encounters with fellow customers add positively to the service experience and seem to enhance perceptions of service quality as well. For instance, unruly behavior or overcrowding would have a negative effect, whereas a number of good-humored spectators would have a beneficial effect by creating a positive atmosphere. Basically it means that the spectator’s role takes on added significance where a large number of people are required to share facilities (Martin and Pranter, 1989). Although this approach underscores some of the earlier points illustrated by the services marketing triangle as well. For example, the levels of customer satisfaction may be influenced by the activities of the employee/staff that represent the human component and/or by the physical aspects. A kind word or a pleasant smile from the staff makes the service experience more enjoyable whereas rowdy behavior is likely to have the opposite effect. Bitner (1990) mentioned that if the service is affective it has a direct and immediate effect on the customer satisfaction. Therefore it is important to encourage the staff to deliver the right service to the right people in reasonable time and showing good manners.
Customer satisfaction has also become a major contributor for enhancing a service company such as long-term profitability, customer loyalty and customer retention. Many researchers also argue that customer satisfaction has a big impact on customer intentions to repurchase (Cronin, Brady and Hult, 2000). Furthermore, satisfied customers spread positive word of mouth and it helps to attract new customers and create long-term business profit. According to (Manani et al, 2013), measuring customer satisfaction provides an indication on how an organization is performing or providing products or services. Therefore, customer satisfaction will be the measure of success to all the organizations including the public sectors as well.
2.5 Conceptual framework
Service marketing triangle
The service-marketing triangle comprises of three elements: external marketing, internal marketing and interactive marketing. External marketing is all about setting the service promises, which form customer expectations of the service standards and quality. Internal marketing on the under hand takes place when employees are enabled to provide the services promised. Finally, the company must keep the promises thought interactive marketing.
This theory is relevant to answering the research question because it explains how a company can affect their customers’ expectations of the service quality through the promises they make and how the promises are kept. Customers’ perceptions of the service quality in turn influence their satisfaction with the service quality provided by the company.
Service quality gaps
The service quality gaps is a framework which helps understand the main factors which affect service quality within organizations. The framework is built on the customer gap which the difference between customer expectations and their perceptions of the service. The customer gap is made up of four provider gaps. Provider gap 1 is the difference between customer perception of service and management’s perception of service. Provider gap 2 on the other hand is the discrepancy between management’s understanding of customer expectations are and the creation of customer driven standards. Provider gap 3 occurs when customer driven standards do not match the service performance of company employees. Lastly, provider gap 4 arises when there is a discrepancy between the services provided the company and their external communications. This theory was chosen because management and customer perspectives were used in this thesis, and the gaps are necessary in order to make it possible to compare if there are any discrepancies between customers and management’s view of service quality. The theory was also chosen because it gives an explanation of factors, which could have an effect on satisfaction. Such factors include servicescape, management’s knowledge of customer expectations and service recovery, just to name a few.
Customer satisfaction
Many companies use customer satisfaction as a key element of their business strategy since satisfied customers are more likely to become loyal and enable the company to make higher profits. This theory was chosen because it provides an explanation of various factors such as price, service quality, perceptions of fairness, personal factors, which could have an effect on customers’ levels of satisfaction.
3. METHODOLOGY
This Chapter presents the research approach used in this study. First of all the research design is described and then the data collection methods and data analysis methods will be presented. At the end of this methodology chapter, the reliability and validity issues will be discussed to follow the quality standard of the research.
3.1 Choice of method
A case study can be defined as “a situation is real life that can be looked at or studied to learn about something” (Merriam- Webster dictionary). A case study approach was used for this research. SJ AB was used as a case study to study the concept of customer satisfaction within the public transportation industry. SJ AB was also used to investigate which factors have the most effect on customer satisfaction and why. This case study was used to investigate the area of interest by gathering both primary and secondary data. The data used in this research is qualitative, but it also has some quantitative attributes from the customer interview guide, which was used to conduct the customer interviews.
A deductive was of reasoning was used for this thesis. A deductive approach goes from the specific to the general and is usually called the top-down method. With deductive reasoning theories are first of presented, then a research question or hypothesis is developed, and data is collected to discuss and analysis the research question. Finally, conclusions are drawn which may or may not support the research question. (Deduction and induction 2006). The concept of customer expectation was studied in this thesis based on already existing theories. Then we came up with a research question, and then collected data, which we used to investigate our research question. Finally, conclusions were drawn based on the findings.
3.2 Research Design
The main area of this research is focused on customer satisfaction. The goal of the thesis is to research on if SJ AB provides quality services, which lead to their customers satisfied. This thesis also seeks to investigate if SJ AB’s management perspective of customer satisfaction is in alignment with their customers. A qualitative research approach which has some quantitative attributes was chosen to answer the research question, since this approach gives us the possibility to obtain rich data, as well as discover underlying patterns which could give a better understanding as to which factors affect customer satisfaction through taking the customers experiences with the services provided by SJ into account.
Both primary and secondary data are used throughout this thesis. Primary data was collected from SJ customers in the form of a semi-structured interview, and an interview was conducted with one of SJ’s store managers. The semi-structured interview customer interview guide was designed based on the theoretical framework and conducted with the aid of a structured interview guide (see appendix 1) which contained basic questions about age, gender, frequency of travel,
perceptions and expectations of service quality. The answers provided by respondents on these questions formed a basis for further questions. Depending on what the answers were, further questions were asked to know why customers responded the way they did. The follow up questions were not predetermined and they were not given to the respondents in advance. Therefore the interviewee had freedom when it came to answering the questions. The interviews were generally kept between five to ten minutes long since we anticipated that most customers probably had trains to catch or would not like to be disturbed for an extended period of time. Secondary data was obtained from newspaper articles, scientific articles from Google scholar as well as relevant literature.
There are two types of research designs, namely, exploratory and conclusive research. The purpose of a study determines if the research design is exploratory or conclusive. Exploratory research is conducted to provide researchers with insights when they recognize a need for marketing research, but are not sure which direction the research should focus on (Parasuraman , Grewal & Krishnan 2004). On the other hand, conclusive research is conducted when researchers have insights about a particular topic and wish to conduct marketing research to verify these insights (Parasuraman , Grewal & Krishnan 2004). A conclusive research design was chosen for this thesis because our purpose is to gather information which can help us verify preexisting knowledge of the effect which service quality has on customer satisfaction.
3.3 Sample Selection
The basic idea of sampling is selecting some units for example people, organizations from a population of interest so that by studying the sample researcher can draw conclusion about the entire population (Socialresearchmethod, 2015). There are two main types of sampling techniques; probability sampling and non probability sampling (ibid). Probability sampling is most commonly associated with survey-based research where a researcher needs to make conclusion from the sample about a population to answer the research question or to meet research objectives (Saunders & Thornhill, 2003). Non-probability sampling provides a range of alternative techniques based on researcher subjective judgment (ibid). It is a type of sampling where it is not known which of the units will be picked to be sampled (BusinessDictionary, 2015).
According to that non- probability sampling is more relevant to this study. And also researchers used the convenience sampling method for this research. Convenience sampling involves select sample members who volunteering and can provide required information and who are more available to participate in the study (BusinessDictionary, 2015). Convenience sampling enable the researcher to complete a large number of interviews cost effectively and quickly (ibid).
3.4 Respondents
For this research, target respondents were people between the age of 18 and 65 who travel from Stockholm to Västerås and Stockholm to Göteborg. The main criteria for choosing respondents was that they had to have had experience of travelling with SJ trains. At the very least the participants had to have travelled with SJ trains more than once so they would be able to compare their experiences. Also, they needed to be people with travel between Stockholm to Västerås and Stockholm to Göteborg.
The choice of respondents was made through convenience, which means we contacted customers who were available. The interview guide and follow up semi structured interviews were conducted in front of SJ’s office in town, and a few were conducted on the train between Stockholm to Västerås. We were always close by to the respondents in case they had questions, and also because we had follow up questions for the respondents. Getting customers to answer the questions was not as easy as we had anticipated and there was greater resistance from women. This resulted in more men than women taking part in the study. 90 respondents answered the questions.
3.5 Data collection
There are two major approaches to gathering information about a situation, person, problem or phenomenon. It is primary data and secondary data and for this thesis researchers used both primary and secondary data.
3.5.1 Primary Data collection
Interview with SJ Manager
As part of the data collection process, a semi structured face-to-face interview was conducted with an SJ manager at SJ’s offices in Stockholm. The manager in question was chosen based on his lengthy experience working with SJ. Management perspective was meant to enable us to better understand how SJ handles customer satisfaction. Not only that, the researchers also conducted the semi structured interview because it would be helpful to know what SJ’s management views on customer satisfaction are, if they think they have satisfied customers, what kind of market research they conduct, the different actors who affect the service quality and also which recovery strategies they have in place in case the service fails. Such information was especially useful when it came to comparing the differences that exist between customers and management’s perspectives of what warrants customer satisfaction. A semi-structured interview is a qualitative method of acquiring relevant data. Semi structured interviews generally have a flexible structure which allows for new ideas and questions to be brought up during the interview based on the responses provided by the interviewee.
Customers’ Interview
Questionnaires and interviews are popular and common strategies in business research that is usually associated with the deductive approach. This kind of strategies allows the collection of large amount of data from a sizeable population in a highly economical way (Saunders & Thornhill, 2003). Therefore, researchers collected primary data by using a well structured
interview guide to conduct a qualitative structured interview to obtain in depth information on the different factors expected by the SJ customers to meet their level of satisfaction. An interview guide was used instead of a traditional questionnaire because the researchers wanted to be able to ask the respondents further questions based on what their answers were to the questions on the interview guide. The questions on the interview guide were in English. The questions in the interview guide are divided into two parts. The first part consisted of general information about the respondent like age, gender and travel pattern. The second and most important part of the interview guide consisted of questions related to customer satisfaction and service quality. The chosen questions could be linked to the five SERVQUAL service dimensions.
SERVQUAL is an instrument used to measure customer’s perception of service quality. There are five dimensions which make up SERVQUAL and they are a precise representation of the core criteria that customer’s use when evaluating service quality (Zeithaml et al, 1990). These five dimensions are: tangibles (Physical facilities, equipment, and appearance of personnel), reliability (ability to perform the promised service dependably and accurately), responsiveness (willingness to help customer and provide prompt service), assurance (knowledge and courtesy of employees and their ability to inspire trust and confidence), and empathy (caring, individualized attention the firm provide its customer) (Zeithaml et al, 1990). The main concern of customers regardless of the type of service is reliability and the facet that matters least is tangibles, although the relevance of tangibles as a cue when determining service quality may be higher (Zeithaml et al, 1990). This was relevant since SJ is a service company. For example reliability of service (punctuality), treatment by employees (how customers are treated by the staff and whether employees take appropriate actions), simplicity of information and design (scale relating to updates on delays and cleanliness), (Friman and Gärling, 2001). On the second part of this study we used the Likert scale, a rating scale that is commonly used in survey research. In the research questionnaire we opted to use 4 steps ranging from strongly disagree, disagree, agree to strongly agree. It is also possible to use five or seven steps, however the option was discounted because it is likely to take too much time for the respondent to go through that many alternatives but most importantly, the questions were meant to be a starting point for further questions. Therefore, the second part of the interview guide consisted of six questions and they had the option to strongly disagree, disagree, agree or strongly agree with the statements. They were also supposed to rate whether they were overall satisfied with services provided by SJ or not.
The questions 2.1 and 2.2 consist of open-ended questions and the respondents were asked to give their view on how the service could be improved and also what other expectations or suggestions they had for how SJ could increase their satisfaction.
3.5.2 Secondary Data Collection
In addition to collecting primary data through the customer interview guide and management interview, a secondary data collection method was also employed to gather relevant information, which could aid in adding to the validity of this thesis. The secondary data used in this thesis was collected from a variety of sources such as scientific articles from Google scholar, Mälardalen’s university database (DIVA), relevant literature, such as books related to the topic of the thesis, Newspaper articles as well as internal (SJ websites) and external (sources out of the SJ website) internet sources. We tried to base the theoretical framework chapter on scientific articles and books only since we believe that these sources have high credibility.
3.6 Operationalization
The questions developed (see appendix 1 and 2) for the customer interview and management interview were derived from the theoretical framework and the tables below shows the connection between the questions and the theories.
The first graph is showing the connection between the service marketing triangle, SERVQUAL theory and customer satisfaction with the interview questions in the customer interview guide.
Interview Question Service Marketing Triangle SERVQUAL Customer Satisfaction
1 The train is always on time
2 The train goes often enough
3 The prices are reasonable
4 The train is always clean
5 The staff is always helpful
6 I get updates on delays
7 Do you think the service provided by the SJ company meet your overall expectation?
8 Do you have any suggestions of how SJ
could increase customer satisfaction?
Table 1: Operationalization of Theories used in Customer Interview Guide
The following graph is showing the connection between the theories, service marketing triangle and service quality gaps with each interview question.
Interview Questions Service Marketing Triangle
Service Quality Gaps
1 What do you think your customer’s expectations are?
2 Do you have difficulties meeting them?
3 How often do you measure customer satisfaction? If so, how do you measure it?
4 How much have you improved based on the
feedback you receive?
5 What do you do to maintain current customers?
6 Do your employees get customer service training?
7 What type of training do they undergo?
8 How much authority do the employees have when it comes to solving customer complaints?
9 How often is management updated regarding
customer complains?
10 How do you decide on ticket prices? And would you say the prices are reasonable?
11 Which areas are in need of improvement?
12 Do you think if SJ had competition from a company as resourceful and well known, you would be more active in meeting or perhaps even surpassing customer satisfaction?
13 Would you say SJ is prone to situations like the 2007 incident or was that an isolated incident?
14 What are your recovery strategies in case of such
events?
3.7 Ethics
In order to put the participants at ease and increase the chances of them answering the questionnaires in an honest manner, the interview guides were anonymous and did not ask participants for any personal information such as contact information, address or names. Furthermore, as advised by Parasuraman in his book (Parasuraman, Grewal & Krishnan 2004), all participants were debriefed. Debriefing was done by informing participants that they were going to anonymously answer a series of questions which aimed at investigating their expectations of the service quality provided, their perception of the service quality and how satisfied or dissatisfied they were with the services provided by SJ AB. It was also explained to them that the survey was being done in order to investigate if the services provided by public transportation companies such as SJ have any influence on customer satisfaction. The participants were also informed that their responses would only be used for this research and would not shared with any third parties. Finally, the participants were made aware of the fact that we do not work with SJ AB, since it was thought that such knowledge would put them at ease and increase the likelihood of them answering all the questions truthfully. In addition,we were respectful and did not force any respondents to answer the questions if they did not wish to participate.
3.8 Reliability and Validity
A research method can be considered reliable if it has repeatability, that is, it provides the same results when the research is repeated with a similar methodology (Golafshani 2003). Based on this, this thesis can be considered reliable because the questions asked in the customer interview guide should provide the same answers if the research is repeated. Furthermore, to ensure reliability, only scientific articles and books were used in the theoretical framework and analysis since they are more likely to provide relevant information, which is reliable.
The validity of a study determines if the research method measures the factors it was intended to measure, and if the measurements are accurate (Golafshani 2003). The questions posed in the customer interview guide were formulated in a way, which addressed all factors, which this thesis aimed to investigate.
3.9 Limitations
Although this research was carefully conducted, we do realize that it has a number of limitations. The first limitation of this thesis is that the results may be difficult to generalize to all public transport railway companies since only SJ AB was looked at. Using a larger sample of companies and more respondents could provide results, which would be easier to generalize across the railway transport industry.
Another limitation of this study is that the survey was conducted only in the Stockholm-Västerås and Stockholm-Gothenburg line. This could affect the overall validity of this study since there is a possibility that service quality may vary from region to region.
Furthermore, the fact that the customer interview guides were presented to the respondents in person may create a social desirability bias since people do not like to state negative feelings. Moreover, some of the answers provided by SJ AB management during the face-to-face interview may have been formulated in a way, which makes the company look good.
Lastly, there may have been a language problem since the customer interview guide was in English, and the interviews were also conducted in English. Some respondents had difficulties understanding some of the questions. In such cases, we tried to explain the questions in Swedish.
4. SJ COMPANY
4.1 General Overview of the Swedish Rail System
Sweden has an extensive rail network with modern fast trains, which makes public transportation via railway possible throughout the whole of Sweden, and has the 21st longest railways in
world (Sweden.org.za), expanding over about 13,000km. Rail travel in Sweden began around 1860-1864 when the first two rails were built. There are rail links all over Sweden today. Sweden also has rail links to nearby countries such as Poland, Finland, Germany, Norway and Denmark. The main operator of rail transport in Sweden is SJ AB, which is a state, owned operator which traffics over long distances. There are also a variety of local rail transport operators such as the Stockholm Metro, which operates in the capital city of Stockholm. The Stockholm Metro started operating in 1950 and has about 100 stations today (Sweden.org.za). The Swedish Transport Association controls the rail traffic in Sweden. Sweden does have state owned rail operators such as SJ AB, as well as private owned operators such as Arlanda Express, Arriva, Veolia and DSB, to name a few (Sweden.org.za). The railway transport operator that this thesis will focus on as a case study is SJ AB. A brief company background will follow, as well as a section on the various actors who are involved in providing SJ travel services, and a description of the competition SJ faces.
4.2 Company Background
SJ is a Swedish railway transport company, which was founded in 1856 and was originally owned by the Swedish government. The SJ Company was in charge of the Swedish railways and opened a branch in Stockholm center in 1871, after they grew and went ahead to introduce restaurant carriages on the Uppsala route. By 1988, control of the Swedish rail tracks was given to the Swedish rail administration and SJ. The company became engaged in environmental work in the same year and went ahead to create an environmental policy, which was approved. As a result of their environmental commitment, SJ was awarded an environmental seal in 1996 by the Swedish society for nature conservation. Two years later the company introduced its x2000 rapid trains after realizing the demand for travel with the company was increasing. By the year 2000 the company was divided into six different companies, and SJ AB was responsible for passenger traffic. SJ faced some serious financial problems in 2002 and only became profitable again in 2004 (SJ AB 2015). The company’s vision is to get as many passengers as possible aboard its trains (SJ annual report 2008). SJ has a number of core values, which include reliability, traffic safety, environmental responsibility, and ease of use of its services (SJ annual report 2008),
which are the foundation for how the company conducts business. SJ’s main mission is to be a profitable yet customer oriented travel enterprise (SJ annual report 2008).
4.3 Other Responsible Actors
In order for SJ to offer their customers good transportation services which they would be satisfied with, the company needs to work hand in glove with other actors whose performance could potentially improve or reduce service satisfaction. In other words, customer satisfaction relies on the collaboration of different actors. Such actors include, Banverket, which is the Swedish railway administrator responsible for the maintenance of railways, signaling systems and customers.
Since SJ is a public property, the Swedish government and Riksdag (Parliament of Sweden) controls the allocation of resources to railway infrastructure and they are the ones who make decisions regarding taxes and fees (SJ Sustainability Report,2010). Therefore, SJ’s operations are highly dependent on political decisions. Anyhow, there are other actors who are responsible for this business as well. For instance, Trafikverket(The Swedish Transport Administration) is also a government agency that is responsible for construction, operation and maintenance of public roads and railways. In other words, it is responsible for ensuring the infrastructure is accessible and trafficable. However the heart of the Swedish railway system is Banverket (The Swedish Railway Administration). Their main goal is to stimulate and enhance the efficiency of rail transport.
SJ operates rail services under contract to a number of regional transport authorities (RTAs). RTA has the right and obligation to organize and operate public transport services within their boundaries. For that reason SJ holds regular discussions with them to coordinate timetables and train services to meet passenger demand (SJ Sustainability Report, 2010).
4.4 Competitors
There are a variety of train companies to choose from in Sweden, regardless if one is travelling over a long or short distance. SJ is, however, the main train company that provides passengers with both long and short distance rail traffic across the whole of Sweden (SJ AB 2015). SJ being the main train company in Sweden faces competition from a variety of Swedish and international train operators. Such competitors include Arriva, Veolia transport and DSB, to name a few. Arriva is a train and bus operator that is listed in the United Kingdom but has its main base in Denmark. The company’s operations are focused in Scandinavia. In Sweden, Arriva operates pågatåget and kinnekullebanan.Arriva founded pågatåget around 1982. The company’s operations were limited mainly to the Skåne region when it first came into existence. In 1999, the company expanded its operations to Åstrorp, and Simrishamn in 2003. The company operates today in the whole of the Skåne region as well as the Helsinborg- Hässeholm- kristianstad line (skånetrafiken.se). The trains are mainly known for their purple color, and for being named after famous Swedish people.
Kinnekullebanan on the other hand operates mainly on the line between Håkantorp and Gårdsjö, and it also goes through Lidköping and Mariestad. Kinnekullebanan also has trains, which make a couple of departures per day to Gothenburg and Örebro (Trafikverket 2014). The railroads that the kinnekullebanan operates on are however not electrified and have only one platform. The rails are simple and not in good condition, and as a result, Trafikverket is trying to develop a better alternative to make operations smoother for the kinnekullebanan trains (Trafikverket 2014). Another competitor to SJ is Veolia Transport which is a French multinational enterprise founded in 1875. Veolia Transport offers transportation services to a number of countries around the world. The company was formerly known as Connex but has since changed its name to Transdev Sverige AB and still maintains this name till date. Transdev Sverige has about seventy years experience working with passenger traffic by bus, and about fifty years experience with rail traffic. The company is part of Linjebuss that was bought in 1998 by the French company CGEA Transport AB. The company is responsible for traffic within the Stockholm region, and also controls a number of bus lines. The company also has a number of subsidiaries such as the Snälltåget which traffics between Malmö and Stockholm, as well as the Flygbussarna Charter which offers touristic bus rides all over Sweden, just to name a few (Transdev 2015).
Recently, MTR Stockholm started a new express line from Stockholm to Gothenburg
(www.svd.se, 2015). The MTR Express started in March 2015 and they have invested 700
million kronor in the business and bought six trains to roll down to the West Coast with stops in Södertälje, Skövde and Herrljunga (Lokaltidningen Rinkeby, 2015). There will be 90 departures a week from Stockholm Central to Gothenburg when there is full in traffic (www.svd.se, 2015).
5. EMPIRICAL FINDINGS
This section of the thesis is based on the customer interview guide which was used to conduct semi structured interviews with SJ customers, as well as the semi-structured interview conducted with one of SJ’s managers. The data that was collected from these interviews will be presented in this section.
5.1 Findings from the Interview With Management
The interview with management was semi-structured in order to allow for follow up questions and a more detailed explanation of the answers provided by the interviewee. The aim of including management perspective was to find out if there existed any discrepancies between management’s perception of customer satisfaction and such factors that influence it and the perceptions held by the customers. The secondary aim of including management perspective was to learn of other actors who influence SJ’s service delivery and service quality and also the role of competitors on their efforts to meet customer expectations. According to the interviewee, customers expect trains to be on time, they expect clean trains, working Internet, food as well as comfort. The factors, which influence customer satisfaction, differ depending on the distance of the traveler’s journey. For the long distance travelers, they expect food to be available, the trains to be clean and comfortable and Internet so they will be able to work or surf online as well as information in case of delays. The short distance travelers are more interested in trains being on time, arriving to their destination on time and updates in case of delays.
Their biggest challenge when it comes to meeting customer expectations is to have trains on time and this stems from the fact that SJ is not always responsible for the delays that occur. SJ hires slots on the tracks, which are owned and managed by Trafikverket. Trafikverket is in charge of track maintenance, which leaves SJ with very little control on such matters. Trafikverket also has an extensive network of other entrepreneurs in charge of executing their tasks. This ultimately means SJ’s service delivery is dependent on other actors who are not within their immediate reach or control.
SJ does studies on their customers as a way to measure customer satisfaction. They also conduct surveys and interviews to gain an understanding of how their customers perceive their service quality. Interviews and surveys are conducted on the trains, at their lounge, outside their offices where most of their customers are seated and at their SJ stores across the country. The interviews are conducted monthly but there are also those ,which are conducted on a daily basis. These are done by clicking on a green button to signify satisfaction, red button to symbolize dissatisfaction or a yellow one for when a customer is either neutral or uncertain of how they feel about their service experience. Not much can be done from the findings of the daily survey because there are no details as to the cause of dissatisfaction or satisfaction. The purpose for such a measure is to simply find out the level of satisfaction on a given day.
Customer complaints are received either by phone or by mail and there is a special department, which deals with those complains and comes up with solutions on how to improve the services they offer. The complaints range from train delays, food quality on the train and at times they are about personnel on the train and at the SJ stores. Overall, most of the complaints are about train delays. Initially, customers believed SJ was to blame for the delays, however nowadays they are more aware of Trafikverket’s role in the delays. SJ claims they inform their customers of their position and try to be empathetic and understanding of their plight and offer them alternative routes and means of travel but this contradicts the findings of the customer interview.
As part of their loyalty program, SJ tries to maintain their customers by offering them bonuses through their SJ Prio bonus program. Customers can use their points to purchase tickets, food or experiences from SJ partner companies such as Live it.
SJ personnel receive training on how to provide their customers with the best service through an operative manager. The employees are also empowered to solve customer complaints as long as they can later on explain their motives for rendering certain services, especially if they will cost the company a lot. Without consulting top management, the frontline employees can book taxis for their customers, provide them with food if they are on a special diet and reimburse their money. According to the SJ manager, when the trains are delayed for about an hour the customer is compensated with 25% of their price ticket and 50% if it is two hours late. In case of a major delay of about 3 hours or more, like the one mentioned in the problem section, the customers are entitled to a full refund of their ticket fare.
The prices are set depending on how many places are left on the train and the demand for a particular time slot. On average, the prices tend to be cheaper depending on when you purchase your ticket. If you book your ticket three months in advance then the ticket prices will be lower compared to when you purchase your ticket the day before. However, booking a ticket in advance may not always be a realistic possibility, which begs the question, how reasonable are the tickets prices really?