Västerås, September 2014 Advisor at MDH: Konstantinos G. Kyprianidis Examiner: Mirko Senkovski School of Innovation, Design and Engineering
BACHELOR THESIS IN
AERONAUTICAL ENGINEERING
15 CREDITS, BASIC LEVEL 300
Conceptual Design of a
Supersonic Jet Engine
by
Joakim Kareliusson
Melker Nordqvist
iii
Abstract
This thesis is a response to the request for proposal issued by a joint collaboration between the AIAA Foundation and ASME/IGTI as a student competition to design a new turbofan engine intended for a conceptual supersonic business jet expected to enter service in 2025. Due to the increasing
competition in the aircraft industry and the more stringent environmental legislations the new engine is expected to provide a lower fuel burn than the current engine intended for the aircraft to increase the chances of commercial success.
The thesis has one main and one secondary objective, the main objective is to perform a preliminary design of a jet engine, complying with the specifications stated in the request for proposal. The secondary objective is to evaluate whether the knowledge gathered from the BSc program in aeronautical engineering at Mälardalen University is sufficient to perform this kind of study and to recommend courses for future students who wish to perform a similar project. Due to time
restrictions a full conceptual design has not been performed and the work has mainly been focused on the thermodynamic and aerodynamic design phases.
The thermodynamic analysis and optimization has been carried out using the Numerical Propulsion System Simulation (NPSS) code, where the cycle parameters such as fan pressure ratio (FPR), overall pressure ratio (OPR), turbine inlet temperature (TIT) and bypass ratio (BPR) have been optimized for cycle overall efficiency. With the cycle selected, and the fluid properties at the different flow stations known, the component aerodynamic design, sizing and efficiency calculations were performed using MATLAB, with equations and formulas found in the open literature together with literature
developed at Chalmers University of Technology in Gothenburg, Sweden. Furthermore a number of research papers have been used for various parts of the thesis. Several aspects of the
turbomachinery components have been evaluated to assure satisfactory performance. The result is a two spool low bypass axial flow engine of similar dimensions as the current engine but with
increased efficiencies. A weighted fuel flow comparison of the two engines at the key operating conditions shows a fuel burn improvement of 11,8% for the new engine.
The conclusions drawn by the authors on the secondary objective is that even though the knowledge might be slightly insufficient to undertake this type of task, with proper guidance and determination it’s certainly not impossible.
iv
Sammanfattning
Detta examensarbete är ett bidrag till en studenttävling skapad genom ett samarbete mellan the
AIAA Foundation och ASME/IGTI där en ny motor avsedd för en business jet med
överljudsegenskaper som förväntas tas i bruk år 2025 efterfrågas. På grund av den ökande
konkurrensen inom flygindustrin och de strängare miljökraven förväntas den nya motorn förbränna mindre bränsle än den nuvarande motorn avsedd för flygplanet och därmed öka chanserna på marknaden.
Arbetet har två syften, det första är att utföra en preliminär design av en jetmotor som uppfyller de krav som finns i specifikationen. Det andra är att utvärdera huruvida förkunskaperna från
flygingenjörsprogrammet på Mälardalens högskola är tillräckliga för att utföra den här typen av arbete och att rekommendera kurser för framtida studenter som vill utföra ett liknande projekt. På grund av tidsbegränsningar har en full preliminär design inte utförts, utan arbetet har huvudsakligen fokuserats på den termodynamiska och aerodynamiska designen.
Den termodynamiska analysen och optimeringen har utförts med hjälp av programmet the
Numerical Propulsion System Simulation (NPSS) där övergripande cykelparametrar så som fan pressure ratio (FPR), overall pressure ratio (OPR), turbine inlet temperature (TIT) och bypass ratio (BPR) har optimerats för höga verkningsgrader i motorn. Då den termodynamiska analysen och
optimeringen färdigställts och egenskaperna för gasen vid de olika stationerna i motorn var kända, beräknades komponenternas aerodynamiska design, storlekar och effektiviteter i MATLAB med hjälp av formler och ekvationer från öppen litteratur tillsammans med material som tagits fram på
Chalmers tekniska högskola i Göteborg. I övrigt har ett antal forskningsuppsatser använts till olika delar av arbetet. Flera aspekter har utvärderats för kompressorer och turbiner för att säkerställa fullgod prestanda. Resultatet är en tvåspolig låg-bypass axialmotor med liknande dimensioner som den nuvarande motorn men med ökade effektiviteter. En jämförelse av bränsleförbrukning över ett typiskt uppdrag visar en bränslebesparing på 11,8% för den nya motorn.
På arbetets andra syfte är det författarnas åsikt att även om förkunskaperna är aningen otillräckliga för den här typen av projekt, så är det med god handledning och en gedigen arbetsinsats definitivt ingen omöjlig uppgift.
v
Acknowledgements
We would like to thank Konstantinos Kyprianidis for proposing this thesis, guiding us through the process and always responding quickly to questions.
We also want to thank Mirko Senkovski for considering us when the thesis proposal came, as well as the other teachers involved with the aeronautical program.
vi
Contents
Abstract ... iii
Sammanfattning ...iv
Acknowledgements ... v
List of Figures ... viii
List of Tables ... ix
Nomenclature ... x
1 Introduction ... 12
1.1 Problem area ... 12
1.2 Aim and objectives ... 12
1.3 Work scope and limitations ... 13
1.4 Thesis outline ... 13
2 Literature review ... 14
2.1 Reducing fuel consumption ... 14
2.2 Computer aided design... 15
2.3 Cost of development ... 15
3 Methodology... 16
3.1 The preliminary engine design process ... 16
3.2 Thermodynamic analysis ... 17
3.2.1 Design point and off design performance calculations ... 17
3.2.2 Software description ... 17
3.2.3 Cycle modeling and optimization ... 17
3.3 Aerodynamic design ... 21 3.3.1 Software description ... 21 3.3.2 Turbomachinery ... 21 3.3.3 Combustion chamber ... 24 3.3.4 Internal ducts ... 25 3.3.5 Inlet ... 25 3.3.6 Nozzle ... 26 3.3.7 Mixer... 26 3.3.8 Iterations ... 27 3.4 Mechanical design ... 28 3.4.1 Software description ... 28 3.4.2 Discs ... 28
vii
3.4.3 Shafts ... 28
4 Results and discussion ... 29
4.1 Baseline engine ... 29
4.2 Cycle optimization ... 30
4.2.1 TIT and OPR optimization ... 30
4.3 Component design ... 34 4.3.1 Inlet ... 34 4.3.2 Internal ducts ... 34 4.3.3 Compressors ... 35 4.3.4 Combustion chamber ... 38 4.3.5 Turbines ... 39 4.3.6 Mixer... 42 4.3.7 Nozzle ... 43 4.3.8 Discs ... 44 4.4 Off-design ... 45 4.5 Sensitivity analysis ... 46
4.6 Comparison to baseline engine ... 47
5 Conclusions ... 48 5.1 Future work ... 48 6 References ... 49 7 Appendices ... 52 A Formulas ... 52 B NPSS outputs ... 55
C MATLAB program output files ... 58
viii
List of Figures
Figure 1: Preliminary engine design process [10] ... 16
Figure 2: Different cycle efficiencies over velocity ratio in the mixer ... 19
Figure 3: 𝜂𝑡ℎ over OPR for different types of cycles [11] ... 20
Figure 4: Velocity triangles for a typical compressor stage [19] ... 22
Figure 5: Different types of flow paths ... 23
Figure 6: Typical burner [22] ... 25
Figure 7: Theoretical thrust gain due to mixing [11] ... 26
Figure 8: Different types of disc designs [28] ... 28
Figure 9: Section view baseline engine ... 29
Figure 10: Engine layout with flow stations ... 30
Figure 11: Optimum OPR at different TIT: s. ... 31
Figure 12: Efficiencies over OPR ... 32
Figure 13: The MJ – Haran S14 section view ... 33
Figure 14: The MJ – Haran S14 section view with supersonic inlet ... 33
Figure 15: Supersonic inlet with flow stations ... 34
Figure 16: Ducts ... 35
Figure 17: Stage load over flow coefficient for the FAN and HPC ... 35
Figure 18: Fan component ... 35
Figure 19: Velocity triangles for the fan at mean blade ... 36
Figure 20: HPC component ... 37
Figure 21: Velocity triangles for the HPC at mean blade ... 38
Figure 22: Combustor component ... 38
Figure 23: Stage load over flow coefficient for the HPT and LPT ... 39
Figure 24: HPT component ... 39
Figure 25: Velocity triangles for the HPT at mean blade ... 40
Figure 26: LPT component ... 41
Figure 27: Velocity triangles for the LPT at mean blade ... 42
Figure 28: Mixer component ... 42
Figure 29: Nozzle component ... 43
Figure 30: Rate of change in area over distance and area over distance for the nozzle ... 43
Figure 31: First stage HPC disc output file from T-AXI DISC ... 44
ix
List of Tables
Table 1: Key data for the baseline engine ... 29
Table 2: Required HPT cooling flow and LPT inlet temperature ... 31
Table 3: Key parameters for design point cycle ... 32
Table 4: Inlet data ... 34
Table 5: Duct data ... 34
Table 6: Key fan data ... 36
Table 7: Fan velocity triangles data at mean blade ... 36
Table 8: Key HPC data ... 37
Table 9: HPC velocity triangles data at mean blade ... 38
Table 10: Key combustor data ... 39
Table 11: Key HPT data ... 40
Table 12: HPT velocity triangles data at mean blade ... 40
Table 13: Key LPT data... 41
Table 14: LPT velocity triangles data at mean blade ... 42
Table 15: Key mixer data ... 42
Table 16: Key Nozzle data ... 43
Table 17: Key data for HPC and HPT discs ... 44
Table 18: M 1.5 alt 51000ft ... 45
Table 19: M 0 alt 0ft ... 45
Table 20: M 0,98 alt 38500ft ... 45
Table 21: M 1,15 alt 42000ft ... 45
Table 22: Design point exchange rates for efficiencies and pressure losses ... 46
Table 23: Design point exchange rates for power off take, HPT metal temp and customer bleed ... 46
Table 24: Comparison between baseline engine and MJ - Haran S14 ... 47
x
Nomenclature
Parameter Symbol Units
Absolute Velocity 𝐶 𝑚/𝑠
Angularity Coefficient 𝐶𝜃
Aspect Ratio 𝐴𝑅
Axial Mach number 𝑀𝑎𝑥
Axial Velocity 𝐶𝑎 𝑚/𝑠
Blade Stress Level 𝐴𝑁2 𝑚2· 𝑅𝑃𝑆2
Blade Velocity 𝑈 𝑚/𝑠
Bypass Ratio 𝐵𝑃𝑅
Chord 𝑐
Convergent – Divergent 𝑐𝑜𝑛 − 𝑑𝑖
Corrected mass flow 𝑊𝑐 𝑘𝑔/𝑠
Core Efficiency 𝜂𝑐𝑜𝑟𝑒
Entry into Service 𝐸𝐼𝑆
Fan Pressure Ratio 𝐹𝑃𝑅
Flow Coefficient ф
Fuel to Air Ratio 𝐹𝐴𝑅
Gross Thrust 𝐹𝐺 𝑁
High Pressure Compressor 𝐻𝑃𝐶
High Pressure 𝐻𝑃
High Pressure Turbine 𝐻𝑃𝑇
Inlet Guide Vane 𝐼𝐺𝑉
Intercompressor Duct 𝐼𝐶𝐷
Interturbine Duct 𝐼𝑇𝐷
Isentropic Efficiency 𝜂𝑖𝑠
Loss Coefficient for Stator Blades 𝜆𝑁
Lower Heating Value 𝐿𝐻𝑉 𝑀𝐽/𝑘𝑔
xi
Low Pressure Turbine 𝐿𝑃𝑇
Mach number 𝑀
Mass flow 𝑊 𝑘𝑔/𝑠
Momentum Drag 𝐹𝐷 𝑁
Net Thrust 𝐹𝑁 𝑁
Nozzle Guide Vane 𝑁𝐺𝑉
Overall Efficiency 𝜂𝑜𝑣
Overall Pressure Ratio 𝑂𝑃𝑅
Pitch s
Polytropic Efficiency 𝜂𝑝𝑜𝑙𝑦
Pressure Loss Factor 𝑃𝐿𝐹
Pressure Recovery 𝑃𝑅
Propulsive Efficiency 𝜂𝑝𝑟𝑜𝑝
Relative Blade Mach number 𝑀𝑟𝑒𝑙
Relative Velocity 𝑉 𝑚/𝑠
Revolutions per Minutes 𝑅𝑃𝑀
Revolutions per Seconds 𝑅𝑃𝑆
Specific Fuel Consumption 𝑆𝐹𝐶
Specific Thrust 𝑆𝐹𝑁 𝑁𝑠/𝑘𝑔 Stage Load 𝜓 Static Pressure 𝑃 𝑃𝑎 Static Temperature 𝑇 𝐾 Thermal Efficiency 𝜂𝑡ℎ Thrust Coefficient 𝐶𝑉 Total Pressure 𝑃0 𝑃𝑎 Total Temperature 𝑇0 𝐾 Transfer Efficiency 𝜂𝑡𝑟𝑎𝑛
Turbine Inlet Temperature 𝑇𝐼𝑇 𝐾
12
1 Introduction
1.1 Problem area
The request for proposal is a joint AIAA Foundation and ASME/IGTI student design competition where a new turbofan engine for a conceptual supersonic business jet aircraft expected to enter service in 2025 is requested. It will be able to travel from North America to Europe and back again within one business day. It can cruise at Mach 1.15 over land without creating a sonic boom on the ground. Over water, it can cruise at Mach 1.5. Transonic cruise at Mach 0.98 should offer similar cost per distance to subsonic private jets. [1]
Today’s aircraft industry is very competitive. The commercial success of an aircraft highly depends on its ability to provide light weight, low noise, competitive fuel consumption, and in the end lower operating costs and passenger fares. A contributing factor to achieve this is the engine design. Furthermore, due to the increase of the environmental concerns over the impact of the growing civil aviation, the emission legislations set by the International Civil Aviation Organization (ICAO) are becoming more stringent. The airlines need to continuously reduce their operating costs, which combined with stringent emission legislations introduces new challenges for the aero-engine industry: new engines need to be developed for low operating costs as well as reduced environmental impact. A reduction of fuel consumption, which is directly proportional to CO2 emissions, can be achieved primarily by increasing component efficiencies, increasing OPR and TIT reducing SFN and engine size and weight. A number of novel engine concepts addressing these issues have been proposed over the years, some of which will be presented briefly in chapter two of this thesis. Implementations of such concepts however, involve a great financial risk for the
manufacturers [2]. In this thesis, a more conventional cycle is considered.
Engine development is a multidisciplinary process covering thermodynamics, aerodynamics and solid mechanics, where the requirements of one discipline may very well contradict the requirements of another, and trade-offs between performance, size, weight, and costs continuously need to be made. Engine specifications are provided in the RFP, including thrust requirements, maximum dimensions etc. A generic model of a baseline engine is also provided. The new engine is expected to have improved fuel consumption and overall performance, thus increasing the chances of commercial success for the aircraft. The new engine has been given the designation MJ – Haran S14.
1.2 Aim and objectives
There is one primary objective and one secondary objective for this thesis. The primary is to carry out a preliminary design for an engine complying with the requirements specified in the RFP. This can be broken down in the following steps:
1. Model the baseline engine and perform a thermodynamic study of the cycle performance. 2. Optimize the engine cycle for low fuel consumption, and high cycle overall efficiency. 3. Carry out preliminary sizing, efficiency calculations and aerodynamic design for the main
engine components.
13
The secondary objective is to evaluate if the knowledge acquired from the courses at the
aeronautical program at MDH is sufficient to carry out a preliminary engine design process, and to recommend courses for future students who wish to perform a similar task.
1.3 Work scope and limitations
Due to time restrictions a full preliminary design has not been carried out in more detail. The mechanical design is limited to the disc design of the HPC and HPT. No other material choices have been made and hence no overall weight estimations.
1.4 Thesis outline
Chapter 2 contains a literature review where published literature regarding the problem areas of the thesis is discussed. It provides an overview of relevant past and current research on the topic. Chapter 3 provides the methodology used to achieve the results of the thesis, it motivates why and how certain parameters are chosen. It also contains a description of the software used.
In chapter 4 the results of the simulations and choice of parameters is presented and discussed. Some comparisons to the baseline engine are also provided.
Chapter 5 concludes the thesis, looking back and evaluating the objectives. Recommendations for future work are also presented.
14
2 Literature review
A large number of research papers have been published regarding the aero engine industry over the years. In this chapter, a few of these regarding important aspects of the engine design process will be discussed.
2.1 Reducing fuel consumption
Today one major concern in the industry is producing engines with better fuel economy, partially to reduce the operating costs for the airlines leading to lower fares for paying passengers, but also to address today’s environmental concerns. A few approaches to achieve this has been proposed. A summary of some of the current research being done in the search for more fuel efficient engines is provided in [2]. The author starts by discussing the limitations of increasing OPR and TIT in order to increase thermal efficiency and reduce SFC, which has been the trend for conventional cores over the past decades. Increasing OPR further than current designs is limited by HPC delivery temperature at take-off. Increasing TIT is limited by the maximum HPT rotor temperatures at take-off and top of climb. The increase of cooling flows for this reason is also a limited strategy since this represent losses in the cycle and will eventually lead to a loss in thermal efficiency.
In [3] the authors investigate the benefits of introducing Intercooled and intercooled recuperated cores. An intercooled core can be designed for a significantly higher overall pressure ratio, with reduced cooling requirements, providing a higher thermal efficiency than could be practically achieved with a conventional core. In an intercooled recuperated core a high thermal efficiency can be achieved at a low overall pressure ratio. The use of a variable geometry auxiliary nozzle for the intercooled engine, and a variable geometry LPT for the intercooled recuperated engine is also evaluated, showing further benefits. The use of recuperation is also investigated in [4], where a recuperated engine for a UAV is compared to a conventional design. The novel engine is expected to maintain the same weight as the conventional engine and extend the mission endurance by 15%. In [5], a geared open rotor configuration engine is compared to an ultra-high bypass geared turbofan engine, with focus on minimizing fuel consumption and hence engine emissions. The open rotor concept is not a new idea, it was evaluated in the 80’s in several flight tests, but most of them never got past that phase and lately the concept has resurfaced. In an open rotor configuration the propulsive efficiency may be increased without increasing nacelle drag, and losses due to transfer efficiency are comparable to those of a turbofan. The results show that the open rotor engine is heavier but the reduced SFC and nacelle drag makes up for this and a mission fuel burn improvement of approximately 15% compared to the turbofan is presented.
In [2] the author concludes by highlighting the fact that even though research of more efficient engine concepts exists, the aero engine design industry is primarily driven by economic
considerations. Introducing these novel concepts to the market involves an economical and technological risk, and whether the potential reduction in fuel consumption outweighs these risks remains to be seen.
15
2.2 Computer aided design
Over the years, computers have become an invaluable tool for engineering purposes. In [6] the authors discuss the impact computers have had on the industry during the 1980’s. Since then the use of computers have increased exponentially and software is constantly being developed and updated. The authors of [7] discuss the development of a multidisciplinary optimization code at the time being developed at NASA Lewis research center for the design of structural components, subsonic and supersonic aircraft configuration design and airbreathing propulsion engine design. The design tool can optimize a system which can be defined in terms of fifty optimization subproblems. The system first formulates the design as a nonlinear mathematical problem, and solves the resulting problem based on data from specified input files.
In [8] another piece of software is described, meant to be used in the preliminary design phase of gas turbines. The software was created to allow for a quick preliminary design process allowing the engine suppliers the ability to evaluate numerous concepts to fulfill the market requirements. The system is built upon three major features:
i. All major engine components and their interrelations are assessed. ii. Several relevant disciplines are considered.
iii. Designing is done on several operating points and the off design characteristics are evaluated.
2.3 Cost of development
In [9] the relationship between development and cost is discussed. As mentioned earlier the industry is driven by economic consideration and the cost of achieving a performance target must be taken into consideration. The paper evaluates the tools used at Rolls Royce for the preliminary design phase of military engines and emphasizes a paradox in the preliminary design stage; there is little product knowledge but there is a powerful impact on the final design!
16
3 Methodology
3.1 The preliminary engine design process
The engine design process usually starts with an engine specification. The specification can either be a result of the requirements presented by a customer, or by the manufacturer itself to meet a market need.
The first step in the design process is the thermodynamic cycle analysis. The configuration of the engine, the cycle parameters and the performance of the components are selected and evaluated to meet the given specification.
When the major parameters are set by the thermodynamic analysis, the aerodynamic design of the turbomachinery and other components can begin. The number of stages, overall sizes, rotational speeds, efficiencies and other aerodynamic parameters can be determined.
Once the aerodynamic design is complete, the mechanical design of the components can begin, in this stage the mechanical properties such as stress and vibrations are evaluated.
17
This process needs constant feedback between the different disciplines, and changes in one may lead to changes in another. Figure 1 shows a schematic diagram representing a general design procedure. This thesis will cover the thermodynamic, aerodynamic and a small part of the mechanical design. The full specification of the engine requirements can be found in the RFP [1].
3.2 Thermodynamic analysis
3.2.1 Design point and off design performance calculations
At the design point, the thermodynamic performance of the engine is evaluated at a fixed operating condition. In the case of the MJ – Haran S14 the operating condition chosen is supersonic cruise at M 1.5 at 51000ft, where the engine is expected to spend most of its time. Changing the operating condition in the design point stage would result in a different engine with a different geometry. This conditions used as a reference point.
The next step is to run off design performance calculations. The engine geometry is now fixed and the performance of the engine at different operating conditions is evaluated. Many off design cases may be run to ensure the engine performance over the entire operating range. Both design point and off design performance calculations are highly iterative processes [11].
3.2.2 Software description
For the thermodynamic analysis of the engine, the Numerical Propulsion System Simulation (NPSS) code has been used. NPSS was developed by NASA in cooperation with U.S aerospace industries with the aim to develop a state of the art simulation tool for complex systems with an open architecture for user flexibility. The code is written in C++ and allows users to add their own unique objects and calculations. The program has a built in solver with the ability to make one parameter dependent on another, and hence varying the user input of these parameters to satisfy a certain condition specified by the user [12].
3.2.3 Cycle modeling and optimization
A replica of the baseline engine was modelled as a starting point for the cycle optimization. The cycle was then modified to achieve the required thrust levels at design point. The key cycle performance data can be seen in chapter 4. All comparisons herein are to the modified baseline engine. For the initial cycle optimization, turbomachinery efficiencies and pressure losses were assumed to be the same as for the baseline engine.
3.2.3.1 Cycle efficiency
A number of different types of efficiencies can be used to characterize the performance of an aero-engine:
Propulsive efficiency – the ratio of useful propulsive energy. This is the product of thrust and flight
velocity divided by the wasted kinetic energy of the jet.
Thermal efficiency – the increase of the kinetic energy of the gas stream divided by the energy of the
18
the two gas streams the thermal efficiency is divided into two terms, the core efficiency and the transmission efficiency.
Core efficiency – the energy available after all the power requirements of the core stream are
satisfied, which is the energy available at the core exit, divided by the energy of the fuel. This is evaluated assuming an isentropic expansion from the state at the core exit to ambient pressure.
Transfer efficiency – the quality of the energy transfer from the core stream to the bypass stream.
This is the energy available at the nozzle divided by the energy at the core exit.
Overall efficiency – the ratio of useful work done in overcoming the drag of the airplane, and the
energy of the fuel. For a turbofan engine, this is the product of the core efficiency, the transfer efficiency and the propulsive efficiency [13].
SFC – The mass flow of burnt fuel per unit of time per unit of output thrust [11]
Detailed formulas are provided in appendix A.
3.2.3.2 Selection of cycle parameters
The primary parameters for optimizing the cycle of a turbofan engine are the following: FPR, BPR, OPR and TIT. The definitions can be found in appendix A. These are limited by a number of mechanical design constraints such as creep, oxidation, casing rupture and vibrations. Herein the following secondary design parameters have been evaluated: Cooling air, pressure losses, turbomachinery efficiencies, power off-take, mixer efficiency and exhaust efficiency. It should be noted that the engine mass flow was kept constant in this study in order to maintain a constant engine diameter.
Fan pressure ratio
The fan pressure ratio was selected by letting NPSS solver vary the FPR to always achieve the required specific thrust. The required FPR to satisfy this condition is highly dependent on the
remaining parameters in the engine, and will vary as other parameters vary. For the MJ – Haran S14, the core stream FPR and the by-pass stream FPR is assumed to be the same, which in reality may be hard to achieve due to the different blade speeds at the fan tip and the fan hub.
Bypass ratio
It can be shown that for every FPR there is an optimum BPR and vice versa. At this condition the overall energy conversion is maximized giving minimum SFC, maximum specific thrust and maximum engine overall efficiency. In [14] it is shown that for a mixed flow turbofan this occurs when the velocity ratio between the two streams 𝑉𝐵𝑃
𝑉𝑐𝑜𝑟𝑒 ~0,8 . The BPR has been selected using this relationship, letting the NPSS solver vary the BPR keeping the velocity ratio fixed at any FPR and overall condition.
𝜂𝑡ℎ, 𝜂𝑡𝑟𝑎𝑛𝑠, 𝜂𝑜𝑣 and SFC over the velocity ratio are illustrated in figure 2. SFN, TIT and OPR are kept constant. It can be seen that overall efficiency is at its maximum and SFC at its minimum when the velocity ratio is approximately 0,8.
19
Turbine inlet temperature
In principle, increasing the TIT and OPR will increase thermal efficiency and hence SFC. However, due to material temperature limitations, a higher TIT will need higher cooling flows for the turbines. Cooling flows essentially represent losses in the cycle and at a certain point these losses will overcome the gain in efficiency [2]. The MJ – Haran S14 uses an uncooled LPT to keep cooling flow losses to a minimum and production costs down, thus limiting the TIT.
Overall pressure ratio
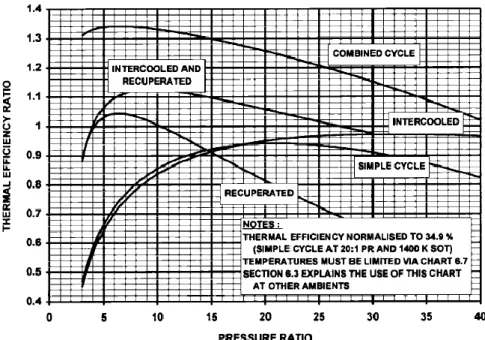
For a turbofan engine, there is an optimal OPR for a given TIT where the core and thermal efficiencies are at their maximum and hence the SFC at its minimum [15]. This was found by creating diagrams of core efficiency vs OPR, using different temperatures and constant SFN, letting the NPSS solver optimize the remaining parameters. A generic diagram showing this relationship for different types of cycles at a specific TIT can be seen in figure 3.
20
Cooling flows
The necessary cooling flows have been calculated using the method described in [16]. The required cooling flow will depend on the cooling flow efficiency, which varies depending on the technology being used. The calculations roughly correspond to a film/cross flow impingement technology. Two cooling flows have been considered for the HPT: one for the NGV and one for the rotor. An upper limit of 18% of the HPC inlet flow was decided to avoid excessive losses. The cooling flows were added as a variable to the NPSS solver to keep constant blade metal temperatures based on the blade temperatures for modern designs under all overall conditions. The flow is taken from the last stage of the HPC to assure sufficient pressure.
Power off-take
The power off-take from the HPT has been set to 100hp in accordance to the RFP [1].
21
3.3 Aerodynamic design
The aerodynamic design can commence when the flow properties are defined from the
thermodynamic analysis. In this process, the dimensions, pressure losses, efficiencies, and other aerodynamic parameters for the different components can be determined and evaluated.
3.3.1 Software description
MATLAB is a widely used numerical computing environment and programming language suitable for a range of applications. Its ability to read data from external sources, built in functions, advanced plotting functions and extensive documentation made it an appropriate choice for this project [17].
3.3.2 Turbomachinery
The initial turbomachinery sizing requires a few assumptions from the designer in order to proceed with further analysis of the component. Based on these assumptions together with the fluid properties from the thermodynamic analysis the areas, rotational speeds, blade speeds, number of stages, stage loading etc. can be determined. The initial sizing procedure can be found in [18], where guidelines for initial assumptions of the necessary parameters are also given. With the initial sizing procedure done, the parameters described in the following sections can be evaluated, and the turbomachinery properties can be modified to assure adequate performance.
3.3.2.1 Velocity triangles
In order to design the blades, the power input per stage needs to be related to velocity triangles. These give an indication of how the blades change from the hub to the tip by showing the variations in velocity.
The velocity triangles for a typical stage at the mean radius can be seen in figure 4. The fluid
approaches the rotor with an absolute velocity of 𝐶1 at an angle 𝛼1 relative to the axial direction. By combining 𝐶1 vectorially with the blade speed U, the velocity relative to the blade 𝑉1 at an angle 𝛽1 relative to the axial direction can be found. As the flow passes through the rotor, the absolute velocity of the fluid increases leaving the rotor with a velocity 𝑉2 at an angle 𝛽2. With the axial velocity 𝐶𝑎1 constant over the stage, 𝑉2 can be found and the outlet velocity triangle constructed by combining 𝑉2 and U vectorially to give 𝐶2 at the angle 𝛼2. The fluid then passes to the stator where it’s diffused to a velocity 𝐶3 at an angle 𝛼3. Generally 𝛼3 approximately equals 𝛼1 and 𝐶3
22
In this work the axial velocity has been determined assuming values of 𝑀𝑎𝑥,𝑖𝑛 and 𝑀𝑎𝑥,𝑜𝑢𝑡 based on guidelines given in [18] with a linear interpolation within the component. The velocity triangles have been calculated at the hub, mean, and tip of each blade of the turbomachinery components. With regard to radial equilibrium, the exponential blading method was used to determine the angles and the velocities at the hub and the tip. The necessary equations and formulas can be found in [19]. A number of aerodynamic properties have been evaluated to achieve an adequate turbomachinery performance including: degree of reaction, diffusion factor, De Haller number, stage loading, flow coefficient and deflection. Detailed formulas are provided in appendix A.
Degree of reaction
The degree of reaction is defined as the ratio between the static enthalpy change in the rotor and that of the whole stage. It provides a measure to the extent of which the rotor contributes to the overall pressure difference in the stage [19]. For a compressor, this should typically be in the range of 0,5 – 0,8 [20], while for a turbine 0,3 – 0,5 [11].
Diffusion factor
The air passing over an airfoil will accelerate on the convex side, leading to a drop in static pressure. On the concave side, the air will decelerate. The losses in a blade row arise primarily from growth of boundary layers on the two blade sides. At the blade trailing edge the boundary layers come
together forming a wake, causing a local drop in total pressure. Thick boundary layers, causing high losses have been found in regions where rapid velocity changes occur. The diffusion factor concept was developed by NACA based on cascade testing. For the rotor hub region and stators the losses are unaffected up to a diffusion factor of 0,6. In the rotor tip region, the losses grow rapidly at a diffusion factor above 0,4 [19].
23
De Haller number
The de Haller number is defined as the velocity ratio of the trailing edge and the leading edge of a blade or a vane. This is a simple measurement of diffusion used in preliminary design work. The De Haller number should exceed 0.72. For final calculations, the diffusion factor is preferred [19].
Stage loading
Stage loading is a measure of how much work is demanded by a turbomachinery stage and therefore the required “turning” of the flow. It is defined as the enthalpy change per unit mass flow of air divided by the blade speed squared. A lower stage loading leads to a higher efficiency, but in turn, more stages are required [11].
Flow coefficient
The flow coefficient relates primarily to component size, and if it is non-optimal to the efficiency. It is defined as the axial velocity divided by the blade speed. A typical value is 0,4 – 0,8 [20].
Deflection
The deflection is the difference between the angle of the relative velocity of the leading edge and the trailing edge. It is a direct measure of flow turning. A high deflection would imply a high rate of diffusion in a compressor or acceleration in a turbine.
3.3.2.2 Flow path
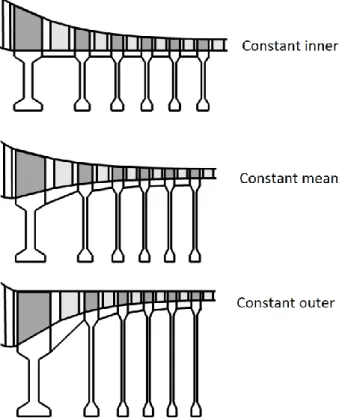
The flow paths for the turbomachinery components have been evaluated using three different design approaches: constant mean diameter, constant outer diameter and constant inner diameter. The flow path selection will influence some of the above mentioned parameters, and they all have some advantages and disadvantages [19]. In modern designs an intermediate choice of constant inner and constant outer is often made. Figure 5 shows the three designs of a compressor.
24
3.3.2.3 Turbomachinery efficiencies
In an ideal compression or expansion process the assumption is made that there is no change in entropy. In a real process however, several losses take place as the fluid flows through the
component resulting in an entropy generation. For a compressor this results in a higher temperature and enthalpy, and hence work, at a given pressure ratio compared to what would be expected from an ideal process. For a turbine, the outlet pressure will always be lower at a given power output requirement [15]. The two most common ways to account for losses in the turbomachinery components is the isentropic and polytropic efficiency.
Isentropic efficiency
The isentropic efficiency of a compressor is defined as the ratio between the change in enthalpy for an ideal process, and the change in enthalpy for the actual process. For a turbine the isentropic efficiency is defined as ratio between the change in enthalpy for the actual process, and the change in enthalpy for the ideal process [15].
Polytropic efficiency
The isentropic efficiency can be misleading when comparing compressors and turbines with different pressure ratios or at different inlet conditions. If the necessary calculations are performed for each stage of a multistage component, with the assumption that each stage operates at the same isentropic efficiency, the result would be that the efficiency of the whole component is lower than the stage efficiency. Consequently isentropic efficiency is not a suitable parameter when performing optimization studies. For such studies, the polytropic efficiency can be used. The polytropic efficiency can be defined as the isentropic efficiency at an infinitely small stage in the compression or
expansion process, such that it can be assumed constant throughout the entire process [15]. Therefore the turbomachinery polytropic efficiencies have been used in this project.
The efficiency calculations are based on outputs from both the thermodynamic analysis and the sizing procedure, and are based on the following parameters: Entry into service correction, Reynolds number index effect, size variation and normalized efficiency. These are all based on empirical data. The method used can be found in [21].
3.3.3 Combustion chamber
In order to commence the combustion chamber sizing, a few assumptions need to be made by the designer. These assumptions are based on the guidelines in [22] where the full sizing procedure can also be found. A typical burner can be seen in figure 6.
Loading
Combustor volume must be derived considering the combustor loading at a number of flight conditions. At static sea level maximum power the combustor loading should be less than
10 𝑠·𝑎𝑡𝑚𝑘𝑔1.8·𝑚3 . A critical point for the burner is the ability to relight during windmilling following an engine flameout. In order to achieve this the designer must make sure that the combustor loading at the highest required altitude and lowest flight Mach number for relight does not exceed
300 𝑘𝑔
𝑠·𝑎𝑡𝑚1.8·𝑚3 [23]. To minimize the volume of the burner, the loading should be close to 300 at windmilling conditions. A smaller burner however, leads to a higher pressure loss. The definition can be found in appendix A.
Residence time
The residence time depends on the length of the liner and the Mach number after the diffuser, and should typically exceed 3ms. Long residence times however, can result in increased NOx.
25
Pressure loss
A pressure loss occurs in the combustion chamber due to skin friction and the rise in temperature. The skin friction loss is called the cold loss and accounts for approximately 90% of the total pressure loss. The loss due to rise in temperature is called the fundamental loss and accounts for the
remaining 10% [23]. The pressure loss has been estimated using the method described in reference [22] and is dependent on the maximum area of the burner, the PLF and the inlet 𝑇0 and 𝑃0. The PLF is an assumed value and is typically in the range of 20 to 25 [23].
Efficiency
The efficiency of the burner can be found from a chemical analysis of the combustion products. Knowing the fuel to air ratio and the proportion of incompletely burnt constituents, it is possible to calculate the ratio of the actual energy released to the theoretical quantity available. Due to a number of reasons this is a very complicated approach. In practice, the combustion is complete at high-power to mid-power conditions [19] and the burner efficiency has therefore been assumed to be 0,9999.
3.3.4 Internal ducts
The ducts have been designed using cubic splines to allow for smooth surfaces between the
components trying to minimize the pressure loss. However, no pressure loss calculations have been performed, the losses are assumptions based on the guidelines given in reference [11].
3.3.5 Inlet
Due to time limitations, only a basic 2D/axisymmetric inlet using oblique shocks to diffuse the incoming air has been designed. Tabulated values of normal shock properties found in reference [24] have been used to calculate the total pressure loss and new Mach numbers after the shocks. The inlet has been designed to create an oblique shock at the inlet start, reducing the Mach number to a value close to one, after which a normal shock at the venturi reduces the value to below one. After this, the velocity is diffused in the divergent part using the continuity equation to an acceptable value before entering the fan. These calculations assume an isentropic flow. To compensate for this the total pressure loss has been multiplied by a factor of 0,997 for the subsonic region to account for pressure losses due to skin friction. The necessary formulas and equations can be found in [24]. With
26
the angles and areas known, the geometry of the inlet has been calculated using standard trigonometric relations.
3.3.6 Nozzle
A convergent – divergent nozzle lets the flow expand to ambient pressure, which for an isentropic process produces maximum thrust [11]. However, due to skin friction losses and the extra weight and length, a con - di nozzle is only a viable option if the nozzle pressure ratio is greater than about three [15] which tends to be the case for supersonic engines due to the high ram pressure ratio. The thrust loss associated with flow angularity increases sharply at great exhaust angles, therefore the angle of the divergent section should be less than 30 degrees [11].
To account for losses in the nozzle, different coefficients are used, the definitions of these may vary between different manufacturers. In this thesis the thrust coefficient, CV and the angularity
coefficient 𝐶𝜃 are used. CV is defined accordingly to [15]. This coefficient gives the actual thrust from the thrust that could be achieved by an ideal con – di nozzle by accounting for friction and flow non-uniformity. The value of CV has been assumed based on guidelines given in [11]. 𝐶𝜃 is defined as 0, 5 · (1 + cos(𝛼)), where 𝛼 is the half angle of the divergent section [25]. The area of the nozzle inlet, throat and exit is calculated in the thermodynamic analysis.
3.3.7 Mixer
The use of a mixer to combine the hot and cold stream prior to the exhaust has a few advantages compared to using two separate exhausts: a small gain in net thrust and SFC can be achieved, the optimum fan pressure ratio at a constant specific thrust is lower leading to a lower weight and cost for both the fan and the LPT, the jet noise is lower due to the velocity of the mixed stream being significantly lower than the core stream of a separate jets engine. In the decision whether to adopt a mixer these advantages need to be balanced against the disadvantages of the extra weight and cost [11]. For the thrust gain to be maximized the mixing needs to be complete (i.e. a mixer efficiency of 100%), this would require a large and heavy mixer, which in turn would require more thrust [1]. Therefore a compromise between mixer efficiency and thrust gain is necessary. Figure 7 shows the theoretical gross thrust gain by introducing a mixer assuming that: the FPR is at its optimum, the mixing efficiency is at 100% and no pressure loss is accounted for.
27
An approximate length and mixer efficiency have been estimated based on guidelines in [11]. To perform mixer calculations the designer must set the Mach number of the primary incoming stream, after which the Mach number of the second stream is varied until the static pressures of the two streams are equal in the mixer. The Mach number has been set based on guidelines given in [19]. The mixer area for the two streams is calculated in the thermodynamic analysis.
3.3.8 Iterations
The efficiencies of the components highly depend on the choices made in the aerodynamic design, once these are set, the new values need to be inputs to the thermodynamic analysis, which in turn will generate new optimum values for the key parameters, and the aerodynamic design will need to be evaluated again. As mentioned earlier constant feedback is required between the different disciplines. Iterations were performed until the residual of the turbomachinery efficiencies were less than 0,0005.
28
3.4 Mechanical design
3.4.1 Software description
The discs have been designed using T – AXI DISK V2.5, a software developed primarily for education purposes. The system can be used to design multistage compressors and turbines from a small number of physical design parameters [26]
3.4.2 Discs
To carry out the disc analysis, the designer needs the aerodynamic properties of the component, such as stage geometry, RPM and temperatures. Due to time limitation, the disc analysis has only been carried out on the HPC and the HPT where the disc stresses are the highest due to high disc speeds. The RPM of the HP shaft is often limited by disc stresses in the HPT rather than the first stage 𝑀𝑡𝑖𝑝,𝑟𝑒𝑙 for the HPC [27]. The disc designs: hyperbolic, web, continuous slope and ring can be seen in figure 8.
Target safety line
The target safety line is a safe margin until the material starts to yield, this has been kept at the default 10%.
Optimization
The optimization was carried out with the T – AXI DISK built in function, parametric disc, which optimizes the disc in order to get a design that meets the target safety line and has the lowest possible weight. Parameters such as rim width, bore width, bore radius etc. need to be set by the designer before the optimization can start.
3.4.3 Shafts
The mechanical efficiencies of the shafts are input parameters to the thermodynamic cycle analysis, in this work they are assumed to be 99,5% for both shafts [11]. No further shaft assumptions or calculations have been made.
29
4 Results and discussion
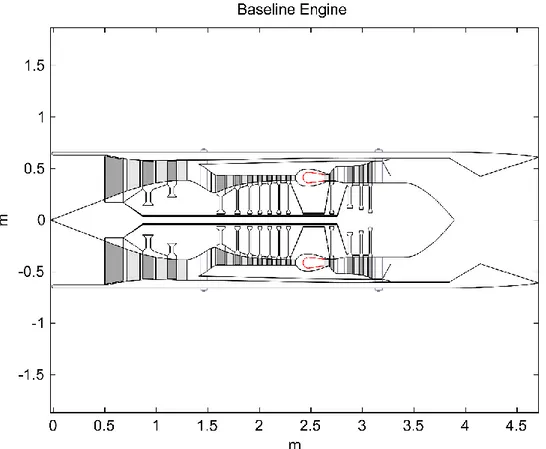
4.1 Baseline engine
The modified baseline engine performance data, which served as a starting point for the cycle optimization can be seen in table 1. A schematic 2D view of the engine can be seen in figure 9.
𝑨𝒍𝒕𝒊𝒕𝒖𝒅𝒆 15545𝑚 𝑯𝑷𝑻 𝒓𝒐𝒕𝒐𝒓 𝒄𝒐𝒐𝒍𝒊𝒏𝒈 5% 𝑴𝒂𝒄𝒉 1,5 𝑳𝑷𝑻 𝑵𝑮𝑽 𝑪𝒐𝒐𝒍𝒊𝒏𝒈 2,5% 𝑮𝒓𝒐𝒔𝒔 𝑻𝒉𝒓𝒖𝒔𝒕 82270𝑁 𝑳𝑷𝑻 𝒓𝒐𝒕𝒐𝒓 𝒄𝒐𝒐𝒍𝒊𝒏𝒈 0,5% 𝑵𝒆𝒕 𝑻𝒉𝒓𝒖𝒔𝒕 42500𝑁 𝜼𝒑𝒐𝒍𝒚,𝒇𝒂𝒏 0,8914 𝑴𝒂𝒔𝒔 𝒇𝒍𝒐𝒘 90𝑘𝑔/𝑠 𝜼𝒑𝒐𝒍𝒚,𝑯𝑷𝑪 0,9180 𝑺𝑭𝑵 472𝑁𝑠/𝑘𝑔 𝜼𝒑𝒐𝒍𝒚,𝑯𝑷𝑻 0,9136 𝑺𝑭𝑪 1,068𝑙𝑏𝑚/(ℎ𝑟 · 𝑙𝑏𝑓) 𝜼𝒑𝒐𝒍𝒚,𝑳𝑷𝑻 0,9151 𝑶𝑷𝑹 16 𝜼𝒄𝒐𝒓𝒆 0,579 𝑻𝑰𝑻 1472𝐾 𝜼𝒑𝒓𝒐𝒑 0,625 𝑩𝑷𝑹 0,3 𝜼𝒕𝒓𝒂𝒏 0,943 𝑭𝑷𝑹 3,29 𝜼𝒕𝒉 0,546 𝑯𝑷𝑻 𝑵𝑮𝑽 𝑪𝒐𝒐𝒍𝒊𝒏𝒈 6% 𝜼𝒐𝒗 0,341
Table 1: Key data for the baseline engine
30
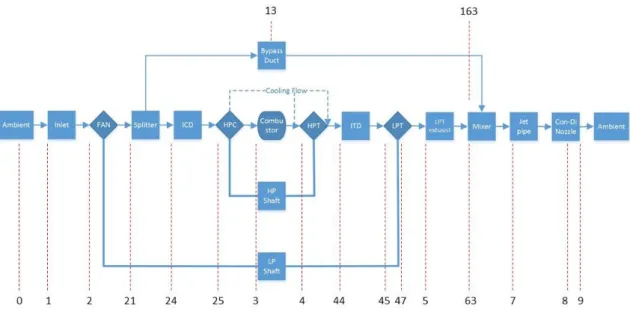
4.2 Cycle optimization
A two spool axial flow low by-pass turbofan configuration was selected for the MJ – Haran S14. The engine layout with flow stations can be seen in figure 10.
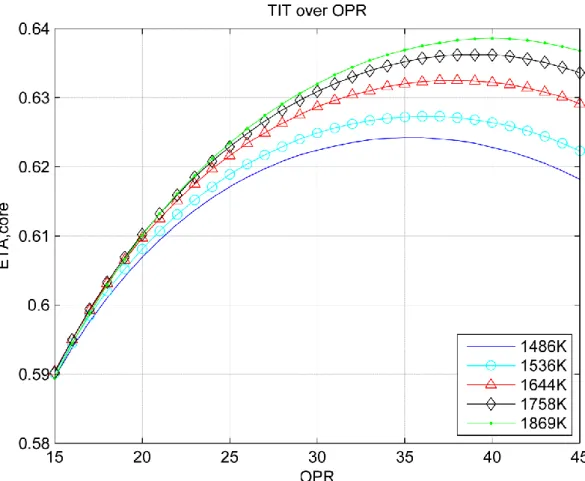
4.2.1 TIT and OPR optimization
The optimum OPR for different TIT:s can be seen in figure 11. SFN and polytropic efficiencies have been kept constant. Other parameters have been varied to keep the optimum interrelationships between the components. Figure 11 shows that increasing TIT and OPR increases the core efficiency. The design is however limited by the blade metal temperature in the turbines. At cruise condition this temperature was set to 1150K which is representative of a single crystal metal with thermal barrier coating in the HPT and Inconel 718 in the LPT. Table 2 shows the required cooling flow to keep this temperature in the HPT, and the inlet temperature of the uncooled LPT for each of the TIT:s at its optimum OPR.
31
TIT (K) Opt. OPR Required HPT cooling flow (%) LPT inlet temperature (K)
𝟏𝟒𝟖𝟔
35
9.8
1052
𝟏𝟓𝟑𝟔
37
12
1082
𝟏𝟔𝟒𝟒
38
16.2
1150
𝟏𝟕𝟓𝟖
40
20.2
1218
𝟏𝟖𝟔𝟗
41
24
1278
Table 2: Required HPT cooling flow and LPT inlet temperature
Table 2 shows that the maximum TIT in order to keep the desired LPT inlet temperature is 1644K, at this temperature the cooling flow for the HPT is also within acceptable limits. Based on this, the TIT has been set to 1644K and the OPR to 38.
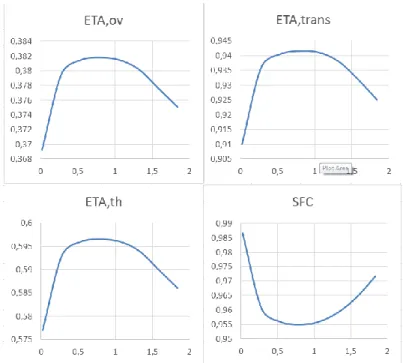
Figure 12 shows the relationship between core efficiency, thermal efficiency, overall efficiency and SFC at the chosen TIT. It can be seen that the maximum values occur at approximately the same OPR, which also corresponds to the lowest value of SFC. The propulsive and transfer efficiencies are relatively constant over this range, and are excluded in the diagram.
32
With the OPR and TIT set, the remaining parameters were found using the interrelationships
described in chapter 3. The key parameters for the engine design point cycle can be seen in table 3. A full output of the engine cycle performance data can be found in appendix B.
𝑨𝒍𝒕𝒊𝒕𝒖𝒅𝒆 15545𝑚 𝑯𝑷𝑻 𝑵𝑮𝑽 𝒄𝒐𝒐𝒍𝒊𝒏𝒈 9,7% 𝑴𝒂𝒄𝒉 1,5 𝑯𝑷𝑻 𝒓𝒐𝒕𝒐𝒓 𝒄𝒐𝒐𝒍𝒊𝒏𝒈 6,5% 𝑮𝒓𝒐𝒔𝒔 𝑻𝒉𝒓𝒖𝒔𝒕 82270𝑁 𝜼𝒑𝒐𝒍𝒚,𝒇𝒂𝒏 0,901 𝑵𝒆𝒕 𝑻𝒉𝒓𝒖𝒔𝒕 42500𝑁 𝜼𝒑𝒐𝒍𝒚,𝑯𝑷𝑪 0,941 𝑴𝒂𝒔𝒔 𝒇𝒍𝒐𝒘 90𝑘𝑔/𝑠 𝜼𝒑𝒐𝒍𝒚,𝑯𝑷𝑻 0,91 𝑺𝑭𝑵 472𝑁𝑠/𝑘𝑔 𝜼𝒑𝒐𝒍𝒚,𝑳𝑷𝑻 0,934 𝑺𝑭𝑪 0,98𝑙𝑏𝑚/(ℎ𝑟 · 𝑙𝑏𝑓) 𝜼𝒄𝒐𝒓𝒆 0,632 𝑶𝑷𝑹 38 𝜼𝒑𝒓𝒐𝒑 0,624 𝑻𝑰𝑻 1644𝐾 𝜼𝒕𝒓𝒂𝒏 0,941 𝑩𝑷𝑹 0,4 𝜼𝒕𝒉 0,595 𝑭𝑷𝑹 3,93 𝜼𝒐𝒗 0,371
Table 3: Key parameters for design point cycle
33
A schematic 2D view of the complete engine can be seen in figure 13. The engine with inlet can be seen in figure 14. Note that the discs are preliminary, the final HPC and HPT discs can be found in appendix D.
Figure 14: The MJ – Haran S14 section view with supersonic inlet Figure 13: The MJ – Haran S14 section view
34
4.3 Component design
4.3.1 Inlet
A 2D view of the inlet, with the shocks represented as dotted lines can be seen in figure 15. The inlet has a total pressure recovery of 0,983 and a total length 2,088 m. The deflection angle 𝜃 was set to 9,26° to achieve maximum pressure recovery in combination with the following normal shock at design point. The corresponding β angle is 55°. The remaining inlet data can be seen in table 4.
Station Mach number PR Area(𝒎𝟐)
𝟏 1,500 − −
𝟐 1,152 0,9897 −
𝟑 0,874 0,9966 0,992
𝟒 0,650 0,9970 1,211
Table 4: Inlet data
4.3.2 Internal ducts
The assumed pressure ratios and the lengths of the internal ducts can be seen in table 5 and a schematic view can be seen in figure 16.
Duct Bypass Intercompressor duct Interturbine duct LPT exhaust Jet pipe PR 0,97 0,98 0,98 0,985 0,99 Length 1,163𝑚 0,149𝑚 0,107𝑚 0,150 0,5
Table 5: Duct data Figure4.4 Supersonic inlet.
35
4.3.3 Compressors
In order to use an uncooled LPT, a two shaft no-booster design was chosen to maximize the work done by the HPT, thus lowering the inlet temperature to the LPT. The tip clearance has been set to 1% of the blade height. The blade spacing has been set to 20% of the upstream chord [11]. The two compressors can be seen on a Smith chart [29], based on the average stage load and flow coefficient in figure 17.
4.3.3.1 Fan
With a FPR of 3,93, a four stage fan was deemed necessary to achieve satisfactory performance. The fan flow path is a result of a linear interpolation starting from the hade angle, gradually decreasing to
Figure 16: Ducts
Figure 17: Stage load over flow coefficient for the FAN and HPC
36
Figure 19: Velocity triangles for the fan at mean blade
zero at the last stage stator outlet. The hade angle was selected to 21° in order to achieve a decent blade velocity at the first stage rotor hub exit. 𝑀𝑎𝑥,𝑖𝑛 has been set high to keep the area to a minimum.The low pressure shaft RPM was set to reach a 𝑀𝑡𝑖𝑝,𝑟𝑒𝑙 close to 1,45. The fan can be seen in figure 18.
Table 6 shows some key fan data. Figure 19 shows the fan velocity triangles at the mean blade and table 7 shows the velocity triangles data at the mean blade. A full output of stage by stage
performance can be found in appendix C. It can be seen in the appendix that the first stage hub velocity triangles are unrealistic. This is the result of a high stage loading at the hub due to a big enthalpy change and a low blade speed which indicates that the fan pressure ratio has to vary from a lower value at the hub region to a higher value at the tip.
𝑴𝒂𝒙,𝒊𝒏 0,65 𝑵𝒖𝒎𝒃𝒆𝒓 𝒐𝒇 𝒔𝒕𝒂𝒈𝒆𝒔 4 𝑴𝒂𝒙,𝒐𝒖𝒕 0,38 𝑨𝒗𝒈. 𝝍 0,82 𝑨𝑹𝒊𝒏 2,40 𝑨𝒗𝒈. ф 0,63 𝑨𝑹𝒐𝒖𝒕 2,30 𝑨𝒗𝒈. 𝑻𝒆𝒎𝒑 𝒓𝒊𝒔𝒆𝒔𝒕𝒂𝒈𝒆 42,3𝐾 𝑯𝒖𝒃/𝑻𝒊𝒑 − 𝒓𝒂𝒕𝒊𝒐𝒊𝒏 0,27 𝜼𝒑𝒐𝒍𝒚 0,901 𝑯𝒖𝒃/𝑻𝒊𝒑 − 𝒓𝒂𝒕𝒊𝒐𝒐𝒖𝒕 0,69 𝑴𝒕𝒊𝒑,𝒓𝒆𝒍,𝒊𝒏 1,43 𝑬𝑰𝑺 2025 𝑹𝑷𝑴/𝑼𝒕𝒊𝒑 7000/455,15 𝒔/𝒄 – 𝒓𝒂𝒕𝒊𝒐 1,20 𝑻𝒐𝒕𝒂𝒍 𝒍𝒆𝒏𝒈𝒕𝒉 0,9876𝑚 𝑯𝒂𝒅𝒆 𝒂𝒏𝒈𝒍𝒆𝒊𝒏 21° 𝑴𝒂𝒙 𝒅𝒊𝒂𝒎𝒆𝒕𝒆𝒓 1,2418𝑚
Table 6: Key fan data
𝑺𝒕𝒂𝒈𝒆 𝟏 𝟐 𝟑 𝟒 𝜷𝟏 53 52 56 58 𝜷𝟐 34 27 34 39 𝜶𝟏 0 12 13 22 𝜶𝟐 34 45 47 50 𝑪𝒂𝟏 222 212 197 177 𝑪𝒂𝟐 222 212 197 177 𝑼𝟏 290 321 340 351 𝑼𝟐 303 331 346 353 𝑽𝟏 365 348 356 331 𝑽𝟐 269 239 238 226 𝑪𝟏 222 217 202 190 𝑪𝟐 269 300 286 274 ф 0,77 0,66 0,58 0,50 𝝍 0,94 0,89 0,79 0,65 𝑫𝒆𝒇𝒍𝒆𝒄𝒕𝒊𝒐𝒏 18 25 22 19 𝑹𝒆𝒂𝒄𝒕𝒊𝒐𝒏 0,74 0,60 0,63 0,60 𝑫𝒊𝒇𝒇𝒖𝒔𝒊𝒐𝒏 0,34 0,46 0,47 0,47 𝒅𝒆𝑯𝒂𝒍𝒍𝒆𝒓 0,74 0,69 0,67 0,68 𝑻𝒆𝒎𝒑. 𝒓𝒊𝒔𝒆 39 45 45 39
37
4.3.3.2 HPC
A five stage constant outer diameter design was chosen for the MJ – Haran S14. This configuration allows for high hub and mean blade speeds through all stages, which reduces the stage loading. The first stage hub to tip ratio was chosen for an optimal radius of the compressor. Placing it lower would lead to higher pressure losses in the duct following the splitter due to the steep angle, placing it higher would lead to a lower RPM in order to keep 𝑀𝑡𝑖𝑝,𝑟𝑒𝑙 at reasonable values, which in turn could lead to more stages. The final radius is a compromise between these conflicting requirements. To keep the diffusion factor at the tip below 0,4, the reaction has been adjusted to reduce from 0,75 at the first stage towards 0,5 at the last stage. With a 50% reaction the blades are symmetrical 𝛼1= 𝛽2= 𝛼3, 𝛽1 = 𝛼2 giving the most efficient diffusion over the stage [19]. However, a 50% reaction was not achievable with five stages. An IGV was implemented to increase the absolute velocity of the first stage, allowing a higher rotational speed while maintaining the same 𝑀𝑡𝑖𝑝,𝑟𝑒𝑙. The HPC
component is illustrated in figure 20. Note that the discs are preliminary, the final disc design can be seen in appendix D.
Table 8 shows some key compressor data. Figure 21 shows the velocity triangles at the mean blade and table 9 shows the velocity triangles data at mean blade. A full output of stage by stage
performance for the HPC can be found in appendix C.
𝑵𝒖𝒎𝒃𝒆𝒓 𝒐𝒇 𝑺𝒕𝒂𝒈𝒆𝒔 5 𝑴𝒂𝒙,𝒊𝒏 0,52 𝑨𝒗𝒈. 𝝍 0,58 𝑴𝒂𝒙,𝒐𝒖𝒕 0,33 𝑨𝒗𝒈. ф 0,38 𝑨𝑹𝒊𝒏 1,63 𝑨𝒗𝒈. 𝑻𝒆𝒎𝒑 𝒓𝒊𝒔𝒆 89,8𝐾 𝑨𝑹𝒐𝒖𝒕 0,93 𝜼𝒑𝒐𝒍𝒚 0,941 𝑯𝒖𝒃/𝑻𝒊𝒑 − 𝒓𝒂𝒕𝒊𝒐𝒊𝒏 0,70 𝑴𝒕𝒊𝒑,𝒓𝒆𝒍,𝒊𝒏 1,34 𝑬𝑰𝑺 2025 𝑹𝑷𝑴/𝑼𝒕𝒊𝒑 13500/613,8 𝒔/𝒄 − 𝒓𝒂𝒕𝒊𝒐 1,2 𝑰𝑮𝑽 𝒂𝒏𝒈𝒍𝒆 18° 𝑻𝒐𝒕𝒂𝒍 𝒍𝒆𝒏𝒈𝒕𝒉 0,37𝑚
Table 8: Key HPC data Figure 20: HPC component
38
Figure 21: Velocity triangles for the HPC at mean blade
4.3.4 Combustion chamber
An annular combustor was chosen for the MJ – Haran S14 due to its compactness and clean aerodynamic design. The combustor has been sized to maintain a reasonable pressure loss, while allowing for relight at windmilling conditions. 𝑀𝑎𝑥 was set to allow for a residence time in excess of 3ms. A slope angle of 8° was chosen in order to increase the HPT radius, improving its stage loading. The combustor is shown in figure 22 and data for the combustor can be seen in table 10.
𝑺𝒕𝒂𝒈𝒆 𝟏 𝟐 𝟑 𝟒 𝟓 𝜷𝟏 67 67 65 67 68 𝜷𝟐 52 57 54 57 58 𝜶𝟏 18 15 26 20 24 𝜶𝟐 48 46 52 51 52 𝑪𝒂𝟏 221 225 223 216 205 𝑪𝒂𝟐 221 225 223 216 205 𝑼𝟏 523 582 592 596 597 𝑼𝟐 561 587 594 597 598 𝑽𝟏 568 568 534 560 546 𝑽𝟐 357 417 380 394 389 𝑪𝟏 233 233 247 230 225 𝑪𝟐 328 322 361 343 337 ф 0,42 0,39 0,38 0,36 0,34 𝝍 0,66 0,57 0,56 0,57 0,54 𝑫𝒆𝒇𝒍𝒆𝒄𝒕𝒊𝒐𝒏 15 9 11 11 10 𝑹𝒆𝒂𝒄𝒕𝒊𝒐𝒏 0,70 0,75 0,67 0,71 0,70 𝑫𝒊𝒇𝒇𝒖𝒔𝒊𝒐𝒏 0,47 0,36 0,42 0,42 0,41 𝒅𝒆𝑯𝒂𝒍𝒍𝒆𝒓 0,63 0,73 0,71 0,70 0,71 𝑻𝒆𝒎𝒑. 𝒓𝒊𝒔𝒆 87 92 92 92 87
Table 9: HPC velocity triangles data at mean blade
39 𝒅𝑷/𝑷𝒊𝒏 4,11 𝑴𝒂𝒙 0,04 𝑹𝒆𝒔𝒊𝒅𝒆𝒏𝒄𝒆 𝒕𝒊𝒎𝒆 4𝑚𝑠 𝑷𝑳𝑭 23 𝑳𝒐𝒂𝒅𝒊𝒏𝒈 𝒂𝒕 𝑪𝒓𝒖𝒊𝒔𝒆 1,15 𝑳𝒍𝒊𝒏𝒆𝒓/𝑫𝒍𝒊𝒏𝒆𝒓 2 𝑳𝒐𝒂𝒅𝒊𝒏𝒈 𝒂𝒕 𝑾𝒊𝒏𝒅𝒎𝒊𝒍𝒍𝒊𝒏𝒈 231 𝑳𝒄𝒄/𝑫𝒄𝒄 1,75 𝑷𝒂𝒕𝒕𝒆𝒓𝒏 𝑭𝒂𝒄𝒕𝒐𝒓 0,35 𝑽𝒄𝒄/𝑽𝒍𝒊𝒏𝒆𝒓 0,5 𝑽𝒄𝒄 0,059𝑚3 𝑬𝒇𝒇𝒊𝒄𝒊𝒆𝒏𝒄𝒚 0,999 𝑽𝒍𝒊𝒏𝒆𝒓 0,029𝑚3 𝑺𝒕𝒐𝒄𝒉𝒊𝒐𝒎𝒆𝒕𝒓𝒊𝒄 𝑻𝒆𝒎𝒑. 2300𝐾 𝑺𝒍𝒐𝒑𝒆 𝒂𝒏𝒈𝒍𝒆 8° 𝑻𝒐𝒕𝒂𝒍 𝒍𝒆𝒏𝒈𝒕𝒉 0,195𝑚
Table 10: Key combustor data
4.3.5 Turbines
A constant hub design was chosen for the turbines. This configuration allows for a higher blade speed due to the increasing blade tip radius, which reduces the stage loading. The loss coefficient 𝜆𝑁 was set to 0,05, at this value the stator blades are convergent, which allows for good performance over a variety of power conditions [19]. To avoid choking the turbines, the angle 𝛼3,𝑚𝑒𝑎𝑛 has been adjusted to satisfy the condition (𝑃01
𝑃2) < 𝑃𝑐𝑟𝑖𝑡𝑖𝑐𝑎𝑙. The highest relative Mach number occurs at the inlet hub. This value needs to be kept below 0,75 [19] to avoid high pressure losses due to shock waves. The tip clearance has been set to 1% of the blade length. The blade spacing was set to 20% of the upstream chord [11]. The two turbines can be seen on a smith chart [30], based on the average stage load and flow coefficient for the LPT, in figure 23.
4.3.5.1 HPT
A highly loaded one stage HPT was chosen to minimize the required cooling flow. The HPT inlet area is derived from 𝐴𝑁2 to maintain stress levels based on material technology for 2025. 𝑀𝑎𝑥,𝑖𝑛 was then derived from the area. To avoid high pressure losses in the upstream ducting and to assure that the
Figure 23: Stage load over flow coefficient for the HPT and LPT
40
Figure 25: Velocity triangles for the HPT at mean blade
gas accelerates at all points along the NGV, it has been kept below 0,2 [11]. The HPT is shown in figure 24. Note that the disc is preliminary, the final disc design can be seen in appendix D. Some key turbine data can be found in table 11. The velocity triangles for the mean blade can be seen in figure 25 and the corresponding data can be seen in table 12. A full output of stage by stage performance can be seen in appendix C.
𝑨𝑵𝟐 7247,5 𝑵𝒖𝒎𝒃𝒆𝒓 𝒐𝒇 𝒔𝒕𝒂𝒈𝒆𝒔 1 𝑴𝒂𝒙,𝒊𝒏 0,16 𝑺𝒕𝒂𝒈𝒆 𝑻𝒆𝒎𝒑. 𝒅𝒓𝒐𝒑 494𝐾 𝑴𝒂𝒙,𝒐𝒖𝒕 0,4 𝝍 3,10 𝑨𝑹𝒊𝒏 1,16 ф 0,41 𝑨𝑹𝒐𝒖𝒕 1,16 𝜼𝒑𝒐𝒍𝒚 0.910 𝝀𝑵 0,05 𝑴𝒉𝒖𝒃,𝒓𝒆𝒍 0,35 𝑬𝑰𝑺 2025 𝑻𝒐𝒕𝒂𝒍 𝒍𝒆𝒏𝒈𝒕𝒉 0.097𝑚
Table 11: Key HPT data
𝑆𝑡𝑎𝑔𝑒 𝟏 𝜷𝟐 52 𝜷𝟑 68 𝜶𝟐 75 𝜶𝟑 4 𝑪𝒂 259 𝑼 630 𝑽𝟐 419 𝑽𝟑 699 𝑪𝟐 994 𝑪𝟑 260 ф 0,41 𝝍 3,10 𝑫𝒆𝒇𝒍𝒆𝒄𝒕𝒊𝒐𝒏 16 𝑹𝒆𝒂𝒄𝒕𝒊𝒐𝒏 0,25 𝑴𝒉𝒖𝒃,𝒓𝒆𝒍 0,35 𝑻𝒆𝒎𝒑. 𝒅𝒓𝒐𝒑 494
41
4.3.5.2 LPT
The first stage LPT mean radius was set to correspond with the last stage HPT mean radius in order to achieve a decent stage loading and to approximately align with the fan to reduce flow
turning. 𝑀𝑎𝑥,𝑜𝑢𝑡 was set high to reduce the rotor outlet area, thus reducing 𝐴𝑁2. Since 𝐴𝑁2 will be lower on the first stage due to the smaller area, calculations are only performed on the second stage. The first stage stator was replaced with an aerodynamically loaded strut to accomplish the same function as a stator, while giving structural support to the engine. With two stages there is no exit swirl entering the LPT exhaust at design point. Some swirl will however be present at off-design conditions. The LPT is shown in figure 26.
Some key turbine data can be found in table 13. The velocity triangles at the mean blade can be seen in figure 27 and the corresponding data can be seen in table 14. A full output of stage by stage performance can be found in appendix C.
𝑴𝒂𝒙,𝒊𝒏 0,35 𝑵𝒖𝒎𝒃𝒆𝒓 𝒐𝒇 𝒔𝒕𝒂𝒈𝒆𝒔 2 𝑴𝒂𝒙,𝒐𝒖𝒕 0,5 𝑨𝒗𝒈. 𝝍 2,06 𝑨𝑹𝒊𝒏 1,84 𝑨𝒗𝒈. ф 0,81 𝑨𝑹𝒐𝒖𝒕 6,72 𝜼𝒑𝒐𝒍𝒚 0,934 𝝀𝑵 0,05 𝑴𝒉𝒖𝒃,𝒓𝒆𝒍,,𝒔𝒕𝒈𝟏 0,40 𝑬𝑰𝑺 2025 𝑴𝒉𝒖𝒃,𝒓𝒆𝒍,𝒔𝒕𝒈𝟐 0,44 𝑺𝒕𝒂𝒈𝒆 𝑻𝒆𝒎𝒑. 𝒅𝒓𝒐𝒑 99,7𝐾 𝑻𝒐𝒕𝒂𝒍 𝒍𝒆𝒏𝒈𝒕𝒉 0,089𝑚 𝑳𝒂𝒔𝒕 𝒔𝒕𝒂𝒈𝒆 𝑨𝑵𝟐 5115
Table 13: Key LPT data Figure 26: LPT component
42
Figure 27: Velocity triangles for the LPT at mean blade
4.3.6 Mixer
The engine uses a lobed annular mixer to improve thrust and SFC and to reduce noise. The mixer length was chosen to attain 𝐿/𝐷 ~1 to achieve a good percentage of the theoretical thrust gain [11]. The mixer can be seen in figure 28 and the mixer data can be seen in table 15.
𝑬𝒇𝒇𝒊𝒄𝒊𝒆𝒏𝒄𝒚 0, 7 𝑪𝒐𝒍𝒅 𝒔𝒕𝒓𝒆𝒂𝒎 𝑴 0, 552 𝑯𝒐𝒕 𝒔𝒕𝒓𝒆𝒂𝒎 𝑴 0, 5 𝑪𝒐𝒍𝒅 𝒔𝒕𝒓𝒆𝒂𝒎 𝒂𝒓𝒆𝒂 0,124 𝑚2 𝑯𝒐𝒕 𝒔𝒕𝒓𝒆𝒂𝒎 𝒂𝒓𝒆𝒂 0,461 𝑚2 𝑳𝒆𝒏𝒈𝒕𝒉 0,2 𝑚 𝑳/𝑫 1.0767
Table 15: Key mixer data
𝑆𝑡𝑎𝑔𝑒 𝟏 𝟐 𝜷𝟐 4 0 𝜷𝟑 53 49 𝜶𝟐 54 49 𝜶𝟑 0 0 𝑪𝒂 254 295 𝑼 335 344 𝑽𝟐 254 295 𝑽𝟑 420 453 𝑪𝟐 435 453 𝑪𝟑 254 295 ф 2,11 2,00 𝝍 0,76 0,86 𝑫𝒆𝒇𝒍𝒆𝒄𝒕𝒊𝒐𝒏 49 49 𝑹𝒆𝒂𝒄𝒕𝒊𝒐𝒏 0,47 0,50 𝑴𝒉𝒖𝒃,𝒓𝒆𝒍 0,40 0,44 𝑻𝒆𝒎𝒑. 𝒅𝒓𝒐𝒑 100 100
Table 14: LPT velocity triangles data at mean blade
43
4.3.7 Nozzle
Due to the high nozzle pressure ratio at supersonic speed, a convergent – divergent nozzle was chosen, which can be seen in figure 29. The areas are set to allow for the fluid to fully expand at design point. The angles are a compromise between length and thrust, a lower angle will lead to higher thrust, at the expense of a longer component. For very low angles, the losses due to skin friction will take over. The nozzle data can be seen in table 16. The rate of change in area as a function of distance together with the area as a function of distance in the nozzle can be seen in figure 30. 𝑪𝑽 0, 97 𝑪𝜽 0,988 𝑰𝒏𝒍𝒆𝒕 𝒂𝒓𝒆𝒂 1,099𝑚2 𝑻𝒉𝒓𝒐𝒂𝒕 𝒂𝒓𝒆𝒂 0, 453𝑚2 𝑬𝒙𝒊𝒕 𝒂𝒓𝒆𝒂 1,04𝑚2 𝑳𝒆𝒏𝒈𝒕𝒉 1,18m 𝑫𝒊𝒗𝒆𝒓𝒈𝒆𝒏𝒕 𝒂𝒏𝒈𝒍𝒆 12,5° 𝑷𝒆𝒕𝒂𝒍 𝒂𝒏𝒈𝒍𝒆 35,2° 𝑷𝑹 13,09 𝑨𝒕𝒉/𝑨𝒐𝒖𝒕 0,44 𝑨𝒊𝒏/𝑨𝒕𝒉 2,43
Table 16: Key Nozzle data
Figure 29: Nozzle component
44
4.3.8 Discs
The first stage HPC disc with some stress data can be seen in figure 31. The optimum design was a hyperbolic disc with the material Inconel 718. However, the disc had to become very heavy and wide to meet the target safety line due to high rotational speeds, which in turn caused a geometrical problem with the second stage disc. This was solved by making the gap between the center axis of the engine and the inner rim of the disc, also called bore radius, different for the two stages. The first stage has a bore radius of 4cm while the second stage has a bore radius of 9cm.
All the HPC discs, as well as the HPT disc, were designed with a hyperbolic disc and the material Inconel 718, with a bore radius of 4cm, except for the second stage HPC. Table 17 shows some key data for all the discs. The full disc analysis can be found in appendix D.
𝑫𝒊𝒔𝒄 𝑾𝒆𝒊𝒈𝒉𝒕 (𝒌𝒈) 𝑩𝒐𝒓𝒆 𝒓𝒂𝒅𝒊𝒖𝒔 (𝒄𝒎) 𝑴𝒂𝒙𝒊𝒎𝒖𝒏 𝒘𝒊𝒅𝒕𝒉 (𝒄𝒎) 𝟏𝒔𝒕 𝑯𝑷𝑪 160,8 4 23,4 𝟐𝒏𝒅 𝑯𝑷𝑪 38,3 9 7 𝟑𝒓𝒅 𝑯𝑷𝑪 19,8 4 3 𝟒𝒕𝒉 𝑯𝑷𝑪 16,9 4 2,5 𝟓𝒕𝒉 𝑯𝑷𝑪 16,9 4 2,4 𝑯𝑷𝑻 104,3 4 16,5
Table 17: Key data for HPC and HPT discs Figure 31: First stage HPC disc output file from T-AXI DISC
![Figure 1: Preliminary engine design process [10]](https://thumb-eu.123doks.com/thumbv2/5dokorg/4778886.127707/16.892.228.640.565.1099/figure-preliminary-engine-design-process.webp)
![Figure 4: Velocity triangles for a typical compressor stage [19]](https://thumb-eu.123doks.com/thumbv2/5dokorg/4778886.127707/22.892.277.623.112.430/figure-velocity-triangles-for-a-typical-compressor-stage.webp)
![Figure 6: Typical burner [22]](https://thumb-eu.123doks.com/thumbv2/5dokorg/4778886.127707/25.892.162.732.121.405/figure-typical-burner.webp)
![Figure 7: Theoretical thrust gain due to mixing [11]](https://thumb-eu.123doks.com/thumbv2/5dokorg/4778886.127707/26.892.240.655.780.1086/figure-theoretical-thrust-gain-mixing.webp)