CRITICAL APPROACHES TO ROAD INJURY TRENDS,
FORECASTS AND SCENARIOS: TWO URBAN CASES IN NORWAY
Stig H. Jørgensen 1), Andrew P. Jones 2), Torbjørn Rundmo 3), Trond Nordfjærn 4)
1) Department of Geography, Norwegian University of Science and Technology (NTNU), NO-7491Trondheim, Norway, Tel.: +4741044276; E-mail address: stig.h.jorgensen@svt.ntnu.no; 2) Norwich Medical School, University of East Anglia, Norwich, NR4 7TJ, UK; 3) Department of Psychology, NTNU, NO-7491Trondheim; 4) NTNU Social Research Studio Apertura, NO-7491 Trondheim, Norway;
ABSTRACT
Urban regions experience high population growth rates and possess distinct characteristics regarding mobility, mode of transport, road environments and road safety plans. Urban areas are prioritized in the Norwegian Transport Plan’s strategies for transport and by implementation of General Urban Environmental Agreements with casualty reduction targets.
The study examines possibilities and limitations in developing and analysing urban trends, forecasts and scenarios for killed and seriously injured road users in Norway. The Oslo and Trondheim regions are case studies for the period 1998–2025. Police reports of killed and seriously injured casualties 1998–2012 in the regions (NOslo = 1801, NTrondheim = 790) formed the basis of the analyses. The mean injury rate for Oslo region was 10.8 per 100,000 pop. per year for the period 2008–2012, whereas the corresponding figure for Trondheim was 15.7, the highest among all large urban areas. The road authorities’ accident targets towards 2025, initiated by the National Plan of Action for Road Safety are decomposed into regional units. On the basis of the two regions’ statistics relating to road casualties, the applied principle of equal proportional share indicates a 40% injury reduction towards 2025. Exponential models, ARIMA models, negative binomial regression, and scenario approaches were employed to estimate possible trends and changes in casualties in the studied urban regions. These models formed a framework to reveal critical assumptions, sensitivity, uncertainties, and realism in the road authorities’ strategies for casualty reduction targets and for trend extrapolations and predictions. The analyses consider sources of critical conditions to rate the magnitude of the following conditions: (1) the trend towards the prevailing road safety status (casualty numbers, casualty rate levels, and stability) problematized by small numbers and random variation; (2) the exposure effects of urban road network composition and urban–rural mix; (3) the exposure effect of population growth towards 2025, change in population, and risk-exposed road users; and (4) the exposure effect of shifts in mode of transport, with uncertainties regarding non-linear relationships between casualty numbers and exposure measures. Some effects of exogenous road safety measures of all types are considered, such as diminishing return and reduced sum effects of measures. One conclusion is that the various model approaches for the two urban regions demonstrate substantial uncertainties in trend forecasts. The models identify critical factors for fulfilling safety plans and reductions in the numbers of seriously injured casualties, even in the near future. The approaches indicate however that without strengthened safety strategies, the authorities’ 40% casualty reduction target most probably will not be achieved.
1. INTRODUCTION
Despite falling trends, the prevailing level of road traffic accidents is not acceptable in developed urban areas and is a major health concern. Motorized traffic contributes to environmental problems such as global warming, pollution and noise combined with traffic congestions (Banister 2002). In addition, road safety relates to public health issues in terms of injuries and highlights the need for physically active transport. Urban regions are populous areas and experience the highest number of road casualties, even though the proportion of fatalities and seriously injured casualties may be lower
than in rural areas. Urban areas represent functional commuter regions with a common trade and working market, and constitute geographical traffic systems, although crashes exhibit spatiotemporal heterogeneity. In Norway, the urban areas experience the highest population growth including socio-demographic changes in terms of immigration and migration (Statistics Norway 2014). Growth trends in combination with climate change risk lead to readjustments in urban mobility patterns and modes of transport, hence the need for comprehensive and critical road safety planning. Norway’s national transport policy calls for environmentally sustainable transport and the follow-up of Vision Zero targets, implying a strong reduction in seriously injured road casualties. Regional road safety plans take consideration of these national policy issues and search for appropriate countermeasures and changes in modal shares (reduction in private vehicle use). An essential part of the national road safety plan is to monitor road safety improvements by trends and changes in the accident patterns for setting targeted casualty or accident reduction measures and by developing strategies and action plans. However, such plans are challenged by the extrapolation of a small number trends and forecasting casualties in complex urban regions.
The aim of the study is to examine possibilities and limitations in developing and analysing urban trends, forecasts and scenarios for killed and seriously injured road users. The Oslo and Trondheim regions are examined as case studies for the period 1998–2025.
2. PATTERNS AND FORECASTING TRENDS
The prevailing accident pattern reflects the situation in the past, which can be calculated as specific rates related to exposure and as absolute numbers (counts) in a relatively short-term trend. Based on the prevailing casualty time series, trend line prolongations and forecasts can be modelled for urban regions. The predictions will be related to potential outcome under given conditions (Hauer 2010). In the literature on road accidents, forecasts focusing on casualties (counts) are commonly based on trend extrapolations or prolongations, including various functional forms for the trend lines (Elvik 2010a). Other alternatives, depending on research objectives and spatiotemporal aggregates, are time series models such as ARIMA with predictors or other generalized linear or log-linear multivariate models, dominantly negative binomial models, In cases of low means for the casualties in the study area and provided that there are few zero counts, variants of negative binomial (NB) models appear superior to Poisson models (Quddus 2008). They may include a time trend variable indicating when serious autocorrelations (i.e. serial dependency that disturbs the independency of the residuals) do not occur (Noland & Quddus 2004). A requirement of all multivariate models (including ARIMA) is forecasted values for the independent variables. Depending on the type of data, stability, and functional form, the models may suffer from omitted variable bias related to parsimonious versus full model specifications, multicollinearity, autocorrelations in time and space, and erroneous estimated coefficients (Mannering & Bhat 2014). Further extension of advanced models and rigorous approaches – such as NB models with random effect, integer-valued autoregressive (INAR) Poisson models, structural time series models (state space methods), and network models (Quddus 2008; Commandeur et al. 2013) – are often tailored to the research objective, unit of study, time period and frequencies of casualties.
3. MATERIAL AND METHODS
The material in the study is data on aggregated monthly serious casualty numbers in road traffic accidents 1998-2012, monthly motor vehicle exposure, monthly temperatures and a (common) trend variable, indicating road safety improvement, for two urban regions in Norway (Oslo and Trondheim). In accordance with the previous section, forecasting monthly casualty numbers in the near future is
based on forecasted values for the three independent variables (2014-2025). The presentations of results start with calculations of trends in the period 1998–2012 as mean 5-year period crude rates per 100,000 population by type of road users and type of roads. The urban region rates are based on place of accidents, i.e. the occurrence of killed or seriously injured road users in the regions irrespectively of their place of residence. These rates are followed by annual casualty numbers by densely and sparsely populated areas. Forecasts originate from monthly casualties by trend prolongations applying first exponential smoothing models and ARIMA models, as referred to in the section above, employing two independent variables (vehicle km and temperature, cf. overview table 4). Then forecasts are given by negative binomial regression (NB) models, with these independent variables and an additional time trend variable, by varying functional form and described in more detailed cf. table 3a and b). These NB models, regarded as the most appropriate type of model by their results, are used for scenario presentations 2014-2025. Four scenarios are outlined by the exposure variable, i.e. motor vehicle km, applying only reduction for private mileage in the scenario 3-4 as stated in the regional safety plans.
3.1 Data used in the analyses
The studied regions comprise the main urban municipalities of Oslo and Trondheim, which respectively have 63% and 65% of the urban region’s population, and their respectively 9 and 10 neighbouring municipalities (Norwegian Statistics 2014), indicating population centralised regions. We examined police records of accidents in these regions, i.e. casualties based on place of accident for the period 1998–2012. Underreporting existed, but there was less underreporting of serious and fatal motor vehicle crashes and casualties, but more underreporting in the case of accidents involving a single vehicle cycle accidents (and collisions between cyclists and pedestrians). There were no strong indications of geographical differences in reporting by urban area or differential reporting over time that might have introduced a distinct and systematic reporting bias into the data.
Three independent variables were employed: motor vehicle exposure, temperature and trend variable. Exposure in terms of vehicle km travelled as a summary measure of traffic, annual average daily traffic (AADT), obtained from the Norwegian Public Roads Administration’s aggregate statistics on the summary measure of annual vehicle kilometres travelled in counties (aggregated from annual AADT)) were fitted for 1998-2014 in the data set. In turn monthly levels of petroleum sales were incorporated to adjust for monthly variations in vehicle kilometres. For predicted values (2015-2025) the Institute of Transport Economics in Norway has developed travel demand passenger transport forecasts (for short and longer distances) at county level in Norway. We applied these, with month variation adjustments, in our analyses. The institute’s data are roughly in line with population growth (Madslien et al. 2011). For the following scenarios, and in accordance with the regional safety plans, a reduction in private vehicle km was calculated on the basis of the proportion of private vehicles of total vehicles in the regions (70% in both).
We also used meteorological data, basically temperature as more convenient than precipitation. Mean monthly temperatures are registered at the respective population centres in the two study regions. Temperature can also be treated as a surrogate variable for snow and ice conditions as well as a very crude proxy for darkness, in the sense that low temperatures imply a higher probability and risk of driving in darkness, not compensated by road lighting. Temperature may indicate elements of both risk and exposure levels (Fridstrøm et al. 1995). Leisure travel is reduced by low temperatures. Monthly temperature forecast (2015-25) is made by the Swedish Meteorological and Hydrological Institute The subsequent scenarios presented in part 7 are based on data from Statistics Norway’s medium population projections for the period 2014–2025, which consist of projections for fertility, life
expectancy, internal migration, and immigration (Statistics Norway 2014). Table 1 provides population growth figures and prevailing casualty sum figures.
Table 1: Population growth (2005, 2014) and number of seriously injured casualties (1998-2012) in the Oslo region and Trondheim region.
Urban region
Population Population growth
projections 2025 (MMMM)1 No of seriously injured casualties 1998–2012 2005 2014 Oslo 817,594 962,847 15.0% 1801 Trondheim 239,387 275,485 12.4% 790
1 Medium alternative for life expectancy, fertility, national migration, and immigration (Statistics Norway 2014)
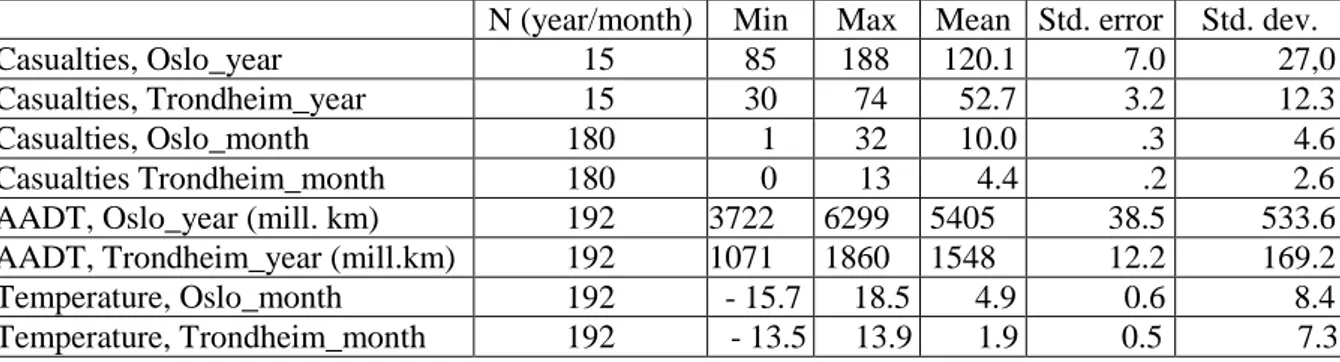
Table 2 reports descriptive for casualties, vehicle km (AADT) and mean monthly temperature
by year and month, and shows that the Oslo region, experiencing higher figures, has higher
standard deviations and standard errors. A trend variable was included as a proxy variable that
could capture a broad set of risk factors, including physical and sociocultural environment
(road system, land use, social norms, risk attitudes and behaviour), vehicle safety devices and
legislation. Month is introduced as a linear trend variable taking (std.error = 3.9; std.dev.
=52.1), subsequently transformed to non-constant rates of change i.e. logarithmic and
geometric (log- and square root expressing lower std. errors.) The functional form of the trend
variable is a critical issue (see Elvik 2010a). It is not uncommon to assume a slower decline in
casualty trends i.e. diminishing returns from safety measures (e.g. accident black spot removal
and crash barriers) and the gradual exhaustion of safety measures due to that they are nearly
fully implemented (e.g. airbags).
Table 2: Descriptive statistics by number of seriously injured casualties, vehicle km (AADT) and mean monthly temperature in the Oslo region and Trondheim region, 1998-2012/2013.
N (year/month) Min Max Mean Std. error Std. dev.
Casualties, Oslo_year 15 85 188 120.1 7.0 27,0
Casualties, Trondheim_year 15 30 74 52.7 3.2 12.3
Casualties, Oslo_month 180 1 32 10.0 .3 4.6
Casualties Trondheim_month 180 0 13 4.4 .2 2.6
AADT, Oslo_year (mill. km) 192 3722 6299 5405 38.5 533.6
AADT, Trondheim_year (mill.km) 192 1071 1860 1548 12.2 169.2
Temperature, Oslo_month 192 - 15.7 18.5 4.9 0.6 8.4
Temperature, Trondheim_month 192 - 13.5 13.9 1.9 0.5 7.3
4. CASUALTY PATTERNS AND PREVAILING TRENDS
The following rates are presented as non-age-adjusted per 100,000 population. They are pseudo rates since they included ‘outsiders’ (non-residents of the regions, in the nominator) involved in crashes within the regions, without taking into account the ‘true’ population at risk in the outsiders’ place of origin (in the denominator) (Haynes et al. 2005). In rate calculations there is a need to select an appropriate time period in order to reduce the effect of random variations and to capture trend changes. Here 5years periods are chosen. The Oslo region mean injury rate was 10.8 per 100,000 population per year in the period 2008–2012, which was substantially lower than 15.7 for the Trondheim region. Figure 1 shows stable fall in 5-year rates, with some exemptions for cyclists and pedestrians in the Oslo and Trondheim regions respectively. The rate reductions were due to an increasing population (the denominator), not to a strong decline in casualties (the nominator). Both the absolute and relative highest falls in rates related to car occupants. The Trondheim region experienced a similar relative rate reduction for cyclists.
Figure 1: Crude pseudo rate, killed and seriously injured casualties per 100,000 population by type of road user, with mean rate per 5-year period, 1998–2012, for Oslo region and Trondheim region.
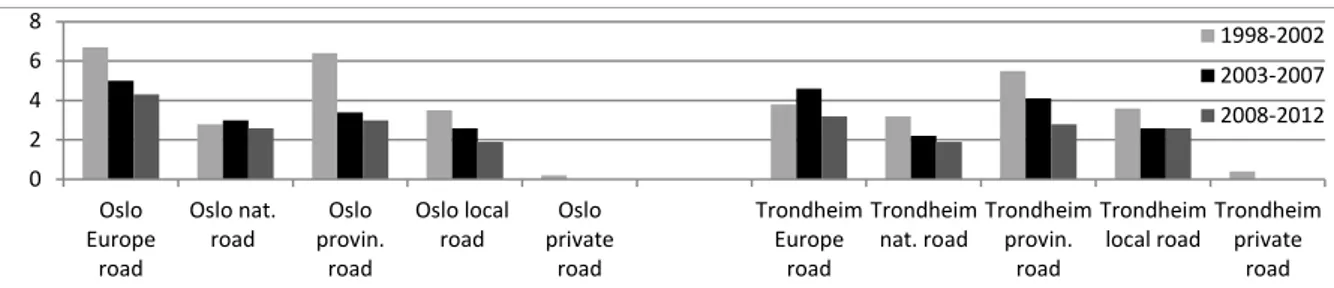
Type of road indicates road environment as well as vehicle speed and vehicle volume (in AADT). Figure 2 shows a more or less declining rate for all road categories, especially for provincial roads. Disregarding private roads, the lowest rate related to local roads in the Oslo region and to national roads in the Trondheim region. The rate differences are modest, and not to be confounded with vehicle kilometre exposure.
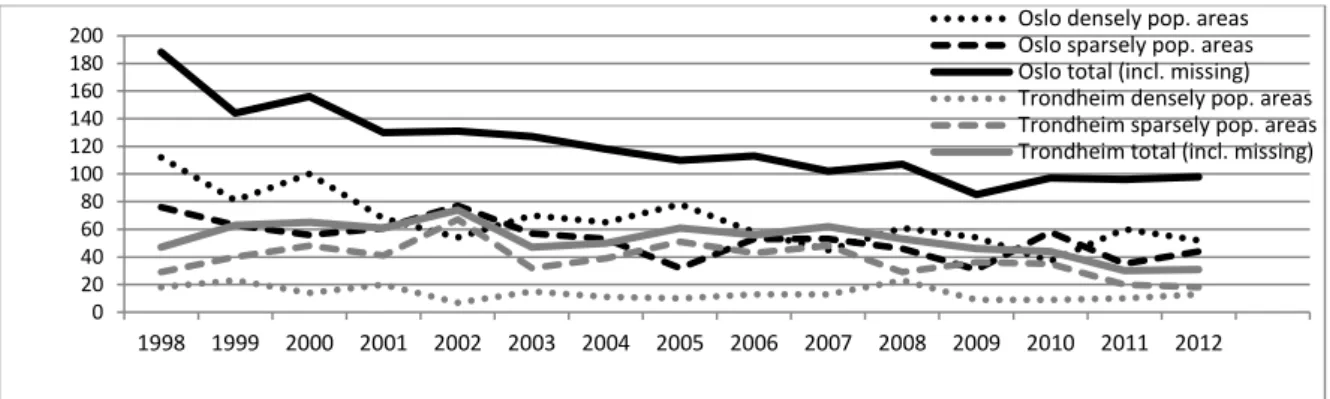
Figure 2: Crude pseudo rate, killed and seriously injured casualties per 100,000 population by main type of road, with mean rate per 5-year period, 1998–2012, for Oslo region and Trondheim region. With regard to absolute numbers of killed and seriously injured casualties, Figure 3 shows falling trend lines, but not a very strong tendency for this relatively short-term trend to stabilize over time (Elvik 2010a). The decline for the whole period for the Oslo region is more pronounced than for the Trondheim region. It is not evident that the trend line flattens out for the Oslo region in the years 2009–2012, whereas the trend line for the Trondheim regions falls. Clearly, the lines have to be interpreted with caution since there are random fluctuations from year to year. The casualties are split by accidents in densely populated versus sparsely populated areas, partly reflecting urban–rural land use mixes and posted speed limits in the wider urban regions. In the case of the Oslo region these two subcategory trend lines alternate in being at the highest level. In the Trondheim regions the casualties in sparsely populated areas dominate, and follow the overall casualty trend. This pattern may to a large extent confirm an assumption that the road safety implementation has been more successful in urbanized and residential areas in the Oslo region, in contrast to more effective implementation in sparsely populated and non-urban roads in Trondheim, which include ring roads and bypass roads.
0 1 2 3 4 5 6 7 8
Oslo pedestrian Oslo bicyclist Oslo private car Oslo other vehicles Trondheim pedestrian Trondheim bicyclist Trondheim private car Trondheim other vehicles 1998-2002 2003-2007 2008-2012 0 2 4 6 8 Oslo Europe road Oslo nat. road Oslo provin. road Oslo local road Oslo private road Trondheim Europe road Trondheim nat. road Trondheim provin. road Trondheim local road Trondheim private road 1998-2002 2003-2007 2008-2012
Figure 3: Annual casualty numbers by densely and sparsely populated areas 1998–2012, Oslo region and Trondheim region.
5. TRENDS IN THE NEAR FUTURE, REGIONAL SAFETY PLANS
The national target of a 40% reduction in seriously injured casualties towards 2025 have a profound bearing on regional casualty targets and hence on the plans and external financing to implement road safety measures. The applied principle of equal proportional shares originates from the regions’ current casualty numbers. Accordingly, developments in safety efforts in previous years are not taken into account when formulating the casualty target for the near future. An underlying assumption may be that countermeasures are not ‘exhausted’ and that additional measures may have reduced effect in combination with others (Elvik 2009b). However assumptions about the non-linear effect of various safety measures, diminishing marginal returns, and general accident or casualty time trends are not discussed in the two cased urban regions’ safety plans. In principle, it may be implicitly assumed that the safety impacts follow a linear downward sloping curve; in other words, that fact that there are no diminishing returns from various safety measures represents an optimistic scenario. Several neighbouring municipalities within both regions have relatively small population sizes and casualty numbers, and their short-term casualty numbers fluctuate with a very strong component of randomness. Limited safety planning capacity together with best intentions may result in targets for zero fatalities or even zero seriously injured casualties for a plan period. When a number of municipalities in the two regions independently pursue such safety targets, the sum effect will be an underestimation of the future casualties and overoptimistic trend prospects.
The National Plan of Action for Road Safety 2014–2017 calls for coordination of safety plans and assessment of various local countermeasures and their efficiency over time, such as the removal of accident black spots, traffic separation, and driver education. A complicating condition is supra-regional road authorities’ responsibility for national roads and safety-related decisions. However, led by the main urban municipality, regional safety plans adhere to national targets in order to secure additional financial support. General urban environmental agreements – known as ‘Oslo packages’ and in Trondheim’s case as ‘environment packages’ – considerably improve the financial situation for investments in road construction and strengthen the conditions for public transport, cycling, safety, and the environment. With exception of cargo transport and other public transport, reduced private motorized exposure may have an important safety impact and we discuss this further in the next section. In the Trondheim region the focus is on the number of accidents, not casualties, with a planned reduction of 20% towards 2025, which is relatively non-specific and lower than the national target. The target for accident reduction exceeds the target for reduction in casualties, since the mean number of car occupants or involved persons is higher than 1. The Oslo region’s target for seriously injured casualties is in line with the national main target (i.e. 40% reduction by 2025), and is more ambitious given the prevailing rates.
0 20 40 60 80 100 120 140 160 180 200 1998 1999 2000 2001 2002 2003 2004 2005 2006 2007 2008 2009 2010 2011 2012 Oslo densely pop. areas Oslo sparsely pop. areas Oslo total (incl. missing) Trondheim densely pop. areas Trondheim sparsely pop. areas Trondheim total (incl. missing)
6. MODELLING RESULTS
The time period set for the two case studies and for the modelling was 15 years of observations (180 observations) of monthly casualty numbers and an actual extrapolation period of 12 years, 2014–2025. The type of study unit – medium-sized urban regions – yields small monthly numbers of casualties (cf. Figure 4). The module ‘Forecasting’ in the statistical package SPSS Version 20 was used to activate the Expert Modeller to estimate the best-fitted models. For extrapolation of trends, the simple seasonal exponential smoothing model was identified for the two regions, as the monthly data exhibit seasonality with level and season as relevant parameters. The corresponding best ARIMA models with two significant prediction variables (vehicle km, temperature) have zero order of autoregression, one order of differencing, and six respectively one moving average orders for the Oslo- and Trondheim region. The models fit better for the Trondheim region (space blocks goodness-of-fit statistics). In addition to the time series models, negative binomial (NB) models were fitted with vehicle kilometre, temperature, and a time trend (‘month’) expected to cover the effect of broad changes in road safety measures over time. The ‘baseline’ model with a linear time trend gave the best overall goodness-of-fit results: The Omnibus tests and relevant coefficients are presented in Tables 3a-3d. Tests were performed to control for removal of outliers, which did not give different results. Both ‘vehicle km’ and ‘temperature’ turned out to be non-significant predictors. However it was deemed necessary to include exposure as an expected control variable and temperature, with an expected hypothesis of higher casualty numbers with higher temperatures, and to make the regional models comparable. One possible explanation for the findings in the regions is that the sum-effect of various safety measures outweighs and counteracts expected casualty increase due to increased exposure per se. The results for this period might be less typical than for a longer trend. This is hinted at in Figure 3. Table 3a: Parameter estimates, NB regression model, 3 independent variables (incl. month) Oslo region
Omnibus test for goodness-of-fit statistics: likelihood ratio chi-square: 11.5; degree of freedom 3; sign. level: 0,009: Parameter B Std. Error 95% Wald Confidence Interval Hypothesis Test
Lower Upper Wald chi-square df Sig.
(Intercept) 2.133 1.2924 -.400 4.666 2.723 1 .099
Month -.004 .0022 -.009 -.0002 4.211 1 .040
Vehic_km .00008 .0003 .0005 .001 .090 1 .764
Temp_mean .020 .0139 -.008 .047 2.017 1 .156 (Scale) 1a
a Fixed at the displayed value. Dependent var.: Oslo_killed_serinj, Model: (Intercept), month, vehic_km, temp_mean
Table 3b: Parameter estimates for NB regression model, 3 indep.variables. (incl. log_month) Oslo region.
Omnibus test for goodness-of-fit statistics: likelihood ratio chi-square: 12.7; degree of freedom 3; sign. level: 0,007: Parameter B Std. Error 95% Wald Confidence Interval Hypothesis Test
Lower Upper Wald chi-square df Sig.
(Intercept) 2.460 1.1644 .178 4.743 4.464 1 .035
Month_log -.282 .1327 -.543 -.022 4.528 1 .033
Vehic_km .000 .0003 .0004 .001 .330 1 .565
Temp_mean .017 .0143 -.011 .046 1.484 1 .223 (Scale) 1a
Table 3c: Parameter estimates, NB regression model, 3 indep. variables (incl. month), Trondheim region.
Omnibus test for goodness-of-fit statistics: likelihood ratio chi-square: 11.5; degree of freedom 3; sign. level: ,009 Parameter B Std. Error 95% Wald Confidence Interval Hypothesis Test
Lower Upper Wald chi-square df Sig.
(Intercept) -1.135 1.5667 -4.206 1.935 .525 1 .469
Month -.009 .0033 -.015 -.002 6.776 1 .009
Vehic_km .002 .0012 .0005 .005 3.295 1 .069
Temp_mean .008 .0166 -.025 .041 .229 1 .632
(Scale) 1a
a Fixed at the displayed value. Dependent var.: Trondh_killed_serinj. Model: (Intercept), month. vehic_km, temp_mean
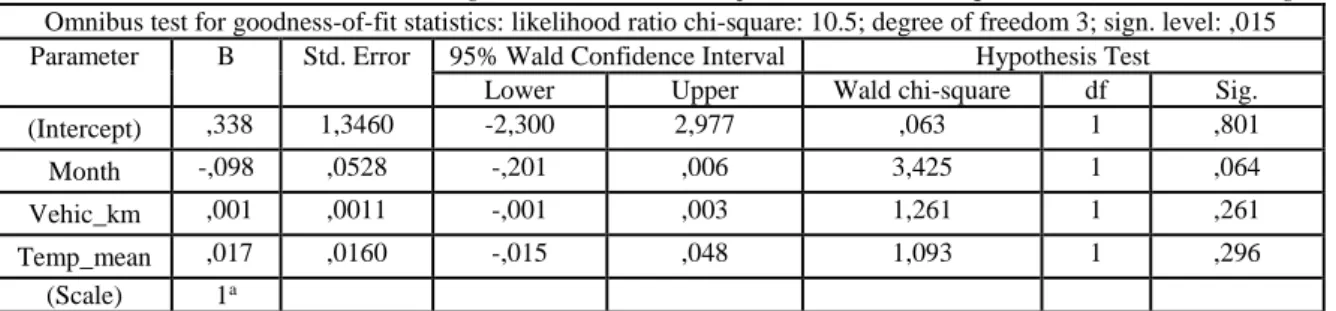
Table 3d: Parameter estimates, NB regression model, 3 indep. variables (incl. sqrt_month), Trondheim region. Omnibus test for goodness-of-fit statistics: likelihood ratio chi-square: 10.5; degree of freedom 3; sign. level: ,015 Parameter B Std. Error 95% Wald Confidence Interval Hypothesis Test
Lower Upper Wald chi-square df Sig.
(Intercept) ,338 1,3460 -2,300 2,977 ,063 1 ,801
Month -,098 ,0528 -,201 ,006 3,425 1 ,064
Vehic_km ,001 ,0011 -,001 ,003 1,261 1 ,261
Temp_mean ,017 ,0160 -,015 ,048 1,093 1 ,296
(Scale) 1a
a Fixed at the displayed value. Dependent var.: Trondh_killed_serinj. Model: (intercept), sqrt_month. vehic_km, temp_mean
After this presentation of details concerning the NB models, forecast output from all three types of models are presented by regions in table 4. Unquestionably the forecasted casualty numbers varies to a very great extent. Particularly concerning the Oslo region, some of the NB models seem to perform a higher accuracy in their forecasts compared with de facto observed casualty numbers (2010-2012). The ARIMA models may lack some robustness for small numbers and have some other inherent weaknesses (including wider standard deviations). For instance the forecasted casualty number for Trondheim 2025 (1.5 case) is deemed unrealistic. Uncertainty prevails, still an overall assessment (incl. modelling of other urban regions not shown in the paper) may favour application of the NB models for the scenario presentation.
Table 4: Forecast output, exponential smoothing models, ARIMA models, and NB regression models for number of killed and seriously injured casualties. Oslo region and Trondheim regions, 2014–2025.
Urban region
Model
(with independent variable)
Forecasted no.1 / actual 2010–2012 Forecast std.1 / actual std. 2010–2012 Forecast no. 2015–25 Forecast no. 2015–2025 std. Forecast no. 2025 Forecast 2025 std. Oslo Simple seasonal 223 / 290 2.42 / 3,87 1096 2.27 100 2.36
ARIMA (0,1,6) vehkm, temp 225 / 290 3.18 / 3.87 6212 3.17 502 3.58
NB, month, vehkm, temp 197 / 290 1.98 / 3.87 667 1.21 48 0.80
NB, log_month, vehkm, temp 295 / 290 1.65 / 3.87 1081 1.71 100 1.85 NB, sqrt_month, vehkm, temp 264/ 290 1.86 / 3.87 733 1.97 57 2.02 Trond
heim
Simple seasonal 162 / 105 1,42 / 2.09 361 1.30 32 1.35
ARIMA (0,1,1) vehkm, temp 149 / 105 1.24 / 2.09 1372 1.13 1.52 0,71
NB, month, vehkm, temp 118 / 105 0.92 / 2.09 201 0.62 11 0.23
NB, log_month, vehkm, temp 146 / 105 0.84 / 2.09 519 0.79 46 0.80 NB, sqrt_month, vehkm, temp 133 / 105 0.85 / 2.09 373 0.72 29 0.58
1 Forecasts based on the period 1998–2009; 2 Negative numbers have been replaced by ‘0’.
7. POSSIBLE SCENARIOS TOWARDS 2025
Safety programmes and scenarios for road traffic accidents are sensitive to given assumptions, and have been debated in Norway (e.g. Elvik 2008; 2010b) and other countries (Banister 2000; Fleury & Brenac 2001; van Wee 2002; Sørensen et al. 2007). Indirect effects, cross-effects, door-to-door transport, and geographical scale are among the crucial factors influencing the outcome of injury reduction measures. Scenario analysis, in this article involving both qualitative judgements and quantitative analysis, is comprehensive and flexible for accident forecasting but subject to the knowledge, experience and capacity of the analyser to some extent. Scenarios should be both plausible
and consistent. In principle ‘whole journey’ risks (Evans & Addison 2009) and risk distribution by transport modes (Jacobsen, 2003) should be assessed, however we lack relevant data. Attempts were made to fit the following four sets of scenarios towards 2025, implying successive annual changes. Business as usual. A base line prediction implies private passenger vehicle growth model predictions (Madslien et al. 2011) and population growth from population projections, 2014–2100, medium alternatives for fertility, life expectancy, internal migration, and immigration (Statistics Norway 2014). The sum effect of changing the sex and age distribution in the near future will be marginal due to certain socio-demographic effects that neutralize each other, such as an aging existing population balanced by an influx of younger migrants with higher education and non-Western immigrants with lower education. Regarding the composition effect of population growth towards 2025, few clues exist for an ‘over-proportional’ growth in high-risk exposed road users (Sagberg 2013). However, the exposure effect of population growth per se implies an increase in kilometres travelled by all modes of transport. Even though the proportion of licensed drivers in the younger generations is falling (Statistics Norway 2014), the population growth and expected economic growth will generate increasing numbers of car occupants and a higher traffic volume. Provided that current circumstances remain the same, an increase motorization generates more casualties since the elasticity of the number of casualties per kilometre is positive. Safety countermeasures may still strongly counteract this effect. Zero growth in private vehicle kilometres. With the exception of commercial and goods vehicles, and the projected population growth, this scenario coincides with Norway’s National Transport Plan 2014–2023 target for the entire growth in passenger transport in large urban areas to be achieved
through a modal shift to travelling by public transport, cycle and on foot (Meld. St. 26. (2012–2013)). A 20% reduction in private vehicle kilometres. Motor vehicle exposure is often assumed to be
non-linearly associated with numbers of seriously injured casualties because as traffic congestion increases, average speeds decrease followed by reductions in the frequency and severity of crashes. An open
question is whether the reverse argumentation is valid. A 40% reduction in private vehicle kilometres. This is the most extreme scenario, demanding
wide-ranging changes in modes of transport, possibly combined with reduced mobility and relinquishing mobility (‘non-travellers’) and IT communication or tele-activities substitutes (Mokhtarian 2009). In the present study a modal shift is not assumed to influence mobility level. A realistic shift share of the private motorization reduction might be a 25% increase both in cycling and walking, and a 50% increase in public transport and extra walking. There are reasons to assume that the reduced private vehicle kilometre will be replaced by an over-proportional number of shorter, local trips on foot and by cycle, including walking to public transport (cf. door-to-door) in a safer local traffic environment. Of further interest are the national road authorities’ targets towards 2025, initiated by the National Plan of Action for Road Safety (2014-17) i.e. the 40% reduction in fatal and seriously injured casualties towards 2025. This raised the question of which scenarios might be used to achieve this target in the regions? The relevant action parameter is exposure (private vehicle km). The time trend variable will in a rather crude way handle the changes in broad road safety measures influencing the risk level. Tables 5a and 5b show the prediction outcome for the Oslo- and Trondheim regions by the four scenarios after employing two NB models judged as realistic. (Linear and log-transformed time trends for the Oslo region, linear and square root–transformed time trend for the Trondheim region.) For the Oslo region, the NB model with linear trend line falls steeply to the first scenario and then reaches an almost 60% reduction in casualties for the fourth scenario, expressed as a mean for the last three years (2023–25) and correspondingly predicts 39 casualties versus the mean value 97 for the period 2010–12 (as a kind of reliable number per year in the end of the de facto observed period). The
NB model with log-transformed time trend shows on the other hand a uniform fall with higher forecasted casualty numbers, ending at a 44% casualty reduction for the fourth scenario and a prediction of 54 casualties (versus the 97 in for 2010–2012).
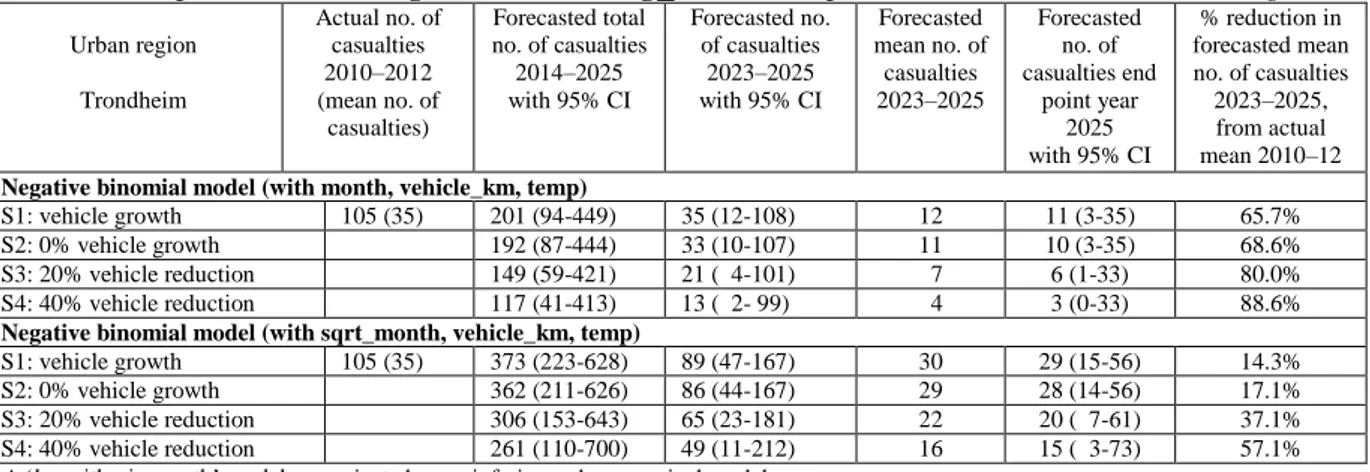
The upper part of Table 5b shows the trend line for the Trondheim region by the NB linear time trend exhibits an even more dramatic fall in the line down to an 89% reduction at the end of the forecast period, i.e. the fourth scenario and just 3 casualties at the end year 2025 compared to the mean value of 35 casualties in the last observation period. The decline seems non-realistic, judged by the prevailing policy level and road safety plans. The lower part of table 5b gives the model with square root transformed trend performing more ‘appropriate’, estimating a fall down to a 57% casualty reduction during the period 2023–25, ending with 15 casualties in scenario (compared to 35 as a mean for 2010–12). The national target of a 40% reduction towards 2025 is roughly equivalent to 58 casualties in the Oslo region and 21 in the Trondheim region. Tables 5a and b indicate that the Oslo region targets this number easily at scenario 1 for the ‘optimistic’ NB linear trend model, but first at scenario 4 for the ‘pessimistic’ model with logarithmic trend. For the Trondheim region, in the more realistic NB model (non-linear trend) this target is reached by scenario 4. However large uncertainties appear, as indicted by the wide confidence intervals and increases by level of vehicle km reduction in the consecutive scenarios. More details are given in figure 4 placing together the lines for two regions from the NB model with a linear trend for the scenario 1. Figure 5a and 5b illustrate the trend line development given all scenarios for may be the most robust models, the NB log-time trend model for the Oslo region and square root time trend model for the Trondheim region.
Table 5a: Forecasted 4 scenarios with changing private vehicle km. for seriously injured casualties, NB model comparisons including ‘month’ and ‘log_month, independent variable,* Oslo region.
Urban region Oslo Actual no. of casualties 2010–2012 (mean no. of casualties) Forecasted total no. of casualties 2014–2025 with 95% CI Forecasted no. of casualties 2023–2025 with 95% CI Forecasted mean no. of casualties 2023–2025 Forecasted no. of casualties end point year 2025 with 95% CI % reduction in forecasted mean no. of casualties 2023–2025, from actual mean 2010–12 Negative binomial model (with month, vehicle_km, temp.)
S1: vehicle growth 290 (97) 677 (377–1191) 150 (74-303) 50 48 (23-100) 48.5%
S2: 0% vehicle growth 642 (333-1260) 141 (61-326) 47 45 (18-108) 51.5%
S3: 20% vehicle reduction 621 (284-1414) 133 (46-393) 44 42 (13-132) 53.6% S4: 40% vehicle reduction 594 (224-1754) 124 (28-552) 41 39 (8-190) 59,8% Negative binomial model (with log_month, vehicle_km, temp)
S1: vehicle growth 290 (97) 1081(714-1661) 299 (175-517) 100 100 (57-180) -3.1% S2: 0% vehicle growth 957 (644-1431) 248 (162-384) 83 82 (53-128) 14.4% S3: 20% vehicle reduction 864 (468-1666) 212 (92-499) 71 69 (28-172) 28.9% S4: 40% vehicle reduction 756 (294-2316) 169 (36-826) 56 54 (10-296) 44.3%
* A ‘square root month’ model was rejected as an inferior and nonsensical model
Table 5b: Forecasted 4 scenarios with changing private vehicle km. for seriously injured casualties, NB model comparisons including ‘month’ and ‘log_month, independent variable,* Trondheim region.
Urban region Trondheim Actual no. of casualties 2010–2012 (mean no. of casualties) Forecasted total no. of casualties 2014–2025 with 95% CI Forecasted no. of casualties 2023–2025 with 95% CI Forecasted mean no. of casualties 2023–2025 Forecasted no. of casualties end point year 2025 with 95% CI % reduction in forecasted mean no. of casualties 2023–2025, from actual mean 2010–12 Negative binomial model (with month, vehicle_km, temp)
S1: vehicle growth 105 (35) 201 (94-449) 35 (12-108) 12 11 (3-35) 65.7%
S2: 0% vehicle growth 192 (87-444) 33 (10-107) 11 10 (3-35) 68.6%
S3: 20% vehicle reduction 149 (59-421) 21 ( 4-101) 7 6 (1-33) 80.0%
S4: 40% vehicle reduction 117 (41-413) 13 ( 2- 99) 4 3 (0-33) 88.6%
Negative binomial model (with sqrt_month, vehicle_km, temp)
S1: vehicle growth 105 (35) 373 (223-628) 89 (47-167) 30 29 (15-56) 14.3%
S2: 0% vehicle growth 362 (211-626) 86 (44-167) 29 28 (14-56) 17.1%
S3: 20% vehicle reduction 306 (153-643) 65 (23-181) 22 20 ( 7-61) 37.1%
S4: 40% vehicle reduction 261 (110-700) 49 (11-212) 16 15 ( 3-73) 57.1%
Figure 4: Casualty numbers forecasted for 2014–2025 by negative binomial model with month (non-transformed) vehicle kilometres and temperature, comprising scenario 1 (business as usual), Oslo region and Trondheim region.
Figure 5a: Casualty numbers per month 1998–2012 and the forecasting by negative binomial model with month (non-transformed) vehicle kilometres and temperature, comprising scenario 1 (business as usual) and scenarios 2–4 (40% private vehicle reduction) for 2014–2025, Oslo region.
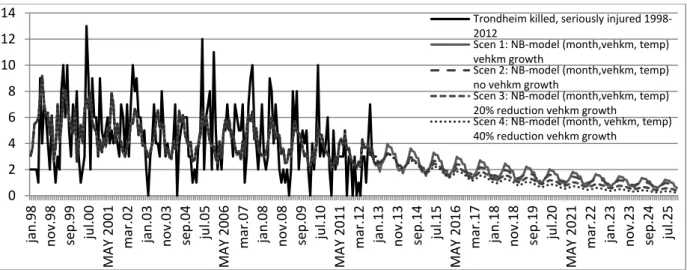
Figure 5b: Casualty numbers per month 1998–2012 and the forecasting by negative binomial model with month (non-transformed) vehicle kilometres and temperature, comprising scenario 1 (business as usual) and scenarios 2–4 (40% private vehicle reduction) for 2014–2025, Trondheim region.
0 5 10 15 20 25 30 35 0 1 .0 1 .1 9 9 8 0 1 .0 9 .1 9 9 8 M A Y 1 9 9 9 0 1 .0 1 .2 0 0 0 0 1 .0 9 .2 0 0 0 M A Y 2 0 0 1 0 1 .0 1 .2 0 0 2 0 1 .0 9 .2 0 0 2 M A Y 2 0 0 3 0 1 .0 1 .2 0 0 4 0 1 .0 9 .2 0 0 4 M A Y 2 0 0 5 0 1 .0 1 .2 0 0 6 0 1 .0 9 .2 0 0 6 M A Y 2 0 0 7 0 1 .0 1 .2 0 0 8 0 1 .0 9 .2 0 0 8 M A Y 2 0 0 9 0 1 .0 1 .2 0 1 0 0 1 .0 9 .2 0 1 0 M A Y 2 0 1 1 0 1 .0 1 .2 0 1 2 0 1 .0 9 .2 0 1 2 M A Y 2 0 1 3 0 1 .0 1 .2 0 1 4 0 1 .0 9 .2 0 1 4 M A Y 2 0 1 5 0 1 .0 1 .2 0 1 6 0 1 .0 9 .2 0 1 6 M A Y 2 0 1 7 0 1 .0 1 .2 0 1 8 0 1 .0 9 .2 0 1 8 M A Y 2 0 1 9 0 1 .0 1 .2 0 2 0 0 1 .0 9 .2 0 2 0 M A Y 2 0 2 1 0 1 .0 1 .2 0 2 2 0 1 .0 9 .2 0 2 2 M A Y 2 0 2 3 0 1 .0 1 .2 0 2 4 0 1 .0 9 .2 0 2 4 M A Y 2 0 2 5
Oslo, killed, inj.1998-2012 Trondheim, killed, inj.
Oslo, S1: Vehkm growth Trondheim, S1: Vehkm growth
0 5 10 15 20 25 30 35 ja n .98 n o v.9 8 se p .99 ju l.00 MAY 200 1 m ar .02 ja n .03 n o v.0 3 se p .04 ju l.05 MAY 200 6 m ar .07 ja n .08 n o v.0 8 se p .09 ju l.10 MAY 201 1 m ar .12 ja n .13 n o v.1 3 se p .14 ju l.15 MAY 201 6 m ar.17 jan.18 n o v.1 8 se p .19 ju l.20 MAY 202 1 m ar .22 ja n .23 n o v.2 3 se p .24 ju l.25
Oslo killed, seriously injured 1998-2012 Scen 1: NB-model (month,vehkm, temp) vehkm growth
Scen 2: NB-model (month, vehkm, temp) no vehkm growth
Scen 3: NB-model (month,vehkm, temp) 20% reduction vehkm growth
Scen 4: NB-model (month,vehkm, temp) 40% reduction vehkm growth
0 2 4 6 8 10 12 14 ja n .98 n o v.9 8 se p .99 ju l.00 MA Y 200 1 m ar .02 ja n .03 n o v.0 3 se p .04 ju l.05 MAY 200 6 m ar .07 ja n .08 n o v.0 8 se p .09 ju l.10 MAY 201 1 m ar .12 ja n .13 n ov .1 3 se p .14 ju l.15 MAY 201 6 m ar .17 ja n .18 n o v.1 8 se p .19 ju l.20 MAY 202 1 m ar .22 ja n .23 n o v.2 3 se p .24 ju l.25
Trondheim killed, seriously injured 1998-2012
Scen 1: NB-model (month,vehkm, temp) vehkm growth
Scen 2: NB-model (month,vehkm, temp) no vehkm growth
Scen 3: NB-model (month,vehkm, temp) 20% reduction vehkm growth
Scen 4: NB-model (month, vehkm, temp) 40% reduction vehkm growth
8. DISCUSSION
The tables and figures illustrate the variability in trends for the future and non-converging lines, linked to uncertainty in modelling of casualties at the target end point. It is not clear why NB models are a better fit for past trends than the other models. NB models could be related to low means of monthly casualties, non-linearity issues (Elvik 2009a) and to limited disturbances of autocorrelation. Application of a ‘universal’ proxy trend variable is vulnerable to omitted variable bias. A contribution to non-stable and poorly envisioned trends is the fact that the present regional risk level and casualty numbers had already reached a very low level: This represents a challenge to parameterizing the models and model fitting, given a limited number of potential explanatory variables. Another uncertainty is inherent in the development of casualty trends in the future, as the predicted trends are based on previous relations of variables, which may change the functional form due to conditions outside the model. Examples are exhaustion of the safety effect of current measures (returns for black spots and traffic calming) and the introduction of radical new measures such as ISA technology in vehicles. However, the modelling is not worthless even if the fit is moderate (Elvik 2010a).
Urban road safety authorities want to pursue defined targets according to plans. The modelling shows that they by no means ensured a target meeting. If assumptions of diminishing return and exhaustion of well-used measures hold good, the authorities should be sensitive to the composition of countermeasures in a comprehensive way. They have to consider to what extent various countermeasures represent a continuation or intensification of efforts. Systematic variation has declined in relation to random variation. However, as shown in figure 1-3, there are still system risk variations by road user groups (e.g. pedestrians), type of roads and areas To assure goal achievements, the urban authorities have to consider a strengthening of countermeasures as speed reductions in other areas (city centre with numerous pedestrians and European roads with high traffic volume) or driver license shortlisting potential risk takers. This may involve a steady (linear) progress, however measures could be regarded as unpopular measures. Although previous casualty prediction models for Norway as a whole have given too pessimistic trend lines, with substantially lower ex post fatal casualties (Elvik & Høye 2015), long periods with safety progress may lead to a future slowdown in the process. They point to difficulties with incorporating and explaining the effects of non-specific countermeasures, such as internalization of a promoted safety culture with less risky driving behaviour and educational interventions. There has been progress in quantifying the effects of physical measures and vehicles. Much more doubtful numerical measures prevail on social norms, driving behaviour and education, which may be of exogenous character and have a favourable ‘irrigation’ effect in the traffic system. The time trend variable in the presented models attempts to capture elements of this dynamism. There are arguments that trend curves will flatten out. It is nonsensical that they will reach negative or near negative values towards 2025. The models illustrate critical factors for fulfilling road safety plans and casualty reductions in the two case study regions, even in the near future. There will be judgement variations regarding which effect level of measures will be ‘right’ in the future.
When consistency in predictions does not seem possible, developing scenarios may be an alternative. The scenarios with private vehicle kilometres as the action parameter are based on a reduction of motorized exposure and not the risk level per se. Consequently, the modal shift will generate cross-effects on numbers of casualties by changes to modes experiencing higher injury risk rates, such as cycling and walking. The NB models capture the general previous and future mode redistribution effects, but cannot display the marginal effect of vehicle kilometres on casualties, due to the substantial effect of the time trend variable. Other calculations performed show ‘additional’ effects of a 25% successive increase of cyclist and pedestrian kilometres taken from a 20% reduction in private vehicle kilometres (scenario 3). Applied elasticity coefficients for the volume–casualty relationship set
at 0.5 and 0.7 (cyclist and pedestrians) and 0.3 (drivers), gave a net excess number of casualties in the magnitude of 2–5 casualties for the Oslo region and 1–2 for the Trondheim region for the period 2014–2025. Hence, the volume redistribution is far from approaching a reduction in line with a ‘safety in numbers’ effect (Jacobsen 2003; Elvik & Bjørnskau In press). The reduction in private vehicle kilometres could be regarded as dramatic, but this crude exposure measure is not strongly related to the casualty numbers as ‘other risk reducing efforts’ strongly outweigh this exposure effect.
There is a need to strengthen comprehensive urban regional planning where reduced motorized exposure implies a mitigation of risk conditions for non-motorized road users. Crossover effects will occur due to changes in modal share. More cyclists or pedestrian should induce more casualties (also non-motorized accidents) given a moderate increase in exposure level. For instance, cycling is promoted without efforts to estimate the total accident effect following a change to a higher actual risk mode. Regions with low casualty numbers, as these urban cases, will face various challenges in their safety plans in the further disaggregation of trends by groups (age, road users) or areas (municipalities, neighbourhoods). Within the region, municipal safety plans are often prone to target zero fatalities and even serious casualties, as they experience small numbers and randomness. The sum effect of such sub-plans is ‘overoptimistic’ targets. A consequence of sources of uncertainty in the future casualty numbers is that regional authorities could be ‘perplexed’ by these confrontations and switch their attention to more predictable targets (reductions in traffic flows, CO2 or air pollution). Area-based forecasts pay attention to a complex interaction of small number problems, randomness, and effects of geographical functional exposure–risk relationships on the one side, and the outcome in terms of types and numbers of casualties on the other side. The regional safety authorities should, through appropriate safety plans, develop the best preconditions to take adequate account of a likely future.
9. CONCLUSIONS
The various model approaches for the two case study urban regions demonstrate substantial uncertainties in trend line forecasts, even for the near future. Performance limitations emerge due to small numbers, random variation, and critical assumptions by types of models and scenarios. The rate level and casualty numbers in the regions are already at a very low international level. The uncertainty may give indications to substantially safety benefits already achieved. Nevertheless, measuring exposure to injury risk and taking uncertainty into account is an important component of road safety plans. The model approaches may indicate strengthened safety strategies that involve a reduction in exposure (private vehicle kilometres in urban areas) as well as a further risk reduction in both the road environment and sociocultural conditions of driving behaviour including enforcement. The models point to some critical factors for fulfilling road safety plans. Few attempts have been made to support the expected safety returns of various types of countermeasures and assess their degree of exhaustion. Regional safety plans suffer from fragmented plans for the municipalities and limited inter-municipal collaboration and coordination. There is limited sensitivity to safety impacts following from stated scenarios and estimations of effects of combined measures as well as shifts in mode of transport. With a tendency towards diminishing returns of the joint impact of countermeasures, the authorities’ 40% casualty reduction target will most probably not be achieved.
REFERENCES
Banister, D. (2000). Sustainable urban development and transport – a Eurovision for 2020. Transport Reviews, Vol. 20, pp. 113–120.
Commandeur, J.J., Bijleveld, F.D., Bergel-Hayat, R., Antoniou, C., Yannis, G. & Papadimitriou, E. (2013). On statistical inference in time series analysis of the evolution of road safety. Accident
Analysis and Prevention, Vol. 60, pp. 424–434. Elvik, R. (2008). Road safety management by objectives: A critical analysis of the Norwegian
approach. Accident Analysis & Prevention, Vol. 40, pp. 1115–1122. Elvik, R. (2009a) The non-linearity of risk and the promotion of environmentally sustainable transport.
Accident Analysis and Prevention, Vol. 41, pp. 849–855. Elvik, R. (2009b). An exploratory analysis of models for estimating the combined effects of road
safety measures. Accident Analysis & Prevention, Vol. 41, pp. 876–880. Elvik, R. (2010a). The stability of long-term trends in the number of traffic fatalities in a sample of
highly motorised countries. Accident Analysis and Prevention, Vol. 42, pp. 245–260. Elvik, R. (2010b). Sources of uncertainty in estimated benefits of road safety programmes. Accident
Analysis & Prevention, Vol. 42, pp. 2171–2178. Elvik, R. & Bjørnskau, T. (In press). Safety-in-numbers: A systematic review and meta-analysis of
evidence. Safety Science. DOI: 10.1016/j.ssci.2015.07.017 Elvik, R. & Høye, A. (2015). Hvor mye kan antall drepte og hardt skadde i trafikken reduseres.
Foreløpige beregninger. TØI rapport 1417. Institute of Transport Economics. Oslo. Evans, A.W. & Addison, J.D. (2009) Interactions between rail and road safety in Great Britain.
Accident Analysis & Prevention, Vol. 41, pp. 48–56. Fleury, D. & Brenac, T. (2001) Accident prototypical scenarios, a tool for road safety research and
diagnostic studies. Accident Analysis & Prevention, Vol. 33, pp. 267–276.
Fridstrøm, L., Ifver, J., Ingebrigtsen, S., Kulmala, R. & Krogsgård Thomsen, L. (1995). Measuring the contribution of randomness, exposure, weather, and daylight to the variation in road accident counts. Accident Analysis & Prevention, Vol. 27, pp.1–20. Hauer, E. (2010). On prediction in road safety. Safety Science, Vol. 48, pp. 1111–1122. Haynes, R., Jones, A., Harvey, I., Jewell, T. & Lea, D. (2005). Geographical distribution of road
traffic deaths in England and Wales: place of accident compared with place of residence. Journal of Public Health, Vol. 27, pp. 107–111. Jacobsen, C. (2003). Safety in numbers: More walkers and bicyclists, safer walking and bicycling.
Injury Prevention, Vol. 9, pp. 205–209. Madslien, A., Steinsland, C. & Maqsood, T. (2011). Grunnprognoser for persontransport. TOI rapport
1122. Institute of Transport Economics, Oslo.
Mannering, F.L. & Bhat, C.R. (2014). Analytic methods in accident research: Methodological frontier and future directions. Analytic Methods in Accident Research, Vol. 1, 1–22. Meld. St. 26. (2012–2013). Nasjonal transportplan 2014–2023. Samferdselsdepartementet. Oslo. Mokhtarian, P.L. (2009). If telecommunication is such a good substitute for travel, why does
congestion continue to get worse? Transp. Lett. Int. J. Transp. Res., Vol.1, pp. 1–17. Noland, R.B. & Quddus, M.A. (2004). A spatially disaggregate analysis of road casualties in England.
Accident Analysis and Prevention, Vol. 36, pp. 973–984. Quddus, M.A. (2008). Time series count data models: An empirical application to traffic accidents.
Accident Analysis and Prevention, Vol. 40, pp. 1732–1741. Sagberg, F. (2013). Ulykkesinnblanding, kjøreatferd og holdninger blant nye bilførere:
Effektevaluering av læreplanen fra 2005 for førerkort klasse B. TØI rapport 1287. Institute of Transport Economics, Oslo. Sørensen, M., Elvik, R. & Assum, T. (eds.) (2007). Nyt etappemål for trafiksikkerhet i Sverige. TØI
rapport 930, Institute of Transport Economics, Oslo. Statens vegvesen. (Undated). National Plan of Action for Road Safety 2014–2017. Statistics Norway. (2014). https://www.ssb.no/en/befolkning/statistikker/folkfram van Wee, B. (2002). Land use and transport: Research and policy challenges. Journal of