FULL SCALE PROCESS DESIGN FOR ENERGY
RECOVERY FROM SWINE MANURE
Wathsala Jinadasa
Eshetu Janka Wakjera
Rune Bakke
Telemark University College, Norway
ABSTRACT
The aim of this study is to investigate biogas reactor designs to recover energy from swine manure and utilize that energy for a small scale pig farm in Norway. Continuous stirred tank reactor (CSTR) and upflow anaerobic sludge blanket (UASB) reactor were the design alternatives investigated. Simulations were based on the anaerobic digestion model no.1(ADM1) implemented in Aquasim software.
The model was calibrated based on a series of laboratory batch reactors. The batch reactor with the highest biogas yield was first simulated to obtain the organic matter concentration in the feed manure. The resulting calibrated model was used to simulate CSTR and UASB reactors for a manure feed flow rate of 2m3/day. Different CSTR volumes in the range of 10-60 m3 and UASB volumes in the range of 2-20 m3 were assessed using simulations. At low reactor volumes overloaded conditions were observed. Maximum energy production of 128 kWh/day at a biogas production rate of ~20 m3/day (68-71 % methane content in the biogas) was simulated for the reactor volumes for CSTR and UASB of 30m3 and 2.5m3, respectively. An efficient biogas production (e.g. to cover farm energy needs) can be obtained from a UASB reactor that can be constructed and installed at a reasonable cost.
KEYWORDS
Swine manure, Biogas, Energy recovery, ADM1 simulations
1 INTRODUCTION
At the end of year 2002, there were about 90,000 breeding sows with an annual production of about 1.5 million fattening pigs in Norway [8]. This pig population (breeding) has increased to 100 500 at the end of year 2009[7]. More than 8500 registered pig or poultry producers and approximately 3000 herds have been recorded and each farm thus averages 30 breeding sows or gilts [8]. Swine are estimated to produce daily raw manure of as much as 8.4 percent of body weight (urine and feces)[14]. This manure is a resource as fertilizers due to high nutrient content and as a renewable energy source with a potential of 0.328 kWh/swine/day[10]. The environmental effects of swine manure storage systems and application methods are a concern, particularly with respect to surface water and groundwater quality and to air quality [14]. Handling manure in pig farms is a challenge to farm owners due to odour problems, loss of nutrients to both air and water and spreading of pathogens. The available technologies such as membrane separation and bio-filtration to treat pig manure have addressed the above problems but they are limited to large scale farms due to economical factors as well as
required level of technical expertise. There is a need in swine industry and in other livestock industries for a sustainable method to handle manure, that is even it is affordable to small scale farms. Anaerobic digestion(AD), which converts swine manure into biogas and a stabilized fertilizer, is considered as the only potentially solutions for sustainable manure handling.
Hydorlysis, acidogenesis, acetogenesis and methenogenesis are the four main digestion steps of organic substances such as manure taking place in AD. The ultimate gaseous products of this complex conversion are methane, carbon dioxide and hydrogen. AD can be simulated using the ADM1 model [15]. Advantages of using simulations for pig manure biogas plant design is that it provides the opportunity to predict required process size and outputs without time-consuming pilot tests, based just on quite simple lab tests. Consequently, it reduces evaluation cost during project planning in pilot and full scale plant design.
The aim of the project is to estimate AD reactor size required for energy recovery as biogas from manure at a typical Norwegian pig farm. This information is used to evaluate if sustainable biogas production is achievable in small scale agriculture.
2 DESIGN CRITERIA
The design is based on a case study for a pig farm having pig population in the 400-500 range (Average weight ~60 kg) in Porsgrunn, Norway. Assuming a daily manure production of 8 % of body weight per pig, an average manure production rate of ~2 m3/day was considered as
the available AD feed and used as loading rate. An energy production as biogas of 30 kWh/d, 120 kWh/d, 60 kWh/d and 15 kWh/d during four seasons of autumn, winter, spring and summer, respectively, were used to simulate varying energy demands through the year. The density and energy content of methane at 23oC was calculated using that of 0.6346 kg/m3 and 50100 kJ/kg at 35oC, assuming ideal gas behavior which gave 0.66 kg/m3 of methane density and 33000 kJ/m3 of energy content[12]. These values were used to calculate energy production in each reactor volume simulated. COD was measured as 30 kg COD/m3 and 37 kg COD/m3 in filtered and unfiltered pig manure samples, respectively. Solid analysis of the samples, gave the results as 10 g/L total solids (TS), 3.3 g/L total suspended solids (TSS) and 2.5 g/L of volatile suspended solids (VSS).
3 METHOD
The aquasim software[13], which is a useful research tool to perform simulations, sensitivity analysis and parameter estimations using measured data based on lab scale tests [15], has been the basic design tool in this study.
Twelve 100 ml volume anaerobic digesters were run in batch scale at 23oC, which is the average room temperature in Norway, to measure biogas production rates and yields for pig manure. Simulations of the experimental cases with the highest yields where then performed to estimate feed composition. The feed composition that simulated biogas production closest to that of observed was assumed to be close enough to the real manure as AD feed to be used in design simulations.
After confirming that the ADM1 model biogas production simulations were as measured, the model was used to design CSTR and UASB reactors for large scale operation. The performance of each reactor was evaluated for different hydraulic retention times (HRTs). Since typical hydraulic retention time for CSTR is 15 to 30 days, based on 2 m3/day flow rate,
reactor volumes of 10, 20, 30, 40 and 50 m3 were selected to simulate the reactor. For UASB, hydraulic retention times have been reported as 4 to 8 hours for high strength wastewater [12]. However, preliminary simulation trials showed overloaded condition for UASB reactor volumes less than 2 m3 for this feed. Hence, volumes in the range of 2.5-20 m3 were applied for the UASB reactor simulations. The energy production in each reactor was calculated based on biogas production rate and methane concentration results in each simulation. The reactor which generated the maximum power was selected in the final discussion of such solutions.
4 RESULTS AND DISCUSSION
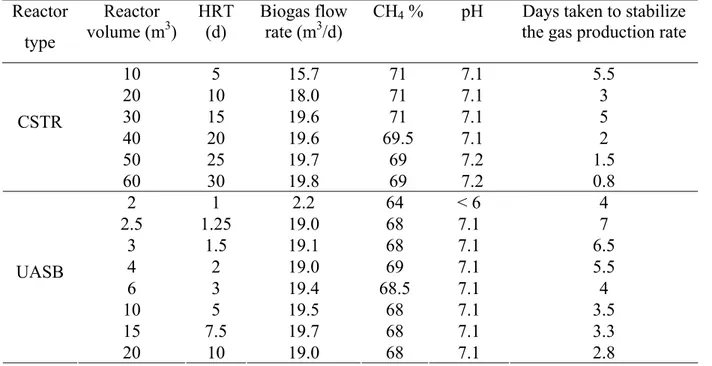
Table 1 presents the simulation results of CSTR and UASB. The simulation results for CSTR showed an increased biogas production rate with increased reactor volume, with methane composition ~70 %. The days required to stabilize the gas production rate to a constant value have become lower with increased reactor volume. Simulation also revealed pH around 7.1 in all cases, which is a favourable condition for biogas production. The UASB reactor provided approximate similar biogas yield as the CSTR, but with less reactor volumes. The 2 m3 UASB volume simulation gave a drastic drop in pH and bioreactor VFA accumulation, implying digester instability and process failure at one day HRT.
Energy production for each reactor volume was calculated based on biogas flow rates and composition (see Table 1). At 23oC the ideal gas assumption gives a density of methane as
0.634 x (273+35) / (273+23) = 0.66 kg/m3 and methane energy content as 50100 x 0.66 =33000 kJ/m3. Calculated energy output for both CSTR and UASB is shown in Table 2. Table 1: Simulation results for AD with different volumes fed 2 m3 pig manure/day.
Reactor type Reactor volume (m3) HRT (d) Biogas flow rate (m3/d)
CH4 % pH Days taken to stabilize
the gas production rate
10 5 15.7 71 7.1 5.5 20 10 18.0 71 7.1 3 30 15 19.6 71 7.1 5 40 20 19.6 69.5 7.1 2 50 25 19.7 69 7.2 1.5 CSTR 60 30 19.8 69 7.2 0.8 2 1 2.2 64 < 6 4 2.5 1.25 19.0 68 7.1 7 3 1.5 19.1 68 7.1 6.5 4 2 19.0 69 7.1 5.5 6 3 19.4 68.5 7.1 4 10 5 19.5 68 7.1 3.5 15 7.5 19.7 68 7.1 3.3 UASB 20 10 19.0 68 7.1 2.8
Table 2. Energy production by different reactors.
Reactor type Reactor volume (m3) kWh/day
10 102 20 117 30 128 40 125 50 125 CSTR 60 126 2 13 2.5 128 4 128 6 127 10 122 15 123 UASB 20 119
In comparison of UASB and CSTR, UASB requires about twelve times smaller volume than CSTR to obtain the highest power production. A CSTR volume of 30 m3 is needed to obtain 128 kWh/day biogas energy output, while a UASB volume of 2.5 m3 is required for the same
production. If a 2.5 m3 UASB can fulfill the energy demand of the pig farm, it seems likely that such a solution can be sustainable, also from an economical point of view. Such a relatively small UASB reactor installation is expected to be a cost effective solution.
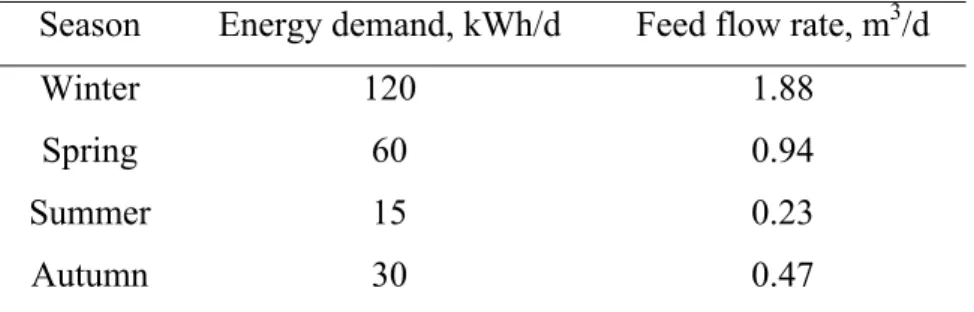
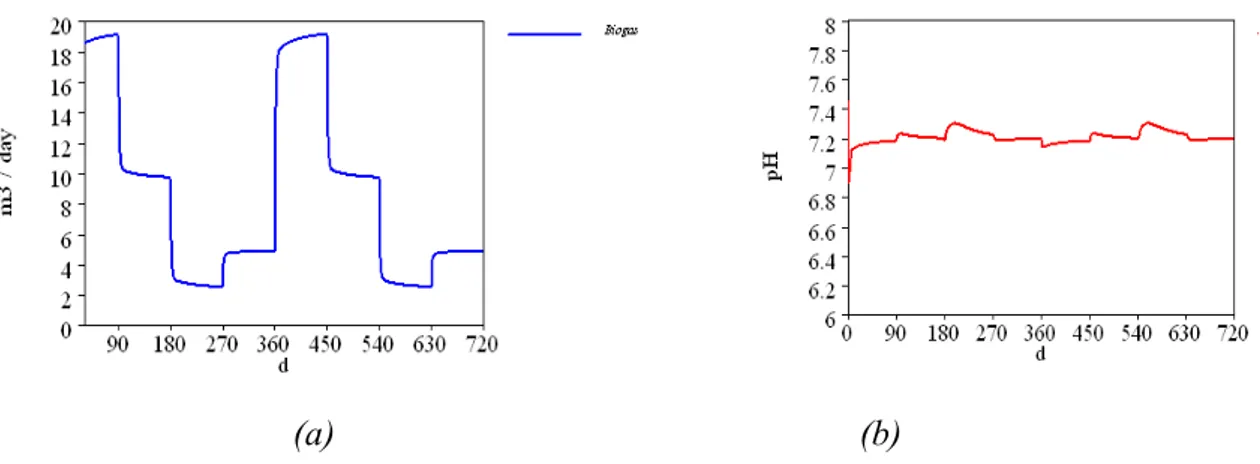
Simulation results for the 2.5 m3 UASB reactor operated to supply seasonal energy demand variations are shown in Figure 1. Produced biogas energy and the inlet manure flow rate are shown in Table 3. Figure 2(b) shows small pH variations due to load changes, implying that there is no harmful effect to the digestion of the different flow rates that are changed step wise in 90 days time intervals.
The pig farm energy demand considered in case study can be satisfied by a UASB reactor having 2.5 m3 volume, with a surplus of energy during three seasons if the same input flow
rate of 2 m3/d is supplied. If there is any economical value of producing and using this surplus, it is recommended to feed the reactor a constant 2 m3/d flow rate. If there is no purpose of producing a surplus of energy, a good option is to operate the plant such that it only generates the energy required to fulfill the demand in each season. This can be easily done by changing the input flow rate accordingly (Table 3, Figure 1).
Table 3. Adjusted inlet flow rates according to seasonal energy requirement Season Energy demand, kWh/d Feed flow rate, m3/d
Winter 120 1.88
Spring 60 0.94
Summer 15 0.23
(a) (b)
Figure 1. Simulated 2 year UASB reactor (2.5 m3) biogas production to cover seasonal energy demands (a) and pH variations during the same period (b) .
5 CONCLUSION
Experimental biogas batch production from pig manure was simulated well by the ADM1 model with calibrated feed composition. Produced biogas composition is 68-71 % CH4 and
29-32 % CO2 and 231 J energy can be produced by 1 ml of pig manure. Biogas production of
19 m3 per 2 m3 feed can be obtained from the pig manure tested in both CSTR and UASB reactors. The UASB reactor volume requirement is only 2.5 m3(excluding safety factor), while a 30 m3 CSTR is required for the same production. Energy generation from the pig manure can fulfill the required energy demand of the pig farm. The UASB reactor is suitable for pig manure biogas generation because reactor volume is low and because production can be varied according to demand without causing process failures due to overload caused by large stepwise feed flow increases. Biogas production by AD in a UASB therefore seems to be a likely candidate for sustainable energy recovery from manure.
ACKNOWLEDGEMENT
The authors wish to pay their gratitude to laboratory engineer H.H. Haugen for her technical support and suggestions during the study. A special thank goes to Deshai Botheju for his guidance in simulations.
REFERENCES
[1] BP Statistical Review of World Energy., June 2008. Available at www.bp.com/statisticalreview
[2] Fulhage, C. D., Sievers, D., Fischer, J. R., Generating methane gas from manure. Department of Agricultural Engineering, University of Minnesota.
[3] Chae, K. J., Yim, S. K., Choi, K. H., Park, W. K., and Lim, D. K., Anaerobic digestion of swine manure: Sung-Hwan farm-scale biogas plant in Korea.
[4] Hobson, P. N., Wheatley A. D., 1993. Anaerobic digestion-modern theory and practice. Elsevier Science Publishers Ltd., England.
[5] Biogasanlagen in der Landwirtschaft, AID Infodienst Verbraucherschutz, 2005
[6] Batstone, D. J., Keller, J., Angelidaki, I., Kalyuzhnyi, S.V., Pavlostathis, S.G., Rozzi, A., Sanders, W. T., Siegrist, H., Vavilin, V. A., 2002. Anaerobic Digestion Model No1
(ADM1). IWA Task Group for Mathematical Modeling of Anaerobic Digestion Processes. The IWA Publishing, London.
[7] Statistics Norway., 2009. Agricultural area and livestock., Table 2:Domestic animals: 1998-2009. Available at www.ssb.no/jordbruksareal_en/
[8] Sæther N. H., 2002. Norway Country Report on Farm Animal Genetic Resources. The Committee on Farm Animal Genetic Resources
[9] AgSTAR Handbook., 2010. A Manual for Developing Biogas Systems at Commercial Farms in the United States.
[10] http://www.auraquest.com/research-and-development/alternative-energies.html [Accessed 21st February 2010].
[11] California Energy Commision, 2010. Renewable Energy Research, Available at http://www.energy.ca.gov/research/renewable/biomass/anaerobic_digestion/ [Accessed 03rd April 2010]
[12] Tchobanoglous, G., Burton, F. L., Stensel, H. D., 2003. Wastewater Engineering: Treatment and Reuse, 4th Ed., Metcalf and Eddy, Inc., Tata McGrow-Hill Publishing Company Ltd., New Delhi.
[13] Reichert, P., 1998. AQUASIM 2.0 - User Manual, Swiss Federal Institute for Environmental Science and Technology (EAWAG), CH-8600 Dübendorf, Switzerland.
[14] Hatfield, J. L., Brumm M. C., and Melvin S. W., 1998. Swine manure management. Conserv. Res. Rpt. No. 44. Washington, D.C. USDA−ARS.
[15] Reichert, P., 1994. Aquasim - A tool for simulation and data analysis of aquatic systems, Water Sci. Tech., 30(2), 21-30.
[16] Jinadasa, W.,2010. Report on investigation of biogas potential from swine manure, EET Spring Project, Telemark University College, Porsgrunn, Norway.