Degree project in Criminology Malmö University
SYSTEMATIC SOCIAL
OBSERVATION OF PHYSICAL
DISORDER IN INNER-CITY
URBAN NEIGHBORHOODS
THROUGH GOOGLE STREET
VIEW
THE CORRELATION BETWEEN VIRTUALLY
OBSERVED PHYSICAL DISORDER,
SELF-REPORTED DISORDER AND VICTIMIZATION
OF PROPERTY CRIMES
SYSTEMATISK SOCIAL
OBSERVATION AV FYSISK
OORDNING I URBANA
BOSTADSOMRÅDEN GENOM
GOOGLE STREET VIEW
SAMBANDET MELLAN VIRTUELLT
OBSERVERAD FYSISK OORDNING,
SJÄLVRAPPORTERAD OORDNING OCH
UTSATTHET FÖR EGENDOMSBROTT
KARL KRONKVIST
Kronkvist, K. Systematisk Social Observation av Fysisk Oordning i Urbana Bostadsområden genom Google Street View. Sambandet mellan Virtuellt Observerad Fysisk Oordning, Självrapporterad Oordning och Utsatthet för Egendomsbrott. Examensarbete i Kriminologi 15 högskolepoäng. Malmö
Högskola: Fakulteten för hälsa och samhälle, Institutionen för Kriminologi, 2013. Sambandet mellan den fysiska miljön och brottslighet har sedan länge varit en relevant fråga inom den kriminologiska diskursen. Den föreliggande studien ämnar vidare undersöka huruvida fysisk oordning i urbana bostadsområden kan studeras genom Google Street View, ett webbaserat instrument för virtuella observationer. Syftet med studien är att undersöka om virtuellt observerad och självrapporterad uppfattad grad av fysisk oordning i bostadsområdet mäter samma fenomen, men även om virtuellt observerad fysisk oordning kan förklara
skillnader i självrapporterad utsatthet för egendomsbrott. Genom att utföra virtuella observationer av fysisk oordning med hjälp av Google Street View i tjugo centralt belägna bostadsområden i Malmö visar resultaten att observerad och självrapporterad grad av fysisk oordning är starkt korrelerade och förefaller mäta samma fenomen. Resultaten visar även att observerad nivå av fysisk oordning genom Google Street View till viss del kan förklara variansen av utsatthet för egendomsbrott mellan bostadsområden. Avslutningsvis framhålls i studien att virtuella observationer genom Google Street View är ett lovande samt potentiellt kostnadseffektivt tillvägagångssätt för att undersöka graden av fysisk oordning i urbana bostadsområden. Användandet av Google Street View kantas dock av flera begränsningar som både framhålls och diskuteras grundligt i denna studie.
Nyckelord: bostadsområden, egendomsbrott, fysisk oordning, Google Street View,
SYSTEMATIC SOCIAL
OBSERVATION OF PHYSICAL
DISORDER IN INNER-CITY
URBAN NEIGHBORHOODS
THROUGH GOOGLE STREET
VIEW
THE CORRELATION BETWEEN VIRTUALLY
OBSERVED PHYSICAL DISORDER,
SELF-REPORTED DISORDER AND VICTIMIZATION
OF PROPERTY CRIMES
KARL KRONKVIST
Kronkvist, K. Systematic Social Observation of Physical Disorder in Inner-City Urban Neighborhoods through Google Street View. The Correlation between Virtually Observed Physical Disorder, Self-Reported Disorder and Victimization of Property Crimes. Degree project in Criminology 15 credits. Malmö
University: Faculty of health and society, Department of Criminology, 2013. The correlation of physical environment and crime has been an ever relevant topic in the criminological discourse. This study attempts to unravel whether physical disorder in inner-city urban neighborhoods may be studied through Google Street View as a virtual observational tool. The aims of the study is to examine whether virtually observed and self-reported perceived level of neighborhood disorder measure the same phenomenon, and whether virtually observed physical disorder may explain variations of self-reported victimization of property crimes. By conducting virtual observations of physical disorder in twenty inner-city neighborhoods of Malmö through Google Street View, the results of the study propose that virtually observed and self-reported perceived level of disorder is strongly correlated and thus seems to measure the same phenomenon to a great extent. The results of the study also imply that observed physical disorder through Google Street View also accounts for neighborhood differences in victimization of property crimes. The study concludes that virtual observation through Google Street View is a promising and potentially cost-effective alternative approach when auditing neighborhood physical disorder. The methodology does however suffer by limitations which is highlighted and thoroughly discussed.
Keywords: Google Street View, neighborhood, physical disorder, property crime,
ACKNOWLEDGEMENTS
I would like to express my outermost gratitude towards Prof. Robert Svensson who has supervised this thesis, contributed with valuable advice and commentary. You are a true source of inspiration. I also wish to thank Prof. Marie Torstensson
Levander for providing me with supplementary data which in turn made this
study achievable. I would also like to express my appreciation towards my fellow
students and colleagues at the department of criminology for inspiring and
encouraging my interest in the never ending fields of criminology. Finally, thank you Therese for your patience, love and support – it means the world to me.
CONTENTS
INTRODUCTION ... 6
Aims and research questions ... 7
Background ... 7
The neighborhood and crime ... 8
Disorder and crime ... 10
Systematic Social Observation ... 12
METHODS ... 15
Defining neighborhoods ... 15
Virtual Systematic Social Observation ... 16
Sample and street-loss ... 16
Virtual observation procedure ... 17
Community survey sample, loss and procedure ... 19
Measures ... 20
Virtual observation measures ... 20
Community survey measures ... 21
Analysis ... 22
Ethical considerations ... 22
RESULTS ... 24
Prevalence of physical disorder ... 24
Consistency of physical disorder ... 25
Observed physical disorder and self-reported social disorder ... 26
Observed physical disorder and victimization ... 28
DISCUSSION ... 30
Observed and self-reported disorder ... 30
Observed physical disorder and victimization ... 31
Limitations ... 32
Implications and further research ... 35
REFERENCES ... 36
INTRODUCTION
The correlation between the built environment and differences in level of crime rates has been a continuously relevant topic in the criminological discourse and subsequently a subject which has fascinated criminological scholars for almost a century. Despite the mutual interest of environmental effects on crime the debate has suffered by considerable controversies between scholars regarding
fundamental notions of what it is that causes crime. Perhaps variations in crime rates between neighborhoods might be explained through neighborhood poverty, residential mobility and population heterogeneity as proposed in the classical work of Shaw & McKay (1942/1969). Or maybe the answer lies within the
neighborhood residents and their sense of social cohesion, trust and willingness to intervene towards exhibited disturbances as proposed by Sampson and colleagues (1997). On the other hand, perhaps it is the social and physical disturbances per se which inherently causes higher levels of crime.
The nowadays familiar thesis of Broken Windows suggest that visual signs of disorder in a neighborhood have a causal effect on both higher levels as well as more severe types of crime in a community (Wilson & Kelling, 1982). This includes both social disorder, such as rowdy teenagers harassing local residents or passersby, and physical disorder, such as graffiti or similar types of vandalism on adjacent buildings. The relationship between neighborhood level of physical and social disorder in correlation to crime (e.g. Kelling & Coles, 1996 and Skogan, 1990) as well as fear of crime (Hunter, 1978; Skogan, 1986; Taylor, 1999) has been well documented. However, a controversy regarding the potential
tautological concern with explaining severe crime through minor crime has been raised (Gau & Pratt, 2008) as well as to what extent social and physical disorder have been measured in an reliable manner (Sampson & Raudenbush, 2004) and with adequate tools (Sampson & Raudenbush, 1999).
Deriving from the mentioned critique of Sampson & Raudenbush (1999; 2004) this study aims to explore to what extent physical disorder in inner-city urban neighborhoods might be measured through an alternative method, namely systematic social observations (henceforth referred to as SSO). However, unlike the conventional use of SSO where the field-observer pays a visit to the tangible setting of interest, this study intends to evaluate the possibility of auditing neighborhood level of physical disorder through a virtual observational tool. Google Street View is such a web-based observational tool with 360° panoramic street-level images captured by a “street view car” available through any Internet-linked computer (Google Maps, 2013a). Google Street View was introduced in the United States in May 2007 and Sweden in January 2009 and has since rapidly expanded to cover spatial areas in all seven continents (Google Maps, 2013b). Assessing neighborhood characteristics through Google Street View is a contemporary method which in recent publication has shown to be a reliable (Clarke et al, 2010; Rundle et al., 2011), cost-effective and time-saving (Badland et al., 2010; Ben-Joseph et al., 2012; Kelly et al., 2012; Odgers et al., 2012; Taylor et al., 2011) alternative approach towards auditing neighborhood features. The research on the topic of using web-based tools to assess neighborhood characteristics, such as physical disorder, is however limited. The majority of previous studies have either examined the accuracy and reliability between virtually and on-site observed neighborhood characteristics, including physical
disorder (Badland et al., 2010; Ben-Joseph et al., 2012; Clarke et al., 2010; Rundle et al., 2011; Taylor et al., 2011) or the inter-rater reliability between several virtual observers (Kelly et al., 2012). Only one study has however utilized virtual observations of physical disorder through Google Street View in a
criminological relevant purpose (Odgers et al., 2012). The aims of this study thus contribute to the discussion regarding the utilization of virtual observational tools to audit neighborhood characteristics through an innovative approach.
Aims and research questions
The primarily aim of the study is to examine whether observed physical disorder through Google Street View and self-reported level of perceived physical disorder in urban neighborhoods measures the same phenomenon. This is accomplished by completing virtual SSO of physical disorder through Google Street View in twenty inner-city urban neighborhoods in the city of Malmö, Sweden. The results of the observations are subsequently compared with data drawn from a larger community survey, consisting of self-reported levels of perceived physical disorder among respondents residing in the particular neighborhoods of interest. The primarily aim of the study results in the following research question:
Does observed physical disorder through Google Street View measure the same phenomenon as self-reported perceived physical disorder in inner-city urban neighborhoods?
Hypothesizing that visual cues of physical disorder observed through Google Street View is a mere reflection of the degree of social disorder in a
neighborhood, a secondary aim of the study is to examine whether observed physical disorder may explain differences in self-reported level of social disorder among inner-city neighborhoods. This aim results in the following research question:
Does observed physical disorder through Google Street View account for variations in self-reported perceived social disorder in inner-city urban neighborhoods?
The third and last aim of this study is to examine whether differences in observed physical disorder through Google Street View may explain variations of
victimization among residents in urban neighborhoods. This is examined through
comparing observed levels of physical disorder with self-reported victimization of property crimes through data from the above mentioned community survey:
Does observed physical disorder through Google Street View account for variations in victimization of property crimes among individuals residing in inner-city urban neighborhoods?
Background
The following subsection will provide a theoretical and empirical framework regarding neighborhood effects on crime through which the results of this study may be interpreted. This includes an extensive description of physical disorder and its theoretical linkage to crime. There will also be an introduction to the practices of SSO throughout recent decades as well as a thorough review of the research regarding auditing neighborhood characteristics using Google Street View (henceforth referred to as GSV).
An important clarification before moving on, however, is the definition of a key term in this study; the neighborhood. Robert Park (1916) proposed already in early twentieth-century that different parts of the city were reflecting the
“character and quality of its inhabitants” and a neighborhood was described as a “locality with sentiments, traditions, and a history of its own” (p. 579).
Elaborating Park’s point of view, Sampson and colleagues (2002) defined neighborhoods as “ecological units nested within successively larger
communities” (p. 445) consisting of people and institutions concentrated in a delimited spatial area (Sampson, 2006). This notion is coherent with the New Oxford American Dictionary (2010) where a neighborhood is defined as a “district, esp. one forming a community within a town or city”. Hence, based on the joint construction of the definitions presented above, a neighborhood is in this study defined as a geographically delimited area as part of larger census
communities compromising streets, buildings and open public spaces.
The neighborhood and crime
Although correlations of the physical environment and crime were recognized already during late nineteenth-century (see Davidson, 1981:71), the scientific approach towards explaining crime in relation to the social environment was founded through the so called Chicago school. Through the classical work of Burgess (1925/1984), the city of Chicago was divided into five concentric circles.1 The core consisted of the central business district which was
characterized by factories, business establishments, etc. The second circle was the “zone in transition”, where the expansion of the business district claimed space of the residential zone. The third circle represented blue-collar homes, or homes of the so called working class, while the forth circle contained white-collar homes. Finally, the outer circle – which Burgess (1925/1984:50) stressed to be “beyond the city limits” – consisted of the commuters zone (or suburban communities). Departing from the central business district, one would recognize differences between the zone closest to the core to have higher rates of illness, infant mortality and crime than zones further away from the core.
Social disorganization. Deriving from Burgess’ point of view, Shaw & McKay
(1942/1969) identified a strong correlation between neighborhood social
characteristics and differences in crime rates.2 These findings founded the social
disorganization theory, where social disorganization of a neighborhood proposed
to be caused by three main factors – namely high economic deprivation,
residential mobility and population ethnic heterogeneity – which in turn indicated a community’s inability to share common values and expectations as well as exercise informal social control (Kornhauser, 1978; Bursik, 1988; Sampson & Groves, 1989; Sampson, 1993).3 The zone in transition – which was characterized by low socioeconomic status, high population turnover and ethnic heterogeneity – thus became a distinctive example of an area characterized by social
1
The proposed model was however not exclusively limited to Chicago, since it was “an ideal construction of the tendencies of any town or city to expand radially from its central business district” (Burgess, 1925/1984:50).
2
It should however be noted that Bursik (1988) highlights that Shaw & McKay did not propose a “direct relationship between economic status and rates of delinquency” (p. 520), but rather how neighborhoods characterized by economic deprivation tended to produce and reproduce alternative subcultural values which in turn did not correspond with the conventional values of the society, and thus culturally transmittable to subgroups.
3 Sampson (1987) implies furthermore how family disruption is an equally important structural
disorganization. A meta-analysis by Pratt & Cullen (2005) accounting for approximately 200 empirical studies provides strong support to the social
disorganization theory since economic deprivation, population heterogeneity and family disruption was distinguished as both stable and highly significant
predictors of crime. Wikström (2007) provides a well-summarized view of the linkage between neighborhood social disorganization and variations in crime rates:
“Poorly functioning social institutions and a lack of common values among community residents result in poor informal social controls and defective
socialization, which in turn, causes high rates of offending by community residents (particularly young people).” (Wikström, 2007:339)
Collective efficacy. To further unravel the social mechanisms mediating
neighborhood differences in crime rates, Sampson and colleagues (1997) introduced the term of collective efficacy. If social disorganization represents a community’s inability to share common values and maintain informal social control, collective efficacy represent the exact opposite. Although emphasizing that economic deprivation, residential mobility, ethnic heterogeneity and family disruption in a community are important factors when explaining differences in crime rates, the mechanisms mediating these differences are more essential than the economic and population characteristics per se (see Sampson & Groves, 1989). The two main social mechanisms hypothesized to facilitate variations in neighborhood crime rates are social cohesion (i.e. the collective) and expectations of informal social control (i.e. the efficacy) (Sampson, 2012). Inspired by the techniques of psychological measurement, Raudenbush & Sampson (1999) introduced the term of “ecometrics”, a method through which the underlying social mechanisms of collective efficacy is considered to be assessed in a reliable manner. More explicitly, social cohesion is measured through a five item Likert-scaled index where respondents are asked if they perceive the neighborhood as (i) close-knit, if the residents in the neighborhood are (ii) helpful and (iii) can be trusted, as well as to what extent people in the neighborhood (iv) generally get along and (v) share the same values (see Sampson et al., 1997 and Raudenbush & Sampson, 1999). Informal social control is measured in a similar way, were the respondents are asked to consider if neighbors would do something about children (i) skipping school, (ii) spray-painting graffiti or (iii) acting disrespectful towards an adult, as well as (iv) if someone is being beaten outside their home or (v) if the local fire station was threatened with budget cuts (Ibid.).
Although the degree of social cohesion and informal social control in a community is expected to account for variations in neighborhood crime rates, stipulated in a vast amount of research (Sampson et al., 1997; Sampson et al., 1999; Morenoff et al., 2001; Sampson & Wikström, 2008),4 it is also proposed to explain variations in local physical and social disorder (Sampson & Raudenbush, 1999). This is however a notion which has originated controversies among scholars since the role of disorder might not merely be a result of deficient neighborhood collective efficacy, but rather a phenomenon which intrinsically causes further crime.
4 In the mentioned meta-analysis of macro-level predictors on crime by Pratt & Cullen (2005) the
theory of collective efficacy fares very well and predicts levels of crime to a greater extent than more conventional explanatory variables such as race, family disruption, poverty, unemployment, and so forth.
Disorder and crime
James Q. Wilson and George L. Kelling wrote during the early 1980’s a striking article in the cultural commentary magazine The Atlantic Monthly which would have great impact in the criminological discourse as well as on the crime-policing agenda. Arguing for disorder in urban neighborhoods as an essential part of the causal linkage to crime they illustrated their notion of Broken Windows by stating:
“Social psychologists and police officers tend to agree that if a window in a building is broken and is left unrepaired, all the rest of the windows will soon be broken. /…/ Window-breaking does not necessarily occur on a large scale because some areas are inhabited by determined window-breakers whereas others are populated by window-lovers; rather, one unrepaired broken window is a signal that no one cares, and so breaking more windows costs nothing.” (Wilson & Kelling, 1982:32)
The fundamental idea of the theory is thus that signs of physical disorder in a neighborhood, such as a broken window, invite further windows of the buildings in the neighborhood to be shattered. Unless minor mischiefs are handled
immediately, the first broken window will in the long run result in total decay of the building. According to Wilson & Kelling (1982) this was however not limited to vandalism, but rather all types of disorder, and not only the decay of a worn-out building, but rather the decline of a whole neighborhood.
Defining disorder. The overarching concept of disorder is typically divided into
two subgroups of social and physical disorder, with the two sharing the
characteristics of being “incivility, boorish and threatening behavior that disturbs life” (Kelling & Coles, 1996:14). Skogan (1990) defines social disorder as behaviors which one might be able to observe while happening, e.g. people drinking alcohol, loitering or fighting in public spaces, while physical disorder is defined as litter or garbage strewn along the neighborhood streets or signs of vandalism such as broken street-lights. Unfortunately Skogan’s (1990) differentiation of social and physical disorder is not coherent and gets rather contradictory when proposing graffiti to be social disorder. Although suggesting that social disorder is something observable, an act being carried out, it may also according to Skogan (1990:4) contain “direct evidence of it”, such as graffiti. However, it is to my belief that most types of physical disorder are the result of social disorder. Litter along the street may be the result of people loitering, empty bottles of alcohol are evidence of people drinking in public spaces, while graffiti is a consequence of unsupervised groups of youths roaming the neighborhood streets. The bottom line when defining disorder is however that physical and social disorder are similar concepts, which on the one hand should be viewed separately, but simultaneously considered as dependent of one another.
By summarizing the theoretical framework of the disorder-crime causal process, unattended visual cues of disorder signals an absence of social control which in turn attracts deviant groups of people since no one seems to care about the events taking place in the neighborhood. The law abiding citizens either moves out of the area or refrain from entering public spaces, which further lowers the social
control, engaging the neighborhood in a vicious circle of disorder, decay and higher levels of severe crime (as illustrated in Figure 1 inspired by Wilson & Kelling, 1982; Kelling & Coles, 1996; Skogan, 1990).
Figure 1 Illustration of the hypothesized disorder-crime nexus.
Source: adapted from Hinkle (2009:12) and emphasized by Mellgren (2011:28).
Perceiving disorder. Traditionally, neighborhood level of physical and social
disorder is measured through self-reported perceived level of disorder where the respondents are asked to estimate the prevalence or frequency of a certain problem (e.g. Skogan, 1990; Sampson & Raudenbush, 2004; Wikström et al., 2012). However, by assuming a causal relationship between neighborhood level of disorder and levels of severe crime there might be a complication in relying on subjective perceptions of self-reported data to obtain a comprehensive description. Sampson & Raudenbush (2004) points out that the perception of neighborhood level of disorder in self-reported data is strongly dependent of structural
characteristics, such as the racial and economic composition of the neighborhood population (see also Vanclusen et al., 2011). Franzini and colleagues (2008) report similar results in a study which replicates large parts of Sampson and
Raudenbush’s methods. Although the perception of disorder among respondents in their Baltimore study is reflecting level of observed disorder in the
neighborhood, it is preferably cues of long-lasting decay such as the deterioration of buildings and open public spaces, which affect the perception of disorder rather than litter or graffiti. The results do however also verify the effect of structural characteristics, i.e. economic disadvantages, on the perception of disorder in a neighborhood (Franzini et al., 2008). Another important issue when considering perception of disorder is that respondents fearful of crime generally report higher levels of disorder than less fearful respondents despite residing in the same neighborhood (Perkins et al., 1992; see also Sampson & Raudenbush, 1999:606). In addition, research has shown that individuals reporting to be fearful of crime generally have been previously victimized (Skogan, 1987) although the results are mixed (see Hale, 1996:104).
If stigmatizations of particular neighborhoods or personal experiences among the residents affect the perception of neighborhood disorder among respondents residing in the area, research which utilizes self-reported data to imply correlations between disorder and victimization (or fear of crime) should be interpreted with caution. Scholars have however argued that perceived and actual disorder are two separate concepts (e.g. Sampson & Raudenbush, 1999) and how it thus is important to separate the hypothesized underlying mechanism proposed in the disorder-crime nexus of Broken Windows. In other words, it isn’t the actual level of disorder which causes crime but rather when it is perceived by the
inhabitants of a neighborhood since “disorder should cause crime only when residents of the disordered community interpret signs of disorder to mean that the community is devoid of social control” (Gau & Pratt, 2008:165). Hence, if the inhabitants of a neighborhood wouldn’t perceive disorder, they wouldn’t retreat from the public spaces and subsequently lower the social control of the
neighborhood. Despite the proposed mechanism, Gau & Pratt (2008) highlights that respondents might not be able to clearly distinguish between disorder and crime, which is a fundamental notion of Broken Windows. If so, the overarching notion of Broken Windows becomes tautological since (severe) crime is explained by (minor) crime (Gau & Pratt, 2008:182; see also Sampson & Raudenbush, 1999:608). Social and physical disorder Indicates low social control Attracts deviant groups of people Higher rates of crime
Systematic Social Observation
In contrast to the conventional manner of measuring neighborhood level of disorder – that is through self-reported perceptions of disorder, this study has utilized SSO to audit level of neighborhood physical disorder. Although auditing environmental characteristics through observations of the physical milieu was performed already by the early Chicagoans, it was through Albert J. Reiss Jr. (1971) the method received a boost and was reintroduced in the fields of social sciences. By systematic observations, Reiss (1971:4) highlighted the importance of structured observations which included recordings and procedures which followed specific rules and allowed replication. Sampson & Raudenbush (1999) contributed largely to the methodological (and theoretical) discourse by
conducting observations of Chicago neighborhoods, which included both field-observations and videotaping of eighty neighborhood clusters. The results of their large-scaled observations revealed that survey physical disorder and observed physical disorder were significantly correlated. Although observed disorder explained differences in neighborhood-level victimization (when analyzed singlehandedly) the correlation became insignificant when controlling for neighborhood level of collective efficacy. The concluding remarks of the study thus implied that the correlation between neighborhood disorder and crime rates suggested by the Broken Windows perspective was spurious and the two were rather a result of the same underlying social mechanism, i.e. collective efficacy.5
Auditing neighborhood characteristics through Google Street View. Although
the use of SSO to audit neighborhood characteristics in relation to perception of disorder (Franzini et al., 2008; Sampson & Raudenbush, 2004), crime (Sampson & Raudenbush, 1999; Wei et al., 2005), community-based intervention outcomes (Harvey et al., 2013) and health-related issues (Cohen et al., 2000) has escalated during recent decades, modern technology has allowed for innovative ways of using web-based tools to audit neighborhood characteristics (Badland et al., 2010; Ben-Joseph et al., 2012; Clarke et al., 2010; Kelly et al., 2012; Odgers et al., 2012; Rundle et al., 2011; Taylor et al., 2011). Sampson (2013) mentions in his presidential address to the American society of criminology that visually assessing settings is a prevailing trend in criminological research. He points out that
“Google Street View can be and is being used systematically to code a variety of urban street scenes, right down to the level of specific places” (Sampson, 2013:9). Since GSV became available in the United States in 2007 it has despite its
potential as a virtual observational tool been utilized and evaluated to a rather moderate extent in scientific research. Curtis et al. (2010) partially initiated the use of GSV in research by exploring the spatial recovery of New Orleans neighborhoods post hurricane Katrina by using GSV as an additional source of information to measure neighborhood reconstruction and quality. Deriving from this study, the contemporary research regarding utilization of GSV has
predominantly aimed to assess the reliability of the instrument as an observational tool, especially in the field of medicine, while the amount of research in the social sciences is rather limited. By comparing virtual and on-site observations Badland and colleagues (2010) emphasizes that GSV is a time-saving method when
5 It should however be noted that the results of this study has not passed unquestioned. Gault &
Silver (2008) points out that Sampson and Raudenbush assumed an over-simplified theoretical construction of Broken Windows which in turn led to misinterpretation of their results. They propose that the results might point toward mediation of disorder on crime rather than
conducting virtual audits in contrast to on-site observations. They also concludes that acceptable levels of reliability agreement between virtual and on-site
observations among the majority of the studied items were obtained, as well as a massive economic benefit when using virtual audits; on-site observations was estimated to cost roughly sixteen times the amount of virtual observations (Badland et al., 2010). Similar evaluations of utilizing virtual rather than on-site observations highlights that GSV is both a cost-effective and time-saving (Ben-Joseph et al., 2012; Kelly et al., 2012; Taylor et al., 2011) as well as a reliable (Clarke et al., 2010; Rundle et al., 2011) alternative to audit neighborhood characteristics.
Although there seems to be an interest of assessing neighborhood characteristics through virtual observations, the actual use of virtual observations of
neighborhood characteristics through GSV has to present date only been carried out in one criminological relevant study. By conducting virtual observations of neighborhoods consisting of families of the Environmental Risk Longitudinal Twin Study, Odgers and colleagues (2012) examines whether the physical environment of neighborhood condition influences the development of antisocial behavior and health-related problems among more than two thousand children. The results show, among other things, that high levels of physical disorder in the neighborhood are positively correlated to the development of antisocial behavior (r = .11 p < .01). It is also reported that virtually observed and self-reported physical disorder are correlated (r = .37 p < .01) and that virtual observations through GSV is a “reliable and cost effective tool for gathering information about local neighborhoods” (Odgers et al., 2012:1015).
However, a most relevant issue in prior research evaluating the utilization of GSV to audit neighborhood characteristics is the inconsistency between on-site and virtual observational agreement of physical disorder. It has been pointed out that “micro-scaled features” such as garbage, litter or broken glass are difficult to observe when using GSV which in turn results in low observer agreement of items regarding physical disorder in prior studies of on-site and virtual observations (Clarke et al., 2010; Rundle et al., 2011; Taylor et al., 2011). This is perhaps not an unexpected result since the GSV pictures are taken during a certain time of the day which could influence the amount of litter being present along the streets during the virtual observation. For instance, Rundle et al. (2011) reports that the street view images of inner-city New York appeared to be captured in the early morning hours to avoid heavy traffic. This was in turn proposed as an explanation of the amount of litter present along the virtually observed city streets. However, a recent evaluation of the accuracy of three web-based auditing tools reveals that GSV was the most useful virtual tool to audit smaller features (Ben-Joseph et al., 2012) which makes this tool the most appropriate instrument for the study at hand. A more troubling issue however is the mixed results of inter-rater reliability of physical disorder. Assessing quality of environment, including e.g. amount of litter, using GSV has proven to suffer from low consistency among virtual observers (Kelly et al., 2012), which however aren’t coherent with the study by Odgers et al. (2012) where items such as litter, graffiti and other signs of disorder has quite high levels of observer agreement. Despite the mixed results and the somewhat treacherous reliability of inter-rater agreement, this mustn’t necessarily be viewed as a major limitation of the study at hand since the observations has
been carried out by a single observer, which in turn minimizes the potential error of several (potentially) subjective observers.
By summing up the chapter, the somewhat disorganized discussion regarding Broken Windows, the underlying social mechanisms and perceived contra actual level of neighborhood disorder might to some extent be clarified through this study. If virtually observed and self-reported level of physical disorder in a neighborhood measures the same phenomenon, this may contribute largely to the methodological and theoretical discourse regarding the disorder-crime nexus. The study at hand will also be able to evaluate the potential efficiency of auditing neighborhood physical disorder through virtual observations. Despite a unanimous consensus of the literature regarding GSV as cost-effective, time-saving and to some extent reliable methodological alternative towards auditing neighborhood characteristics, the results of auditing fine-grained items such as litter or graffiti are rather mixed.
METHODS
This chapter will discuss the methods of the study, which includes the procedures of both the SSO through GSV as well as the data comprehended through the community survey. There will also be a clear description of the different measures which are used in this study as well as the different types of analyzes which are applied to give an adequate answer to the research questions at hand. First of all however, there will be a short description of the two sets of data utilized in this study.
The empirical foundation of this study is as mentioned two-folded. First, and the primarily set of data, is gathered through a SSO of physical disorder through GSV in twenty inner-city neighborhoods of Malmö, Sweden. Secondly, in an attempt to examine whether observed neighborhood physical disorder through GSV actually measures the same phenomenon as self-reported level of neighborhood disorder, the second set of data applied in this study consists of a subsample of information from a community survey. The material drawn from this larger set of data
includes perceived physical disorder in the respondents’ neighborhood as well as self-reported victimization of property crimes during the last twelve months. The two sets of data utilized in this study will be discussed more thoroughly below.
Defining neighborhoods
The areas of interest in this study are census defined neighborhoods, which are smaller spatial areas of ten larger census tracts in Malmö, set by the local
municipality. The average population of each census neighborhood is nearly three thousand inhabitants,6 which divides the total population of Malmö in
approximately one hundred census neighborhoods. In this study, two inner-city census tracts consisting of twenty census defined neighborhoods were selected.7 Although the majority of the neighborhoods have natural boundaries separating them from each other (such as larger roads, railroads, parks and industrial
grounds) and thus making them observable by looking from the outside and in, the neighborhood limits are not necessarily obvious to its inhabitants. Sampson (2006) highlights this as a common issue in existing neighborhood research and propose that statistical neighborhoods defined by authorities, i.e. police or school districts and census based communities, “offer imperfect operational definitions of neighborhoods for research and policy” (p. 33). However, the preconditions of the secondary data of this study, which contains the comparable measures of self-reported disorder and victimization, are set and the possibility to retrospectively scale down to smaller areas of analysis is not an option. The use of the census
6 The neighborhoods are reaching from smaller, with only a few hundred residents, to larger and
far more densely populated neighborhoods with up to several thousand residents.
7
Originally the two census tracts consist of twenty-one neighborhoods. However, one neighborhood is characterized by a greater hospital area while the residential structures are concentrated in the most southeastern part of the neighborhood. Merely seven percent of the neighborhood area is entailing residential buildings, while the remaining majority of the neighborhood is characterized by health-care or similar institutional structures. The residents of this area are most likely more interrelated to the adjacent census neighborhood than to the hospital area per se. On this basis, the neighborhood concerned has been excluded from the analyzes in this study. Ruling out this specific neighborhood does however not imply any discernible differences to the results of the study at hand, whereas should rather be viewed as a precautionary measure to ensure high reliability of the study.
defined neighborhoods applied in this study have been proven to be a feasible way of defining neighborhoods in the city of Malmö (Lögdberg et al., 2004; Mellgren et al., 2010a; Mellgren et al., 2010b) and the neighborhood population is similar to prior neighborhood research in a Swedish context (see Sampson & Wikström, 2008 and Wikström & Dolmén, 2001).
Virtual Systematic Social Observation
As highlighted, the peculiar feature of the primary set of data in this study is through which it has been gathered. Modern technology has allowed for advanced methods in the field of social sciences, for instance by using web-based
instruments to audit various characteristics in spatial areas. In this section there will be a clarification of the sample and loss of streets, as well as a thorough review of the procedures regarding the virtual SSO.
Sample and street-loss
Every street in each census neighborhood was handpicked, using an interactive online-map8 provided by the city of Malmö, which resulted in a total sample of 407 streets. The streets of the original sample were however required to be
available (i.e. observable) through GSV. A noticeable proportion of the originally sampled streets, that is approximately twenty percent, were not available through GSV due to various reasons (see Table 1).
Table 1 Sampled streets and street-loss.
n %
Original sample 407 100.0
Street-loss 75 18.4
Pedestrian or bicycle lane 37 9.1
Under construction 12 2.9
Industrial road 5 1.2
Not available 20 4.9
Other 1 0.3
Final sample 332 81.6
Street-loss due to unavailability of street view images is an apparent limitation when using GSV as an auditing tool and has been highlighted in prior research (Ben-Joseph et al., 2012; Clarke et al., 2010). Rundle et al. (2011) reports the exclusion of one block segment in New York City due to unavailability of street view, while Odgers et al. (2012) points out that ninety-four percent of the sampled neighborhoods were accessible through GSV. In relation to these results the final sample of streets available through GSV in this study, that is approximately eighty percent, might be viewed as quite questionable. However, when analyzing the street-loss on neighborhood level, only four neighborhoods has a loss over twenty percent, while ten neighborhoods (i.e. half) has a loss under five percent and six neighborhoods a loss between five and fifteen percent. There are two
neighborhoods which percentage of street-loss contributes considerably to the total loss, these two are however also the largest neighborhoods consisting of the definitely highest number of streets. In addition, Kelly et al. (2012) reports a street-loss of twenty-eight percent of their total sample of streets due to unavailability in street view which is similar to the total loss of this study.
In conclusion, a large proportion of the streets originally sampled in this study were also available for observation through GSV. Only five percent of the originally sampled streets were not available in street view due to inexplicable reasons, while the remaining majority of street-loss either was as a result of pedestrian or bicycle lanes which restricted the use of motor vehicles, or since the streets were under construction while the street view pictures were captured.
Virtual observation procedure
The SSO was conducted through a virtual walk down each digitally available street in all of the twenty neighborhoods during April 2013. Table 2 gives a structural description of the streets and neighborhoods sampled and subsequently virtually observed in this study.
Table 2 Structural description of the observed neighborhoods (N=20).
Mean Min Max SD Total
Number of streets (n) 17 5 43 9 332
Length of streets (m) 282 37 1222 227 93579
Neighborhood area (km2) 411 103 2167 451 8226 Note: n = number, m = meter, km2 = sq. kilometers
The average number of streets in each observed neighborhood was seventeen, ranging from five to forty-three. The average length of the streets was
approximately three hundred meters, and the average neighborhood spatial area was measured to roughly four hundred square kilometers. The GSV captures were predominantly taken in July or September 2011 (93.7 %) while only a fraction of the captures were taken in June or July 2009 (3.0 %) or in July 2012 (3.3 %). A time-interval measure of approximately ten percent of the observed streets was conducted to obtain an average observational time of six minutes per street. This indicates beyond thirty hours of virtual observing.
As the observer virtually walked down each street, an online inventory checklist was simultaneously completed to evaluate each street. The neighborhood audit checklist used in this study was inspired by the SSO i-Tour by Odgers et al. (2009) regarding items of physical disorder, as well as features of the streets, sidewalks, buildings and open public spaces. The SSO i-Tour was intentionally designed to be used when virtually observing neighborhood characteristics
through GSV (Odgers et al., 2009). However, to further broaden the observational items in the checklist at hand, items of physical disorder from the
field-observation scheme by Raudenbush & Sampson (1999:15) were integrated in the checklist at hand.
Despite the fundamental work of Odgers et al. (2009) and Raudenbush &
Sampson (1999) to generate reliable observational schemes, the checklist used in this study needed to be revised in regards to cultural-adaptation and the
preconditions of using GSV.9 By completing several test-runs in a small sample of randomly selected streets in the inner-city of Malmö, some important inquiries regarding the design of the neighborhood checklist was discovered. For instance,
9 Cultural-adaptation of research strategies is an important step in ensuring high reliability of a
specific method and might as well have an impact on the results. This is particularly a hot topic when discussing early in life intervention-strategies (e.g. Kumpfer et al., 2002 and Castro et al., 2004) but should likewise be considered when designing an instrument of neighborhood audit.
the SSO i-Tour asks the observers whether graffiti is present on buildings, signs or walls (Odgers et al., 2009:7). The test-run revealed that graffiti is a very common phenomenon along the city streets of Malmö, but however varying in size, frequency and intensity. Thus it is rather appropriate to ensure whether it is small or large graffiti which is present, similar to the differentiation of graffiti made by Raudenbush & Sampson (1999:15). Another sign of disorder measured in prior observational research have been the presence of abandoned, stripped or run down cars. Since this was expected to be observed to a very limited extent (i.e.
completely absent), the presence of stripped or abandoned bicycles were replacing this item.
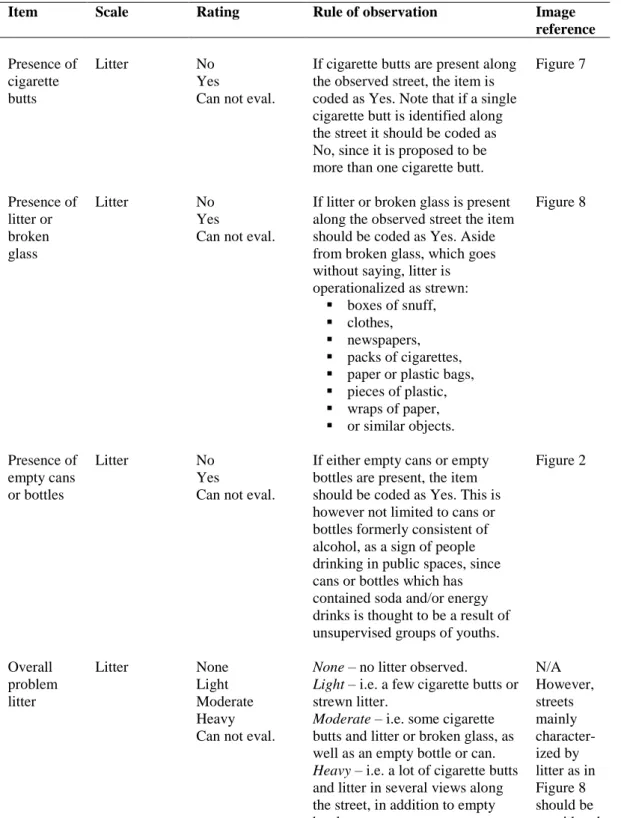
The virtual ride along each observed street was conducted using the Internet-based Google Maps application of GSV (see http://maps.google.com).10 The procedure of the observations was subsequently two-folded. First, the observer rode down the street at hand to evaluate the presence of physical disorder which included the presence of cigarette butts, litter or broken glass, empty cans or
bottles, abandoned or stripped bicycles along the street, pavement or sidewalk
(yes or no). In addition the observer evaluated if small graffiti, large graffiti, and
graffiti painted over were present on the buildings, signs or posts along the street
(yes or no).11
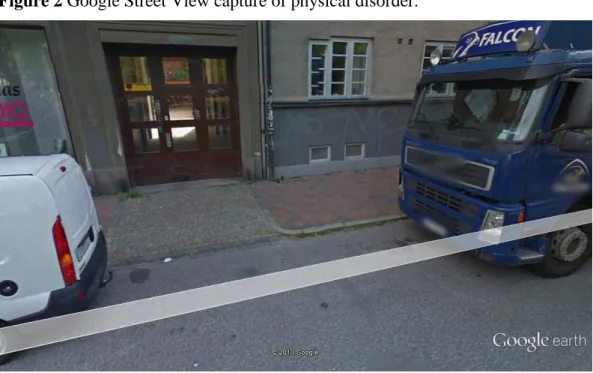
Figure 2 Google Street View capture of physical disorder.
© 2013 Google
Note: Google Street View capture of small graffiti (on the building doors), graffiti painted over (on the right hand side wall), cans or empty bottles (by the foot of the drainpipe) and litter or
broken glass (along the curb).
10
GSV is also accessible through a free software version of Google Earth and the paid version of Google Earth Pro. However, in writing, the lack of zooming possibility while in street view in either of these two software versions made the Internet-based version of GSV the best alternative, since distinguishing for instance cigarette butts and similar small objects of interest is limited without this function. Further, to prevent possible errors, such as misperceive leaves as cigarette butts or empty cans for litter, the observations were conducted through a high-definition forty inch screen.
11
The option of can not evaluate was an alternative rating when assessing each item, however, this was only applied in one case (one street of assessing presence of cigarette butts) and was thus subsequently coded as not present.
The observer were then asked to rate the overall problem with cigarette butts, litter or broken glass, empty cans or bottles along the street, as well as with small graffiti, large graffiti and graffiti painted over (none, light, moderate or heavy). Secondly, the observer turned back to re-ride the street, verifying the presence and overall problem of physical disorder as well as assessing physical decay,
including condition of the street, the sidewalk, adjacent buildings and open public spaces (rated as good, fair or poor).12 Figure 2 gives an illustrative example of a view where several signs of physical disorder are captured in one take. (For a thorough review of the items used from the neighborhood audit checklist in this study, see the Appendix.)
Community survey sample, loss and procedure
To evaluate whether observed physical disorder measures the same phenomenon as self-reported perceived level of disorder, and whether observed disorder may explain differences in victimization, the study utilizes a subsample of a larger community survey carried out in the city of Malmö. The community survey is a collaboration between local agencies (Malmö University, the City of Malmö, Malmö Policing Area and Emergency Services South) and is intended to chart differences in neighborhood disorder, victimization and fear of crime.
Approximately eight thousand respondents were randomly selected to participate in the community survey, representing the original sample. Respondents were in fact sampled on neighborhood level, were the sampled number of respondents representing each neighborhood was set by the number of inhabitants between eighteen and eighty-five years of age residing in the particular neighborhood. The smallest neighborhoods consisting of one hundred to one thousand inhabitants was represented by a sample of forty respondents while the largest neighborhoods, with beyond six and a half thousand residents, was represented by one hundred and sixty respondents. The sample in neighborhoods between the smallest and largest was subsequently increasing stepwise from forty to one hundred and sixty respondents.
The postal-survey was distributed in November 2012 and followed up by two reminders to respondents which hadn’t returned their questionnaire within a specified timeframe. The questionnaire contained an informative letter were the purpose of the study was stated, how participation of the study was voluntary and that answers were held confidential. It was also clarified that by returning the questionnaire to the research team, the respondents gave their informed consent to participate in the study. A smaller crew consisting of students and project
assistants at the department of Criminology of Malmö University were
subsequently coding the questionnaires. The number of encoders was held to a minimum to reduce the potential amount of error in coding.
After excluding respondents which through information was found expatriated or deceased from the initial sample, the total response rate of the community survey is approximately fifty-five percent. The overall response rate of the two inner-city census tracts, comprehending the twenty neighborhoods of this study, was slightly below the average percentage of all ten census tracts. Although this might be viewed as a quite noticeable loss of respondents, a trend of declining interest
12 Although physical decay (such as the condition of street-segments and public open spaces) was
among respondents to participate in similar community surveys can be distinguished during recent years. For instance, participation in the yearly recurring Swedish Crime Survey has dropped with approximately ten percent during the last six years (Brå, 2013; see also Brå, 2012). Another survey carried out in a single census tract of Malmö resulted in a response rate of roughly fifty percent (Mellgren & Kronkvist, 2013). This is however not a trend limited to Sweden, for instance a similar community survey carried out by Oberwittler (2004) in Germany resulted in a response rate of forty-nine percent and Wikström et al. (2012) reports a response rate of fifty-three percent in a comparable
community survey conducted in the UK.
According to Raudenbush & Sampson (1999) a sample of twenty to thirty
respondents per neighborhood is an adequate number to yield reliable measures of neighborhood level mechanisms. Accordingly the response rate of the community survey at hand in relation to the overall trend of decreasing response rates in both national and international research, as well as with an average number of forty responses per neighborhood, might be viewed as a satisfactory result. The number of respondents representing the neighborhoods of this study is approximately twenty percent of the overall community survey participants (N = 860).
Measures
The following section will present the measures used in this study. First there will be a short presentation of the measures of physical disorder produced through the virtual observation of streets in each census neighborhood. Secondly, there will be a description of the different measures of self-reported perceived physical and social disorder as well as victimization.
Virtual observation measures
Deriving from the measures employed by Sampson & Raudenbush (1999) the operationalization of observed physical disorder in this study includes a
classification of two main types of physical disorder, namely litter and vandalism. However, to broaden the measure from the mere presence of e.g. cigarette butts or small graffiti, the operationalization of observed physical disorder in this study adds another dimension by a qualitative assessment of the overall level of litter and vandalism along the street (inspired by Odgers et al., 2009; 2012).
Table 3 Measures of observed physical disorder in various studies.
Sampson & Raudenbush (1999) Odgers et al. (2012) This study L itter
Cigarettes or cigars Garbage or litter Cigarette butts
Garbage or litter Litter or broken glass
Empty beer bottles Empty cans or bottles
Condoms Heavy litter
Needles/syringes
Van
d
alis
m Tagging graffiti Graffiti Small graffiti
Graffiti painted over Graffiti painted over Large graffiti Gang graffiti Abandoned or burned out cars Graffiti painted over
Political message graffiti Vandalized/faded signs Abandoned or stripped bicycles
Abandoned cars Heavy vandalism
Table 3 gives an illustration of the items which has been used in prior research to assess neighborhood level of disorder, in relation to the two measures of physical disorder utilized in this study.13
The measure of physical disorder in this study is thus a combined index of litter and vandalism. The measure of litter is consisting of four items, namely the presence of cigarette butts, litter or broken glass and empty cans or bottles (coded as no = 0 and yes = 1) and the overall amount of litter (coded as none, light,
moderate = 0 and heavy = 1) along the observed street. The combined measure of
vandalism is consisting of the presence of small graffiti, large graffiti, graffiti painted over and abandoned or stripped bicycles (coded as no = 0 and yes = 1) and the overall level of vandalism (coded as none, light, moderate = 0 and heavy = 1) along the adjacent buildings, signs or posts of the observed street.
The physical disorder index was produced by combining the measures of litter and vandalism as described above. The index ranges from zero to nine, where zero represents total absence of any litter or vandalism, and nine represent presence of all items along the observed street. The internal consistency of the street-level index according to Cronbach’s Alpha (Cronbach, 1951) may be viewed as poor (α = .58) since prior research has proposed α = .70 as an adequate level of internal consistency (see discussion of interpreting Alpha by Schmitt, 1996). Despite the rather unexpectedly low Alpha, the theoretical operationalization of physical disorder applied in this study exceeds the Alpha value of internal consistency. By theorizing that the presence of litter, cigarette butts, graffiti, etc. along the streets and adjacent buildings characterizes physical disorder, the theoretical point of view is accordingly regarded as more important than a high street-level Alpha value.14
Community survey measures
The self-reported measures of disorder applied in the survey have in similar design been utilized in several studies and proven to be an efficient and reliable way of measuring perceived level of disorder (Skogan, 1990; Perkins & Taylor, 1996; Sampson & Raudenbush, 1999; Wikström et al., 1997; Xu et al., 2005; Wikström et al., 2012). To measure self-reported level of perceived physical disorder, the respondents were asked to consider whether they experienced any of the following to be a problem in their neighborhood (including adjacent to their house and within a few minutes walking distance from the residence):
Litter along the streets and in open public places
Damages to surrounding buildings or in open public places (eg. graffiti or broken street lights)
13 The differentiation of litter and vandalism as illustrated in Table 3 is however not clarified by
either Sampson & Raudenbush (1999) nor Odgers et al. (2012). The separation above is made to illustrate the resemblance between the nine items of this study in comparison to prior research.
14 Jones & Norrander (1996) highlights an important and most relevant issue when measuring
aggregated level of reliability and internal consistency. They emphasize that measuring internal consistency on individual level (or as in this study street-level) when intending to utilize
aggregated data may be inappropriate, since the most suitable method to assess aggregate level of reliability is at the aggregate level (Jones & Norrander, 1996:299). Their suggestion is based on the fundamental notion of O’Brien (1990) who provides an alternative design when assessing aggregated level reliability. Although this design has not been applied in this study, the discussion held by Jones & Norrander (1996) and O’Brien (1990) has been duly noted.
The options of response were not a problem (coded as 0), somewhat of a problem (1) or a big problem (2). These two questions were combined into a joint physical disorder index ranging from zero to four with an adequate internal consistency (α = .71).
To measure the potential correlation between observed physical disorder and self-reported perceived social disorder, the respondents were asked whether any of the following was perceived as a problem in their neighborhood:
Intoxicated people
Groups of unruly youths disrupting order People arguing and fighting
The options of response and coding were the same as with physical disorder and the internal consistency was of an adequate level (α = .70). The indexes of
physical and social disorder where subsequently aggregated to neighborhood level to provide a mean of physical and social disorder.
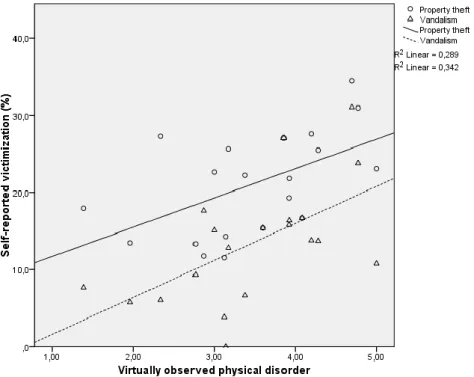
To answer the final research question of the study, two measures of property crime victimization was produced. The respondents were asked whether they during the last twelve months had been a victim of property theft or vandalism. The set responses were no, yes, once and yes, more than once and coded dichotomously as either victimized or not. The data was aggregated to
neighborhood level to receive a percentage of respondents victimized for either property theft or vandalism in each census neighborhood during the last twelve months.
Analysis
As indicated above, Cronbach’s Alpha has been used to measure the internal consistency of the combined indexes constituting the measures of disorder. To examine the correlation of observed and self-reported levels of neighborhood disorder, as well as victimization of property crimes, bivariate linear regressions of the measures were conducted. To further elucidate the correlation between the different measures, scatter-plots illustrating the relationships were produced. The results presented in this study are in relation to established margins of statistical significance at the level of 95% confidence interval (p < 0.05). All analyzes were conducted through IBM SPSS Statistics 20.
Ethical considerations
Ethical concerns regarding the use of GSV as a virtual observation tool has been raised. Google has been criticized for invasion of privacy since street view pictures may contain both people and property, which have been captured and subsequently made worldwide available through Google Earth, without the informed consent of individuals or the property holders visually captured. Google has however reacted to the criticism by blurring faces of pedestrians and passers-by as well as license plates of vehicles in street view (Google Maps, 2013c). In addition to the automatic blurring of faces and license plates, the possibility for users to further blur themselves, a family member or their property (i.e. car or residence) is easily provided in street view. To contribute to the assurance of privacy of street view images, the observer of this study reported any
A common ethical issue when conducting neighborhood research is the impact the results may have on the inhabitants residing in the studied areas. Mellgren (2011) highlights how ethical guidelines when conducting neighborhood level research are rather unclear and in turn somewhat neglected. She emphasizes her obligations as a researcher when conducting neighborhood level research with aggregated self-reported data of victimization and reactions to crime:
“To take one example, the city of Malmö had approximately 250,000 inhabitants in 1998, and the survey employed /…/ includes a sample of approximately 4,000 inhabitants, which amounts to 1.6 percent of the population. By completing the questionnaire, these 4,000 individuals consented to participate /…/. If the survey is then used to study neighbourhood effects and presents information that might risk labelling neighbourhoods with certain characteristics as dangerous places, what then is my responsibility towards the 98.4 percent who were not given the
opportunity to consent to their neighbourhood collective properties being studied?” (Mellgren, 2011:58)
The quote above illustrates a very important ethical concern in neighborhood research. Although this is an issue that must be considered, it must not necessarily imply a major concern in the study at hand. In this study, where is not as
interesting as what. In other words, although the observations of physical disorder are conducted in two inner-city census tracts of Malmö, there is no need to
explicitly label the specific neighborhoods observed. The matter of interest (the
what) is accordingly if observed physical disorder measures the same
phenomenon as self-reported perceived level of disorder by comparing
neighborhoods (with no need of an explicit where). The observation of physical disorder conducted in this study does not aim to offer a generalized reality of the level of physical disorder in either Malmö or the two census tracts containing the studied neighborhoods. It should rather be viewed as a cross-sectional measure of physical disorder at the time of the virtual observations.
RESULTS
The following chapter will present the major findings of this study. The chapter starts out with a descriptive subsection where the prevalence of different types of physical disorder is illustrated, followed by a section where the consistency between virtually observed and self-reported levels of physical disorder is discussed. Furthermore the correlation between observed physical disorder and self-reported level of social disorder is examined. The chapter concludes by examining the potential correlation between, and explanatory power of, physical disorder in relation to victimization of property crime.
Prevalence of physical disorder
The summarized result of the observed inner-city streets in this study shows quite high prevalence of physical disorder. Both litter or broken glass as wells as smaller graffiti (such as tags) were present along approximately four of every five streets, while cigarette butts were observed along three quarters of all streets. Just under half of the streets had signs of larger types of graffiti, while approximately every forth and every fifth street contained graffiti which had been painted over or empty cans or bottles. Abandoned or stripped bicycles were observed to a limited extent and only present in about eight percent of all observed streets (see Table 4).
Table 4 Street-level observed litter and vandalism in order of prevalence (N=332).
Prevalence SSO
n %
Litter or broken glass 279 84.0
Graffiti small 273 82.2
Cigarette butts 251 75.6
Graffiti large 143 43.1
Graffiti painted over 83 25.0 Empty cans or bottles 63 19.0 Abandoned or stripped bicycles 26 7.8
Despite the rather vastly observed prevalence of physical disorder, the qualitative judgment of the overall problem with litter and vandalism provides another perspective. The overall problem along the majority of the streets were assessed as either none (litter = 7.5 %, vandalism = 13.3 %) or light (litter = 54.5 %, vandalism = 49.7 %). Approximately a third of the streets were assessed with a moderate overall problem (litter = 34.0 %, vandalism = 29.2 %) while only a minor proportion were assessed as heavily affected (litter = 3.9 %, vandalism = 7.8 %). Thus, although the prevalence of both litter and vandalism were quite commonly observed along the studied inner-city streets the overall problem assessment does not imply any excessive figures of heavily affected
neighborhoods.
The summarized index of physical disorder was rather equally distributed among the studied neighborhoods as illustrated in Figure 3 (mean = 3.47, std dev = 0.947,
min = 1,38, max = 5,00). To ensure the independence of observed physical
disorder as a phenomenon unbiased by structural characteristics of the observed neighborhood, a bivariate correlation of observed physical disorder, average number of streets, average length of streets and neighborhood km2 was conducted. There were no significant correlations between observed physical disorder and any of the structural characteristics of the neighborhood. However, there was a
significant correlation between neighborhood km2 and average number of streets (Pearson’s r = .499 p < .05). This is however not very surprising since larger neighborhoods does most likely consist of more streets than smaller ones.
Figure 3 Distribution of virtually observed physical disorder per neighborhood.
Consistency of physical disorder
To approach an answer to the first question in this study, namely to what extent observed physical disorder through GSV measures the same phenomena as self-reported level of physical disorder in an urban neighborhood, a linear regression of the two measures of observed and self-reported physical disorder was
conducted.
Table 5 Bivariate linear regression of observed physical disorder on self-reported
perceived physical disorder.
Self-reported perceived physical disorder
Litter Vandalism Physical disorder Beta t-ratio Beta t-ratio Beta t-ratio
Observed litter .582 3.039** - - - -
Observed vandalism - - .839 6.537*** - -
Observed physical disorder - - - - .879 7.809***
R2 .339 .704 .772 * ** *** p < .05 p < .01 p < .001
Although observed and self-reported level of neighborhood litter are significantly correlated, as presented in Table 5, the correlation of observed and self-reported level of vandalism is considerably stronger. The differences between the two measures may be the result of litter as a more irregular and changeable
phenomenon than vandalism. In other words, the amount of litter observed may be dependent of factors such as the time of the day (i.e. pictures captured in the morning may result in more observed litter due to maintenance personnel not yet present to clean the streets) and the day of the week (i.e. pictures captured in weekends may result in more visible litter than during weekdays) in which the
GSV pictures were captured. This is however not a factor which influences the perception of respondents, nor the observed level of vandalism such as graffiti. Thus, the self-reported level of litter may be viewed as a general picture of the problem with litter while the observed level of litter may give a cross sectional view of the presence of litter at the time of the GSV capture.
Last but certainly not least, the correlation between summarized levels of physical disorder (i.e. the summarized index of litter and vandalism) in this study show the strongest relationship between observed and self-reported levels of physical disorder. Although Sampson & Raudenbush (1999) highlights a significant correlation between observed and self-reported physical disorder (standardized coefficient of .41 p < .001), their reported correlation is not as strong as in the present study. It should however be noted that Sampson & Raudenbush (1999) utilizes a different statistical approach, but the results are however interesting. In summary, the results of the analysis show that observed physical disorder through GSV explain a substantial proportion of self-reported perceived neighborhood level of physical disorder (R2 = .772). Figure 4 provides an illustration of the linear correlation between the two measures.
Figure 4 Scatter plot illustrating the linear correlation of observed physical
disorder and self-reported perceived physical disorder.
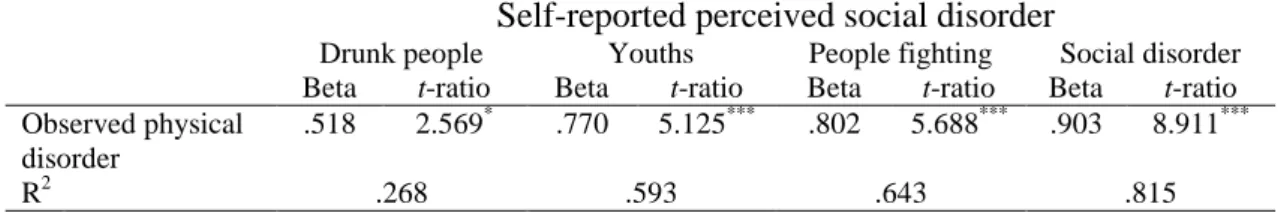
Observed physical disorder and self-reported social disorder
The section below attempts to answer the second research question of this study. By assuming the level of physical disorder in a neighborhood to be a mere
reflection of the level of social disorder (such as rowdy teenagers, people loitering or drinking alcohol in open public spaces) four separate bivariate regressions were conducted. To give an adequate view of the correlation of observed physical disorder and the prevalence of different types of self-reported social disorder, Table 6 illustrates the correlation between observed physical disorder in relation to perceived problems of people being drunk, groups of unruly youths disrupting order and people arguing and fighting in the neighborhood.