SGS LTER Annual Report 2010: Activities and Findings
During this year we submitted the renewal proposal for the remaining four years of SGS-LTER VI. This proposal was declined for funding, and after considerable negotiation with NSF the project will continue with three years’ funding and then be terminated.
Nonetheless, the central research objective of the SGS LTER project continues: to forecast potential impact of global climate change on the shortgrass steppe ecosystem in the western region of Great Plains of the United States. This system has exhibited remarkable persistence in a semi-arid temperate
environment characterized by high inter- and intra-annual variability in precipitation. The area is characterized by low-stature C4 grasses (blue grama, buffalograss) that have experienced a long
evolutionary history of grazing by large herbivores (e.g. historically by bison, now primarily as rangeland for cattle). In addition to the dominant grasses, other plants like prickly pear and scarlet globemallow well-adapted to smaller-scale disturbances caused by animals like prairie dogs. In eastern Colorado, the SGS ecosystem exists as a mosaic of land uses including native prairie, recovering prairie (some in the federal Conservation Reserve Program (CRP)), ranchland, tilled and irrigated farmland, and urban and exurban development. In addition to completing measurement and data archiving from long-term experiments, we engage in scientific initiatives important to our region, and continue cross-LTER and global synthetic analyses of data.
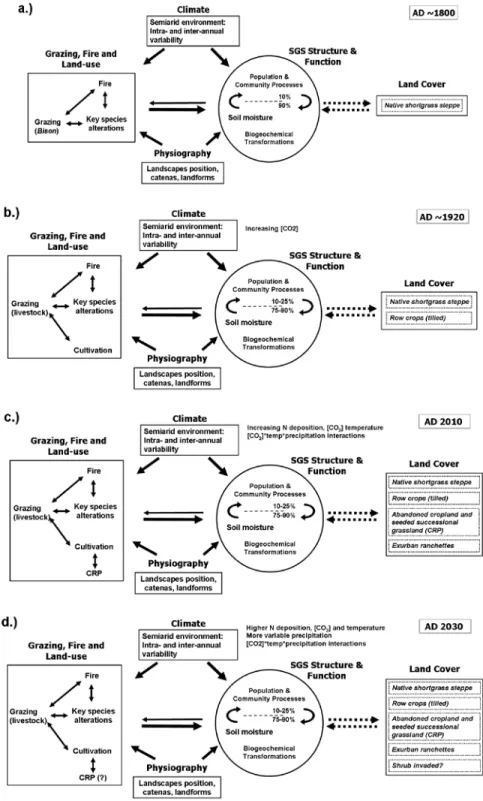
We will continue to work to forecast responses of the SGS ecosystem to global change, defined in the broadest sense to encompass multiple factors including climate, human land use, and invasive species. Our conceptual framework incorporates historical perspectives on how ecosystem determinants acted in the past and to illustrate that the SGS has experienced and will continue to experience change in the relative importance of determinants of SGS ecosystem structure and function (Figure 1).
Key to this work is a long-term and ongoing collaboration with scientists with the USDA-ARS Central Plains Experimental Range (CPER), the site where most SGS LTER work has been conducted. An additional memorandum of understanding with the Pawnee National Grassland in Weld Co. extends the SGS LTER site to include approximately 80,000 ha of public land under management by the USDA Forest Service. This annual report provides a summary of our A) Research Activities, B) Information Management (page 19), C) Education, Outreach and Training Activities (page 21), and D) Project Management (page 30).
During the last year, we produced 39 papers in refereed journals (published or in press), one PhD dissertations, and many abstracts from regional, national and international meetings. Most of our publications involved multiple authors, reflecting the collaborative spirit and interdisciplinary nature of the SGS-LTER research program.
A. Research Activities
Key research progress for 2008-2009 is organized to reflect the primary determinants of the SGS (Figure 1). Thus, we group research under the broad headings of 1.) Climate, 2.) Grazing, Fire and Land-use, and 3.) Physiography. Although determinants are identified separately, in most cases key
interactions between several determinants are studied in concert. We include a fourth section on
Synthesis and Modeling to describe our work on developing a larger picture through analyses of our long-term data and participation in cross-site studies. As in previous years, in 2010 we again reassessed sampling frequency and intensity of some long-term projects.
Figure 1. A temporal view of three primary determinants of structure and function of the SGS ecosystem: i.) Climate, ii.) Grazing, fire and land- use, and iii.) Physiography. a.) Before settlement for agriculture during the 1800s, the SGS ecosystem was dominated by herbivores (bison, prairie dogs), acting as primary disturbances and controlling plant species diversity by grazing of prevalent C4 grasses blue grama and buffalo grass. The frequency that fire also created disturbance is less well known. Temporal and spatial variability of determinants formed the SGS ecosystem, a persisting drought and grazing-adapted system where 90% of biotic interaction and biogeochemical transformations occur belowground. b.) European settlers removed bison and replaced them with livestock, and began tilled agriculture. Recurring droughts, especially in the 1910s, 1930s, and 1950s led to development of irrigation systems and irrigated agriculture. c.) The current state(s) of the system, with return of tilled lands to grassland, managed under the Conservation Reserve Program (CRP) initiated in part to conserve soil. The ecosystem currently exists as a mosaic of land uses. d.) With global change, changes in the timing and intensity of precipitation are expected. Known interactions between rising CO2 concentrations, temperature, and precipitation regimes may lead to several alternative states in the future.
1.)
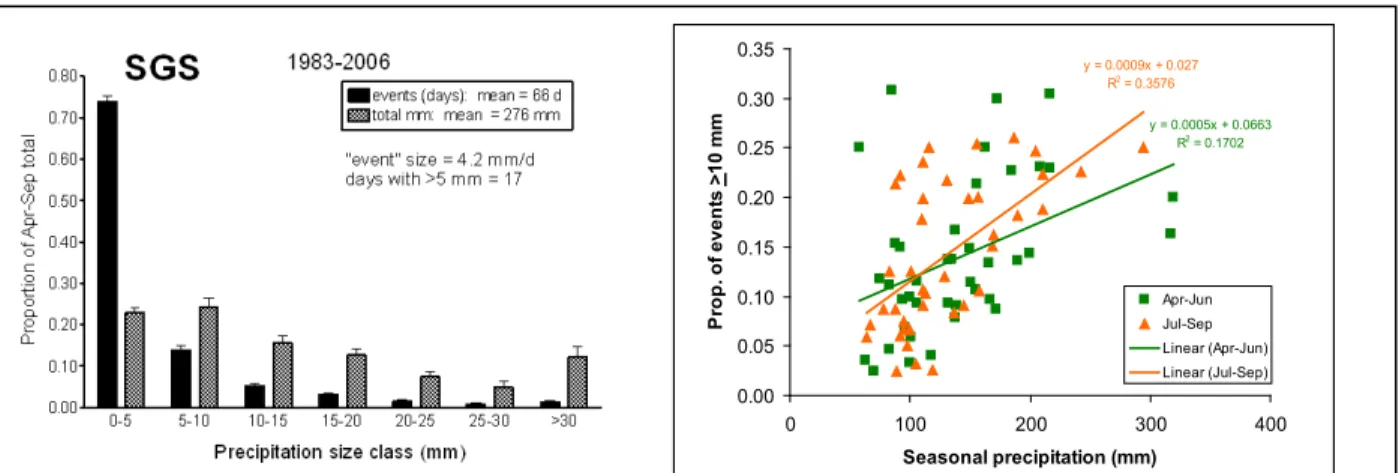
Climate is the major determinant of SGS structure and function, and examination of long term data suggests changes in climate have occurred. Inter-annual variation of SGS precipitation is high – since 1939 the recorded range was from 32% to 170% of the long-term annual average (95% c.i. 139 to 542 mm-yr-1). Intra-annual variation underlies this pattern: amounts of rainfall in each event fall into a
continuum, but events < 5 mm comprise more than 70% of the total during the growing season (Figure C1).
Climate
Events >10 mm account for most of that inter-annual variation (Figure C1; Sala et al. 1992).
Moreover, because potential evapotranspiration greatly exceeds precipitation over the course of the year, water from small events has contingent ecological impacts (Sala and Lauenroth 1985), and depend on the season (e.g. physiological state of plants and microbes), soil moisture and time since the previous event, and the time of day when rains fall (e.g. an evening rainfall in summer may infiltrate) (Sala and Lauenroth 1985, Heisler et al. 2009). Intra-annual variation can be summarized by the sizes of “wetting events” (when daily precipitation > daily potential evapo-transpiration) and by duration between events. Potential for long duration between wetting events, coupled with high potential evapotranspiration, suggests that the SGS LTER experiences periods of time where biological activity is pulsed by precipitation
events.Long-term trends in the SGS LTER climate record show little change in temperature (Figure C2) but alteration in precipitation.
Between 1969 and 2008, the period spanning both the International Biome Project and SGS LTER projects, no discernable changes in monthly minimum or maximum temperatures were observed, except for August data that show a slight but significant cooling (both minimum and maximum temperatures, P < 0.034, r2 > 0.11). The 1939-2004 precipitation record reveals an increase in precipitation over the past 65
y = 1.7725x - 3154.1 R² = 0.1142 0 100 200 300 400 500 600 700 1939 1944 1949 1954 1959 1964 1969 1974 1979 1984 1989 1994 1999 2004 A nn ua l p re ci p, m m Year
Annual Precipitation at the ARS CPER HQ
Figure C2. Annual temperature and precipitation records from the USDA ARS CPER HQ. Precipitation readings have been taken manually each day at 08:00 hr since 1939. Regression is significant (p<0.006). Wetting events are defined as >5 mm-d-1. The long-term average is
340mm (+/- 115 mm SD), maximum (581mm) in 1967 and minimum (109 mm) in 1964.
y = 0.0005x + 0.0663 R2 = 0.1702 y = 0.0009x + 0.027 R2 = 0.3576 0.00 0.05 0.10 0.15 0.20 0.25 0.30 0.35 0 100 200 300 400 Seasonal precipitation (mm) P ro p. o f even ts >10 m m Apr-Jun Jul-Sep Linear (Apr-Jun) Linear (Jul-Sep)
Figure C1. The distribution of rainfall events and the relationship between large (wetting) events related to annual precipitation. The SGS LTER climate is predominantly comprised of small rainfall events, but wet years have more large events.
y = 0.0825x - 149 R² = 0.1193 0 5 10 15 20 25 30 1939 1944 1949 1954 1959 1964 1969 1974 1979 1984 1989 1994 1999 2004 m ea n ev en t si ze, m m Year
July - September Wetting Event Size at the ARS CPER HQ
Figure C3: Size of wetting events during July, August and September has increased at the SGS LTER (p<0.005). The size of all events did not change over this time period (p>0.1), nor did the amount of water delivered by small events (p>0.4).
years at an annual rate of 1.8 mm-yr-1 (Figure C2), both in summer (JAS at 0.75 mm-yr-1) and winter
(DJFM at 0.38 mm-yr-1). During summer, average size of ALL precipitation events has not changed, but
the size of wetting events has increased (Figure C3); on average, summer wetting events now deliver 5.4 mm more than they did in 1939. In addition, there has been a significant decrease in the number of days between wetting events.
Our observations of increasing magnitude of precipitation events are consistent with world-wide patterns of increasing storm intensity, resulting from global climate change (IPCC 2007). Global circulation models predict that global warming will accelerate the hydrologic cycle across temperate North America, and drive both larger precipitation events and a greater number of dry days between storm events (IPCC, 2007). While model ensembles predict the SGS LTER to experience 4°C warming and 5-10% reduction in JJA precipitation (IPCC 2007), inter-model agreement on these predictions is poor. It is likely that global climate change will drive increased potential evapotranspiration on the SGS LTER, but it is unclear to what degree
this increase will be offset or exacerbated by changes in the precipitation regime. Further, our own experiments indicate that effects of temperature and precipitation will be tempered by altered water use efficiency of C3 versus C4 plants with rising atmospheric CO2 concentrations (Morgan et al. 2007).
We continue to carry out experiments and monitoring to examine the effects of the climate regime on structure and function of the SGS ecosystem, and the potential for changes in structure if global change results in altered seasonal patterns of rainfall and temperature. The following highlight some of our results from this line of research.
Our primary data set recording annual ANPP over 26 years on sites that vary in landscape position, soil texture, and species composition show that ANPP has ranged from a low of 11 g-m-2 to a high of 185
g-m-2 (Figure C4). Within the most productive sites (Swale), ANPP has ranged from 15 to 185 g-m-2 and
from 11 to 102 g-m-2 within the least productive site (Upland).
Aboveground Net Primary Productivity (ANPP) and Climate
Figure C4. Annual ANPP for 5 locations over 24 years on the SGS LTER site (left), and the relationship between the variability of annual ANPP (standard error) and the annual precipitation for 5 locations.
Both the magnitude and variability of ANPP are related to water availability (Sala et al. 1988, Lauenroth and Sala 1992). Annual precipitation is positively related to ANPP and to the variability of ANPP among sites (Figure C4). The greatest variability was recorded in wet years and the lowest in dry years. The large spread around the relationship is likely the effect of the seasonal distribution of
precipitation during average-to-wet years.
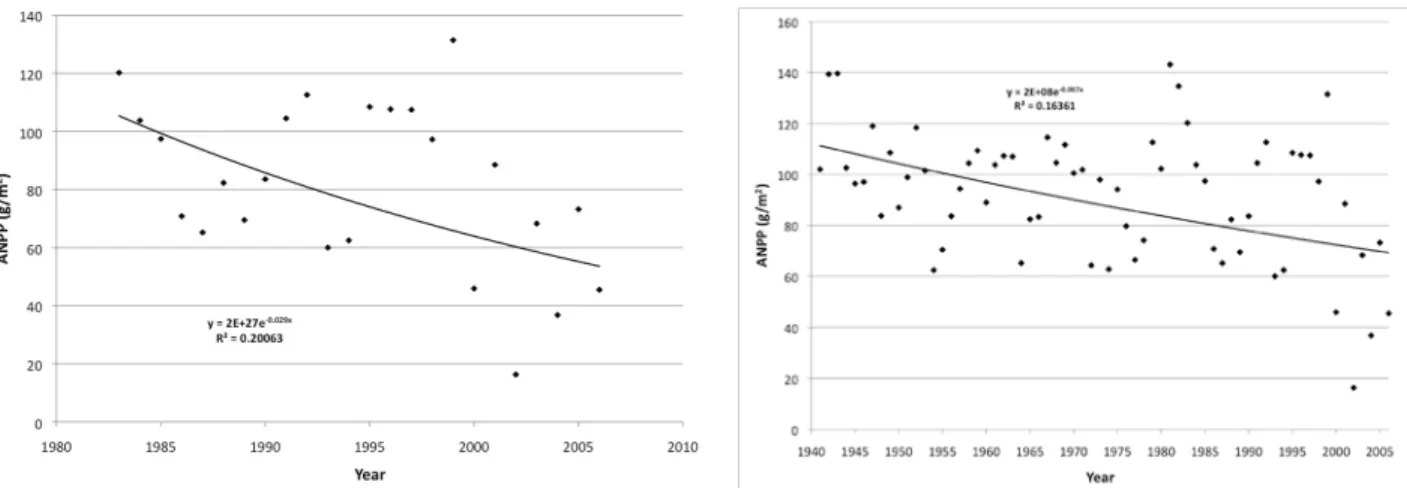
Combining all location data into an average annual ANPP reveals a declining trend in production since the beginning of the SGS LTER project (Figure C5). Further, combining the LTER data with the long-term data collected by the CPER preceding the SGS LTER suggest a declining trend over the last half of the 20th century (Figure C5). In both cases the relationship is variable, explaining only 16 to 20%
of the variability in the data. However, a 68-year graph suggests that much of the decline has occurred in the past decade. What is not clear is whether this is a short-term fluctuation or the beginning of a long-term change associated with climate change. For instance, data for 2009, which includes one of the wettest recorded May-June rainfall periods on record, show that 2009 has close to the highest ANPP on record.
Measuring ANPP by clipping of vegetation is time-consuming, and methods based on peak biomass at a single point during the growing season may be biased. Thus we (graduate student Kerry Byrne) tested alternative methods for estimating ANPP, as supplements to the traditional method of peak biomass harvest. We assessed accuracy and precision of non-destructive techniques by harvesting biomass in 15 0.5m2 plots and compared estimates from the same plots to: 1) canopy interception using a point frame; 2)
green cover estimated from a digital camera; and 3) reflectance measurements using a hand-held radiometer.
Testing Peak Biomass Measurements of ANPP
For the point frame method, we used a 62 cm x 80 cm quadrat with 50 equally spaced points inside. We passed a pin perpendicular to the soil surface through each of the points and recorded the number of times the pin intercepted green vegetation. “Green hits” were separated into three functional groups: graminoids, forbs, and dwarf-shrubs. Second, we used digital images of each plot from ~1.25 m elevation taken with a First Growth digital canopy camera (Decagon Devices 2004). The instrument calculates percent green cover based on the ratio of green pixels to total pixels. Finally, we measured reflectance with a Skye Instruments SKR 1850 4-Channel Light Sensor and calculated a greenness index.
Immediately after non-destructive sampling we clipped green and recent dead material from plots. We separated biomass by functional group and dried each in paper bags for ≥ 48 hours at 55 °C before being weighed.
Figure C5. Declining trend in average ANPP over 24 years on the SGS LTER site (left) and over 68 years including data from the Central Plains Experimental Range (USDA-ARS) (right).
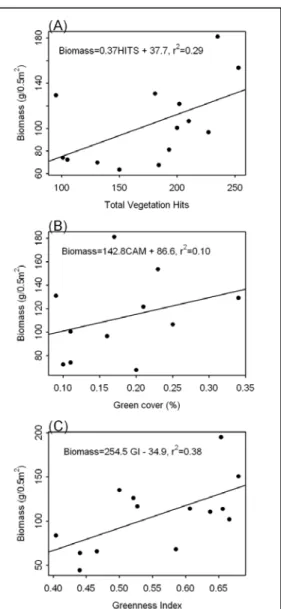
Using the point frame method, we found that the total number of vegetation hits a statistically significant (p<0.05) explanatory variable that only explained 20% of the
variability in biomass (Figure C6A). Including average height of first intercept and the number of hits by functional group greatly improved the model’s explanatory power. No individual parameters were significant at either site, but explanatory power of the models increased to 91%. Green cover estimated by the digital canopy camera was a poor predictor (non-significant) of biomass. The model explained 10% of the variability in biomass (Figure C6B). The
radiometer data explained 38% of the variability in biomass and greenness was a significant explanatory variable (p<0.05, Figure C6C).
Ecosystem Phenology in the SGS
In 2001, two Skye 1800 2-channel radiometers (red 630 nm and near-infrared 862.5 nm) were established on the SGS LTER. Reflected radiation is recorded every minute,
averaged hourly and stored. Complementary to both data sources is an onsite daily record of temperature,
precipitation, wind speed, and various other meteorological measurements, which will be used to develop the models. Additionally, the radiometric site has soil moisture probes at 3 soil depths. Analysis of the species specific data is focused on Bouteloua gracilis which contributes the majority of the leaf area and aboveground net primary production in the ecosystem (Lauenroth et al. 2008).
With changing seasonal precipitation and the potential for higher temperatures, we may expect alterations in plant phenology and the length of the growing season. In water-controlled ecosystems, the effects of temperature and photoperiod on phenology are modulated by the availability of soil water. This research directly addresses whether e question of the individual and joint effects of water
availability and temperature on the onset of spring. In 1995, the SGS LTER began collection of phenological data at 2-week intervals for 10 individuals of each of 22 plant species.
In 2001 we began continuous monitoring of plant canopy development, where two Skye 1800 2-channel radiometers were installed in a grazing exclosure and in the adjacent grazed pasture. The radiometers are polled every minute and averaged hourly. Additionally, soil moisture is monitored using time domain reflectometry (TDR) probes at 3 soil depths, 0-10 cm, 10-20 cm, and 20-30 cm. To record site
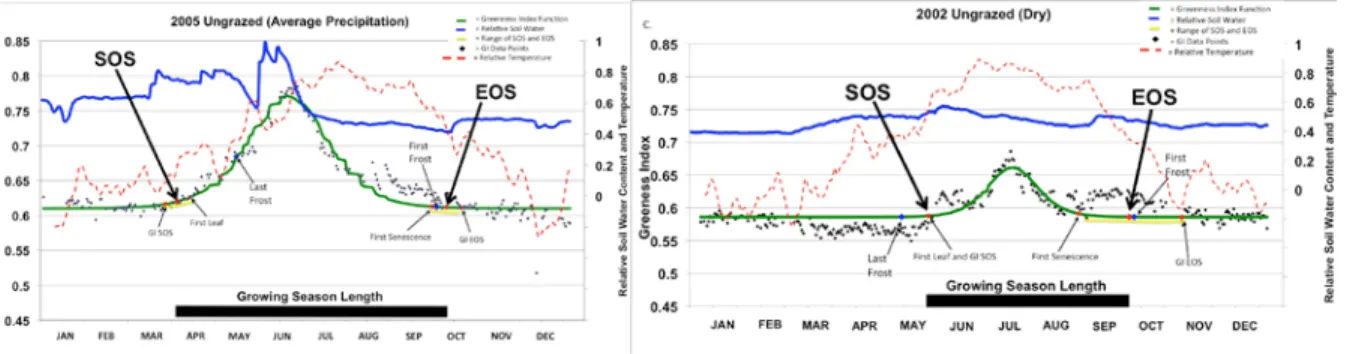
precipitation, a tipping bucket gauge was installed recording 24-hour totals. We calculate the Normalized Difference Vegetation Index (NDVI) for the noon hour reflectance average based on Fischer, (1994a, b). We compare the beginning and end of growing seasons (SOS and EOS) by fitting double logistic curves to the NDVI data (Figure C6). For instance, in 2005, which had long-term average precipitation (323 mm), the ungrazed treatment had a 204 day “green” season with the peak in the middle of June. By contrast, 2002 was a very dry year with only 150 mm of precipitation, a growing season of only 142 days, a peak in July, and pulses in NDVI that were associated with soil moisture pulses. It was predictable that the dry year (2002) would have a shorter growing season, but surprising by the 30% shorter time than in an average year (2005). The effect of precipitation on phenology was greater than the effect of grazing, but the two effects interact. The ungrazed treatments showed a difference of 34 days between 2002 and 2005 and the grazed treatments differed by 60 days between 2002 and 2005. In years with average
Fig. 1 (A) Relationship between total vegetation hits and biomass (r2= 0.29, P<0.05); (B) relationship
between percent green cover and biomass (r2= 0.10,
N.S.); and (C) relationship between a greenness index and biomass (r2= 0.38, P<0.05) on the shortgrass
precipitation, growth began before the last frost in spring, whereas in dry years growth was only after the last frost. The difference between the minimum and maximum values of GI, an index of ANPP, was approximately 4 times greater in an average year than in a dry year (Figure C6). Pulses in GI were closely associated with soil water pulses in 2002 and 2005.
Given the key role that variability in precipitation and moisture pulses play at the SGS LTER, long-term precipitation experiments and short-long-term experiments demonstrate mechanistically how timing and amount of precipitation affects ecosystem processes on the SGS. We continue a long-term rainout shelter experiment that is now in its 12th season.
Manipulating the Rainfall Regime: Short-term Pulse Experiment
During the growing season, plants and microbes on the SGS experience periods of water stress, alleviated by periodic rains that replenish soil moisture. At the ecosystem scale, rainfall events induce a short-term pulse of CO2 release, followed later by stimulation of plant photosynthetic activity (Heisler et
al. 2009, Knapp et al. 2008). The “Pulse Experiment” was a multi-investigator, synthetic experiment to characterize the magnitudes and time scales of plant and microbial responses to rainfall events of different sizes. From this experiment we seek to develop mechanistic understanding of processes contributing to net CO2 exchange and better predictions of responses to climate change. Climate models predict that
hydrologic cycles will accelerate, leading to more rapid evaporation, more intense precipitation events, and longer intervening dry periods.
We applied three treatments: control, a 1cm rainfall event, and a 2cm event, with each treatment replicated five times in 2m x 2m plots. The site has sandy-loam soils in a moderately grazed pasture. The experiment was conducted in July 2009, following one of the wettest Junes on record (95th percentile in the 69-year record). Rainout shelters protected the plots from non-experimental precipitation, and the shelters caused soil moisture levels to decline from field capacity on June 22 to very dry levels on July 13 when we added water. TDR probes recorded soil moisture and temperature prior to and following the experiment.
From a shared pool of soil samples collected on days 0, 1, 2, 3, 4, and 7 we measured microbial and soil faunal biomass and community composition using traditional and molecular techniques (microscopy and pyrosequencing) to characterize the bacterial and fungal community, microbial enzyme activity and extractable N pools. In separate soil samples, we assessed ammonium and nitrate dynamics on days 1 and 7 using additions of 15N-labeled ammonium and nitrate. We directly measured trace gas fluxes every 3 hours for the first 24 hours, and on days 2, 3, 4, and 7. Aboveground, we measured plant growth, leaf-level gas exchange, and NDVI at the plot scale.
Blue grama grass is the dominant grass on the SGS, and its response to precipitation pulses drives net primary production (Figure C8). Photosynthetic rates on the control and +1cm plots fell over time, but were elevated in +2cm plots. Leaf-level physiological measures reveal that blue grama responses depend
Figure C6. NDVI data for and ungrazed plot in 2005 (an average precipitation year) and 2002 (a dry year) showing the greenness index (GI) data points, double logistic curve, estimated start of season (SOS), end of season (EOS), temperature and soil water data are expressed as relative water content. First and last frost are indicated along the logistic curve. SOS=Start of season, EOS=End of season. GI=Greenness Index.
Soil fauna
Omnivorous nematodes m g b io m ass /g so il Flagellates Day m g b io m ass /g so il Amoebae m g b io m ass /g so il Fungal biomass Day m g b io m ass /g so il 0.0E+00 5.0E-06 1.0E-05 1.5E-05 2.0E-05 2.5E-05 3.0E-05 3.5E-05 0 1 2 3 4 5 6 7 Control +1cm +2cm 0 0.2 0.4 0.6 0.8 1 1.2 0 1 2 3 4 5 6 7 Control +1cm +2cm 0 0.0001 0.0002 0.0003 0.0004 0.0005 0.0006 0 1 2 3 4 5 6 7 Control +1cm +2cm 0 0.0005 0.001 0.0015 0.002 0.0025 0 1 2 3 4 5 6 7 Control +1cm +2cmFigure C9. Water pulses increased led to brief but linked changes in soil microfauna.
upon stomatal controls that keep water use efficiency nearly constant. Leaf-level gas exchange measures are consistent with patterns in observed growth.
Soil fauna create a rich, interactive food web with potential to alter the standing biomass of bacteria and fungi, and therefore structure the temporal patterns of nutrient release and CO2 efflux from the soil. Illustrated here (Figure C9) are dynamics of 4 of the 19 measured groups of soil biota, many of whom showed statistically significant temporal trends. A major synthesis activity of the pulse experiment will be to couple our existing food web and biogeochemical models to better understand how food web stability alters carbon and nutrient dynamics in SGS soils.
The pulse addition induced an immediate 3x to 4x increase in ecosystem respiration that decayed to 2x baseline within 18 hours (figure C10). The size of this initial response was independent of precipitation volume, but the return to baseline between 1 and 7 days post pulse was faster for the smaller +1cm event. The response of methane uptake depended on if high soil moisture conditions slowed diffusion into the soil, or if water stress limited the activity of methane-consuming bacteria.
The pulse induced a burst of mineralization (leading to high ammonium on day 1), followed by a nitrification pulse (leading to high nitrate on day 2).
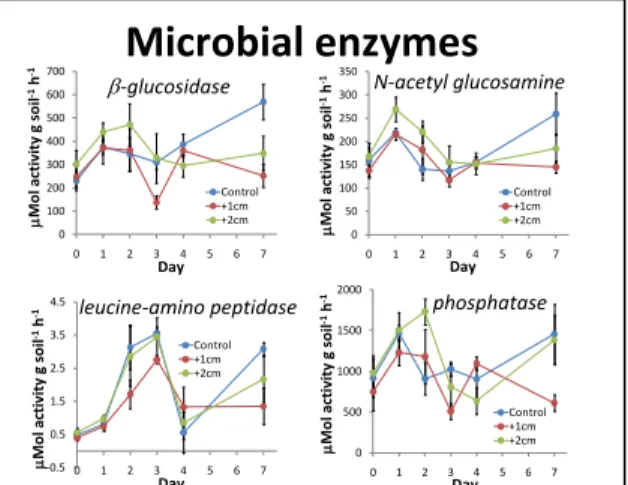
The activities of enzymes that degrade C-rich substrates increased following the pulse, peaking after two days, then declined below non-pulsed control plots (Figure C11). In contrast, peptidase activities peaked after day four. Our results challenge the paradigm that enzyme activities in soils are relatively stable, but rather indicate that a large non-stabilized pool of enzymes is subject to rapid turnover and is responsive to moisture pulses. These data also suggest that microbial
production of enzymes degrading different substrates are decoupled through time, perhaps in response to changing stoichiometric needs and nutrient availability through time.
We anticipate several additional data sets from this experiment:
• 15N isotope pool dilution for dynamics and fates of labeled ammonium and nitrate.
• Pyrosequencing for deep phylogenetic analysis of
changes in microbial community composition.Preliminary results from Dr. Noah Fieier indicate the use of a newly-developed pyrosequencing technique to characterize soil bacterial communities from a relatively large number of samples in unprecedented detail.
Analyses averaged 1006 sequences per sample for 132 samples analyzed. Results from a ‘cross-SGS’ surveys revealed large variation in the structure of soil bacterial communities across the landscape, with
Soil biogeochemistry
0 5 10 15 20 25 0 1 2 3 4 5 6 7 Control +1cm +2cm ecosystem respiration Day g CO 2 -C m -2d -1 0 5 10 15 20 25 0 1 2 3 4 5 6 7 Control +1cm +2cm ecosystem respiration Day g CO 2 -C m -2d -1 0 0.5 1 1.5 2 2.5 0 1 2 3 4 5 6 7 Control +1cm +2cm methane uptake Day m g CH 4 -C m -2d -1 0 0.5 1 1.5 2 2.5 0 1 2 3 4 5 6 7 Control +1cm +2cm methane uptake Day m g CH 4 -C m -2d -1 0 0.05 0.1 0.15 0.2 0.25 0.3 0.35 0 1 2 3 4 5 6 7 Control +1cm +2cm extractable ammonium Day m g NH 4 +-N L -1 0 0.05 0.1 0.15 0.2 0.25 0.3 0.35 0 1 2 3 4 5 6 7 Control +1cm +2cm extractable ammonium Day m g NH 4 +-N L -1 -0.02 0 0.02 0.04 0.06 0.08 0.1 0 1 2 3 4 5 6 7 Control +1cm +2cm extractable nitrate Day m g NO 3 --N L -1 -0.02 0 0.02 0.04 0.06 0.08 0.1 0 1 2 3 4 5 6 7 Control +1cm +2cm extractable nitrate Day m g NO 3 --N L -1Figure C10. Ecosystem-level responses to water pulses were short-lived. 0 0.03 0.06 0.09 0.12 0.15 0 1 2 3 4 5 6 7 Control +1cm +2cm
Leaf physiology & growth
0 0.2 0.4 0.6 0.8 Control +1cm +2cm Ambient Height
Newest Leaf Length 2nd Newest Leaf Length
growth Treatment gr ow th , cm 0 0.2 0.4 0.6 0.8 Control +1cm +2cm Ambient Height
Newest Leaf Length 2nd Newest Leaf Length
growth Treatment gr ow th , cm
water use efficiency
Day mol C O2 /mol H2 O photosynthetic rate µmol C m -2s -1 Day stomatal conductance Day mol m -2s -1 0 5 10 15 20 25 0 1 2 3 4 5 6 7 Control +1cm +2cm 0 0.25 0.5 0.75 0 1 2 3 4 5 6 7 Control +1cm +2cm
Figure C8. Water use efficiency of the dominant grass blue grama remains constant over a range of experimentally-induce water levels
-0.5 0.5 1.5 2.5 3.5 4.5 0 1 2 3 4 5 6 7 Control +1cm +2cm
Microbial enzymes
β-glucosidase Day µMo lac ti vi ty g so il -1h -1 leucine-amino peptidase Day µMo lac ti vi ty g so il -1h -1 N-acetyl glucosamine Day µMo lac ti vi ty g so il -1h -1 phosphatase Day µMo lac ti vi ty g so il -1h -1 0 100 200 300 400 500 600 700 0 1 2 3 4 5 6 7 Control +1cm +2cm 0 50 100 150 200 250 300 350 0 1 2 3 4 5 6 7 Control +1cm +2cm 0 500 1000 1500 2000 0 1 2 3 4 5 6 7 Control +1cm +2cmFigure C1. Induction of microbial enzymes varied relative to addition of water pulses
much of this variability predictable from changes in soil pH. Shifts in bacterial community composition related to soil depths consistently across the profiles examined. For reasons that are not yet clear, soils in or near prairie dog colonies harbored very distinct bacterial communities. Results from the pulse experiment revealed no short-term (1-2 days) or longer-term (>1 week) effects of rainfall events of varying intensity on either soil bacterial community composition or diversity. These results suggest that soil bacterial communities are remarkably resistant to perturbations caused by rainfall events.
• Plot-scale measures of NDVI, for finer temporal observation of green-up and senescence.
• Concomitant eddy covariance tower measures of
season-long ecosystem C fluxes, and responses to natural precipitation events .
The SGS represents a highly persistent ecosystem (Milchunas et al. 1988) in which plant communities dominated by Bouteloua gracilis (blue grama) have a long evolutionary history of natural disturbances operating over a wide range of spatial scales. The severity of disturbances on SGS structure and function is affected by the semi-arid climate and prior to European settlement, grazing by bison (Bos bison) interacting with species like black-tailed prairie dogs (Cynomys ludovicianus) and with fire was a primary determinant (Figure 1a). A suite of small-scale disturbances causing turnover of individual bunchgrasses and soils also played a role (Peters et al. 2008). In the mid-1800s the demise of bison herds and the introduction of livestock led to the first large-scale transition in land use, from free-range native grazers to domesticated livestock confined to small land parcels (e.g., pastures). The Homestead Act in 1862 set the stage for the second large-scale transition in land use: row crop agriculture (small grains) with and without supplemental irrigation (Hart 2008) those dramatically altered natural disturbance regimes by replacement of the diverse largely perennial native plant community with a monoculture of annual tillage and planting. This transition modified carbon and nitrogen storage and cycling, and produced a second ecosystem state (tilled farmland; Figure 1b). Removal of the native perennial plant community for tillage set the stage for the Dust Bowl during the 1930s and had legacy effects that persevered for more than six decades (Ihori et al. 1995; Coffin et al. 1996). Millions of hectares of tilled land were returned to
rangeland after the 1930s, with additional land enrolled under the CRP since 1986 (Farm Service Agency, USDA). For instance, 102,000 ha (10% of total area) of Weld Co., where the SGS LTER site is located, is currently managed under the CRP, with a total of 950,000 ha in eastern CO in CRP.
2.) Grazing, Fire and Land-use
SGS-LTER research on plant community disturbance has focused on livestock grazing, small-scale disturbances, and abandoned cropland (Peters et al. 2008, Milchunas et al. 2008, Burke et al. 2008). Recent investigations of disturbances have included study of black-tailed prairie dogs (Guenther and Detling 2003, Stapp et al. 2004, Antolin et al. 2006, Stapp 2007, Augustine et al. 2008, Hartly et al. 2009), and fire (Augustine and Milchunas 2009, Schientaub et al 2009). Here we describe ongoing research in this area that now includes several studies carried out at larger scales where multiple interacting determinants are measured in concert.
Although much of past SGS LTER research examined the influence of single disturbance factors, it has become clear that interactions between them likely important in the past and will be influential in the present. Dr. David Augustine and David Augustine initiated a 65 ha-scale patch burning experiment consisting of 3 unburned control pastures and 3 pastures in which 25% of the area will be burned each year. The first set of burns was implemented in November, 2007, with fuel loads that averaged 698 kg/ha. Burns were relatively homogenous and produced mean maximum temperature of 160°C (range 102 – 221°C) at 1 – 2 cm above the soil surface. Response variables measured include soil moisture,
plant production and residue, plant species composition and structure, cattle foraging distribution, cattle weight gains, and breeding bird densities.
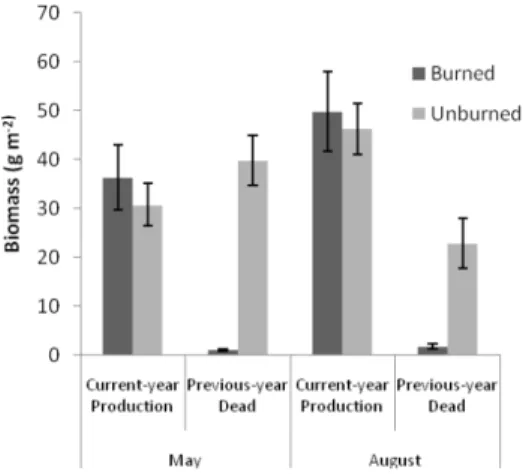
Initial findings show that burns removed >95% of standing dead biomass, but had no influence on plant production during the first post-burn growing season (Figure D1). Patch burning did not influence cattle weights gains (1.07 kg/steer/day on patch burn and 1.06 kg/steer/day on control pastures of the same size and same moderate stocking rate). Burned areas had less standing residue at the end of the grazing season (early October) with 523 kg/ha remaining in the burned areas compared to 585 kg/ha in the non-burned portions of the same pastures. Burns significantly reduced vertical vegetation density (visual obstruction) by ~46% (3.8+0.3 cm on unburned sites vs. 1.8+0.2 cm on burned sites).
Additional prescribed patch burns were implemented on the three replicate pastures in October, 2009. The effects of the burns on cattle grazing continued in the 2010 field season (May and June), with measurements of cattle grazing distribution
via GPS collars, plant species composition and structure, and densities of grasshoppers and grassland bird species.
In 2008, breeding mountain plovers, which favor bare ground for nesting, were observed on each of the 3 replicate patch burns (1 - 2 adult plovers and 1 nest per burn in May. Mountain plover is a species of concern in Colorado and has recently been proposed for listing under the Endangered Species. The patch burn experiment continues to document strong selection for burned sites by nesting mountain plovers. In addition, Dr. David Augustine ((USDA-ARA) monitors nesting plover responses to wildfires, prescribed fires, prairie dog colonies, and grassland sites throughout the Pawnee National Grassland and Central Plains Experimental Range. Detailed measures of vegetation structure are made at nest sites and at randomly-selected grassland sites with varying levels of cattle grazing to identify key features of mountain plover nesting habitat.
In a study examining the direct effects of prescribed fire on ecosystem processes, Drs. Derner, Augustine von Fischer and Blumenthal continued measurements of soil moisture, temperature and inorganic N dynamics, ANPP, and plant N content in relation to precipitation pulses in burned and unburned sites. Microbial community composition of soils from this study is currently under analysis, and will be linked to burn effects on soil moisture, temperature and N cycling. Part of this study is led by Dr. Joe von Fischer’s graduate student, Paul Brewer.
In 2009-10, we continued our long-term monitoring studies of mammals, their resources and habitat. These datasets were updated, checked and revised and are available on the SGSLTER website. USFS staff also continued to monitor changes in the status of prairie dog colonies on the PNG, which is also done on CPER. Following a peak in rabbit numbers in 2006-07, populations of black-tailed jackrabbits and cottontails have fallen. However, kangaroo rats have continued to be the most abundant rodents since the 2000-02 drought. The total area of active colonies continued to increase following the widespread plague outbreak in 2005-06, but colonies on the CPER have not recovered and are still very small.
Long-term Monitoring of Small Mammals and Carnivores
In 2009, we modified our protocols for estimating density of grasshoppers, following methods used by ARS scientists. This included changing to smaller sampling hoops, increasing the number of hoops per site, and adding sampling to estimate community composition. We continue to estimate grasshopper densities on plots associated with the ARS patch-burn study. Graduate student Sean Hauser (Cal-State
Figure D1. Comparison of burned and unburned patches on the SGS LTER/CPER. Burning reduced standing dead biomass but not ANPP in the first year.
Fullerton) is using these methods to examine the effects of prairie-dog and livestock grazing on diet and abundance of grasshoppers.
We continued to sample vegetation structure, plant species composition and small mammal abundance as part of a long-term study of the effects of native (prairie dog) and non-native grazing on rodent populations. Sampling of small mammals now is conducted every third year (2006, 2009), with the next sampling to be conducted in 2012.
We examined responses of vegetation and small mammals to chemical removal of prickly pear cactus, a project that began in 2008. Herbicide was sprayed in June 2009 and we estimated densities of kangaroo rats pre- and post-spray, with kangaroo rats slightly more abundant on controls. We also sampled vegetation and habitat characteristics on treated and control sites. REU student Leslie Herington is continuing sampling on this project in summer 2010.
Plague, as an exotic pathogen in Colorado since the 1940s, has altered population dynamics of black-tailed prairie dogs to that of a metapopulation where local disease outbreaks cause extinctions of towns that are subsequently re-colonized within 1-4 years (Stapp et al. 2004, Antolin et al. 2006, Augustine et al. 2008). Prairie dogs are a foundation species that creates habitat (and disturbance) by burrowing, is preyed upon by numerous species, and directly influences plant community composition by grazing of dominant grasses and clipping of other vegetation on their towns. Thus, plague outbreaks play an ecosystem-level role by controlling prairie dog populations, including the spatial distribution of their disturbances on the landscape and recovery from prairie dog disturbances to plant communities (Hartley et al. 2009). Further, because of detailed knowledge of mechanisms of pathogenesis in the plague bacterium Yesinia pestis, this pathogen serves as a model for translational research of infectious diseases from genomics to population-level analyses and beyond (Antolin 2008, Stapp et al. 2008). This project has been partly funded in part by a separate NSF-EID grant to study the mechanisms of persistence of this highly virulent pathogen (PIs Antolin, Stapp, ending in August 2009). Work has included a large number of graduate students, and we list recent highlights here: 1.) molecular genetic analyses to identify the source of host blood meals in fleas to determine the host range of fleas and potential interspecific routes of infection (also see Stapp et al. 2009); 2.) movement of grasshopper mice (Onychomys leucogaster) a known alternative host; 3.) the role of increased flea abundance on prairie dogs during plague outbreaks (Tripp et al. 2009); 4.)
transmission efficiency of the two main prairie dog fleas, Oropsylla hirsuta and O. cynomurus
tuberculata (Wilder et al. 2008a,b); 4.) development of robust methods for population estimation based
on visual counts of prairie dogs (McClintock et al. 2009); 5.) radio-tracking swift fox (Vulpes velox) and leg-banding of burrowing owls (Athene cunicularia) to determine home range shifts in relation to die-offs of prairie dogs, 6.) time necessary for recovery of plant communities after plague epizootics devastate local prairie dog towns (Hartley et al. 2009).
Plague and Disturbance of Prairie Dog Towns
Long-term studies of prairie dog effects on the CPER examine the effects of a plague epizootic that removed prairie dogs from most colonies during 2006-2007. In July, 2009, Drs. Augustine and Derner completed measures of vegetation cover and composition at >1000 permanently marked plots on plague-affected colonies. During July – August, 2009, we also measured cattle distribution (GPS collars) in relation to these prairie dog colonies, and during the 2009 growing season we measured cattle weight gains in pastures with and without the plague-affected colonies.
This year will be the third season of grazing on a study that evaluates limited grazing on succession and stability of CRP. CRP in the SGS region is a large component of the landscape (Fig. D2). The tall-grass structure of the C3 tall-grasses planted in CRP (as opposed to the native dominant short C4 tall-grasses like blue grama) are a source of fragmentation for native plant and wildlifepopulations and may allocate a larger portion of C to aboveground production than do native grasslands (Milchunas et al. 2005). In this context, grazing should reduce opportunistic “weedy” species (as it does in native communities), speed succession, and stabilize the systems through selecting for species with greater belowground allocation and potential to sequester carbon in soil. Plant community composition and productivity are sampled annually, and root biomass every fourth year.
Three years of light grazing has had no effect on ANPP, but ANPP is much greater on new CRP relative to either old CRP or native grazed shortgrass. Light grazing reduces exotic species cover in both new and old CRP. A new heavy grazing treatment was added to the design this year, after the rancher accidentally
allowed extremely heavy grazing to part of the CRP fields in 2008. Soil erosion from the heavily grazed CRP treatments was excessive, and soil loss measurements were made this spring. Vegetation recovery on these new treatments will be made this August, along with those of previous treatments. Observations in June suggested remarkable recovery. This very heavy grazing represents what is often applied to CRP under drought emergency grazing due to lack of regulation enforcement by management agencies.
Given the large areas of Weld Co enrolled in CRP (102,000 ha, larger than the current SGS LTER site including the Pawnee National Grassland), its potential importance in fragmentation of habitat, and role in altering large scale C and N storage and fluxes, the SGS LTER project will increase its focus on the ecosystem-level effects of land use practices with these studies.
Progress in 2009-2010 includes installation of root-ingrowth donuts for estimating belowground net primary production (BNPP) (Milchunas 2009) on the CRP study site in all treatments. This has two important implications for testing our conceptual framework. First, we directly test that grazing of early seral stage revegetated grassland will speed succession by selecting for grazing-tolerant perennial short grasses that allocate relatively more belowground than aboveground. We hypothesize this will lead to greater stability system in the face
of fluctuating annual climate cycles and drought, and sequester greater amounts of soil carbon compared to annual and invasive forbes. The belowground (root) production data will be used with currently collected aboveground primary production data, and community species composition data to test the hypotheses. Second, unbiased estimates of BNPP based on soil coring that measure response to grazing are extremely rare in the global literature, and represent a gap in our understanding of the SGS. This adds a new dimension to our ongoing collection of CRP Enrollment in Colorado 0 100,000 200,000 300,000 400,000 500,000 600,000 700,000 800,000 900,000 1,000,000 1986 1987 1988 1989 1990 1991 1992 1993 1994 1995 1996 1997 1998 1999 2000 2001 2002 2003 2004 2005 2006 2007 Year Tot al C olor ado A re a ( ha ) 0 20,000 40,000 60,000 80,000 100,000 120,000 C ount y A re a ( ha ) Total Weld County Larimer County
Figure D2. A large portion of the short grass ecosystem in Colorado, Kansas, Oklahoma and Texas is currently enrolled in the CRP program administered by the Farm Service Agency of the USDA. Since its inception in 1986, CRP enrollment has grown to cover about 10% of eastern Colorado, including Weld Co. in northern CO where the SGS LTER site is located.
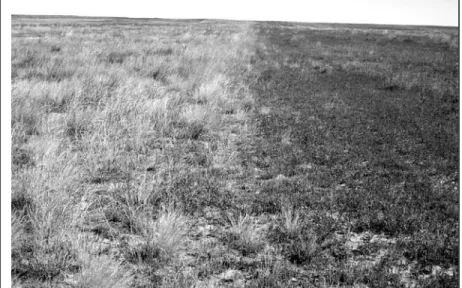
Figure D3 A view along the boundary line of former sorghum (left) and wheat (right) crop strips that simultaneously occupied the field a year prior to seeding to a native grass mix under the CRP. The tall light colored grass on the sorghum side is western wheatgrass, and darker colored kochia (exotic annual weed) dominates the wheat side.
aboveground plant community structure and production data in response to grazing by large and small herbivores and the persistence of SGS to interactions between a fluctuating environment and shifts in grazing pressures.
Finally, this CRP study has already resulted in a potential breakthrough in restoration of native grasses in this drought-prone environment, where re-seeding failures are common. An allelopathic cover-crop (sorghum) in contrast to replanting wheat cover-crops prior to grass seeding had dramatic effects on successful weed control and establishment of native grasses (Figure D3). Collection of plant community structure and productivity, and soil erosion and carbon data continues on this and adjacent old CRP and native SGS fields.
3.) Physiography
Based on extensive studies of soil development we understand the following about the Pedology of the SGS. In water limited systems areas such as the SGS, there are three broad phases of soil
development that are linked to the landscape ages identified above (Kelly et al In Prep).
Pedology and Ecohydrological Dynamics in the Short grass Steppe
Phase I, the Aggrading or Building Stages in which soil development begins with a new substrate deposited by
Alluvial and Aeolian processes or exposed sedimentary rocks. The soils are generally weakly developed and although mineral transformations have occurred the soil is genetically simple (little horizon
differentiation with surface and subsurface materials being pedogenically and hydrologically similar.
Phase II, the Intermediate or Equilibrium Stage during which the formation and clay and CaCO3 become
dominate features in the soil profiles and there is significant pedological and hydrological differentiation between surface and subsurface horizons. Clay particles that form as secondary minerals within the soil also retain relatively mobile ions like Ca, Mg, and K by ion exchange. Phase III, the Degrading or Declining Stage in which the most weatherable primary minerals have been transformed into secondary
forms. In this stage of development soils experience losses of clay (relative to soils in the intermediate stages of development) and complete removal of CaCO3 is apparent. Pedological and hydrological
differentiation is at a maximum and the systems capacity to store water is likely diminished.
Work Completed: This year we completed our pedon sampling across a chronosequence (Jenny, 1940, 1980) to evaluate pedological and landscape scale controls on water storage and distribution. With the help (and support) of the USDA-NRCS we sampled and additional 12 pedons this summer across the three generalized landscapes (e.g. Phases I, II, II) and have hired a student supported by non-LTER funds (Martin and Kelly are co-advising Mr Shawn Salley) to complete the Chloride Mass Balance (CMB) analyses on the samples collected in 2009 and 2010.
On the SGS LTER, plant spatial and temporal variability in soil moisture levels are likely to be powerful predictors of primary production. Measurement of soil moisture on the small scale is possible from soil sampling or from the deployment of TDR probes, but extrapolation to the landscape scale is difficult due to differences in soil properties (e.g., texture, topography) and because summer convective rainstorms create ephemeral “streaks” of moisture across the SGS landscape. Synthetic Aperture Radar (SAR) is a remote sensing tool that offers the capacity to visualize spatial and temporal patterns in the SGS LTER soil moisture at the landscape scale. Pixel sizes are on the order of 100m, and a single scene covers >30% of our site’s 84,000 ha. As part of our effort to extend scientific investigation to the landscape scale, we have initiated a collaboration through a subcontract with Dr. Nancy French at the Michigan Tech Research Institute. French and her colleague Laura Chavez have begun analysis of existing SAR scenes, which reveal distinct soil moisture features including those resulting from land use, soil properties, and convective rain events. The subcontract will support further analysis of these and additional scenes to provide data on soil moisture at the landscape scale. Our long-term goal is to apply the existing DayCent model at the landscape scale, and to use the SAR-based soil moisture data, coupled with soil maps, digital elevation maps, and NDVI data to generate dynamic understanding of the SGS landscape.
4.) Modeling, Synthesis and Cross-site Analyses
Development of broadly useful analytical and simulation model is one of the recognized strengths of the SGS LTER project, e.g. worldwide use of the DayCent ecosystem models and analyses of food web stability. Work also continues on landscape-level models to examine habitat suitability (e.g. for prairie dogs) and classical metapopulation models for prairie dogs that include local extinctions (due to plague) and recolonization. In all cases, we use data from SGS LTER measurements to parameterize and/or validate the models.
Modeling and Analysis
Daily net ecosystem carbon dioxide (CO2)
exchange (NEE) was measured on SGS vegetation at the USDA Central Plains Experimental Range in northeastern Colorado from 2001-2003. Over 95% of the growing season (April-October) carbon uptake
occurred during the April-June time period for the normal precipitation years 2001 and 2003 (Figure M1a), while carbon uptake during the same April-June time period was low in the dry year 2002 with more carbon uptake occurring during July-October. July-October daytime NEE (NEEd) was negative for all
three years, with the highest net carbon uptake occurring in 2003. Nighttime growing season net carbon loss (Figure M1b) was lowest during the non-growing season and similar for the May-June and July-October time periods.
Impact of Precipitation Seasonality and Pulses on NEE for the Short Grass Steppe
Large precipitation events (> 10.0 mm day-1) promoted carbon uptake, while small
precipitation events (< 5.0 mm day-1)
enhanced heterotrophic respiration and resulted in a net loss of carbon from the system. Large precipitation events enhanced carbon uptake because they increased soil water content which promotes plant photosynthesis. Live aboveground plant biomass and soil water content were the major variables that controled daytime net CO2
uptake (NEEd) and nighttime respiration losses (NEEn). NEEd and NEEn were positively correlated to the
live plant biomass. These results suggest that the major factor controlling growing season nighttime respiration flux is the amount of carbon fixed via photosynthesis during the day. Heterotrophic soil respiration is greatly enhanced for one to two days following rainfall events. A regression model was developed to simulate daytime and nighttime net carbon exchange as a function of soil water and temperature and live plant biomass (r2 = 0.76).
NutNet examines interactive roles of bottom-up and top-down controls on structure and function of grassland systems around the world through a coordinated network of more than 50 grassland sites in 11 countries. Individual sites apply a multiple nutrient addition experiment crossed with large and small vertebrate herbivore exclosures. NutNet at the SGS allows us to examine multiple resource limitations and consumers on plant production and diversity at multiple scales: within the SGS, along a three site Great Plains precipitation gradient (SGS, mixed grass prairie, and tallgrass prairie at KNZ LTER), and
Nutrient Network (NutNet) at the SGS
Figure M1. Annual April-June, July-September, and October-April NEE for daytime fluxes (a), nighttime fluxes (b), and net fluxes (c), for 2001, 2002, and 2003. The convention for fluxes is that negative values indicate C uptake, positive values indicate C efflux.
across grassland systems globally. Overarching research objectives include: A.) effects of single or multiple nutrients; B.) control of herbivory, nutrients and interactions; C.) extent of spatial variation among sites.
NutNet is exploring the fundamental role of top down versus bottom up controls on grassland structure and function. The goal is to examine relative strength of these controls and their interactive effects at a range of scales. In terms of global change the experiment aims to mimic anthropogenic alterations of nutrient inputs to ecosystems along with the type and intensity of consumers. The
collaborative NutNet Great Plains gradient allows examination of top down versus bottom up responses on different North American grassland systems and whether responses are generalizable at the regional scale. We are also addressing important questions lie the potential for shrub encroachment under nutrient enhancement across a precipitation gradient. The greatest strengths of NutNet are both the number and the geographic breadth of sites that are conducting this common experiment. Findings from NutNet will be applicable to grassland systems as they undergo the stresses imposed by global changes, including altered nutrients, consumers and climatic conditions.
NutNet was established at the SGS LTER during the summer of 2007, when we collected baseline data on plant and soil characteristics, with nutrient additions beginning in 2008. the yearly cycle of fieldwork includes erecting grazing exclosures in May and removing them in September (since they can act as snow fences); adding nitrogen, phosphorus and potassium, in all factoral combinations, to the plots in May; and monitoring species composition, aboveground biomass and light availability.
We collaborate with Dr. Melinda Smith, from Yale University and the Konza Prairie LTER site, and her PhD student, Kimberly LaPierre, who is a NSF Graduate Research Fellow. LaPierre is examining nutrient and grazing effects on grasslands across the tallgrass prairie in Konza, the mixed grass prairie in western Kansas, and the shortgrass site in Colorado. In addition to the measurements at the SGS, LaPierre is examing soil nutrients, plant traits, plant and invertebrate tissue chemistry, and invertebrate diversity and density. In spring 2010, La Pierre and Laura Dev, a PhD student from Colorado State University, conducted a shrub encroachment study across the Great Plains gradient by transplanting shrub seeds and seedlings into a subset of the NutNet sites. In early summer 2010, we joined a litter
decomposition experiment, led by Dr. Sarah Hobbie from the University of Minnesota. Graduate student Dev has been exploring PhD work that would examine how precipitation seasonality (growing season versus non growing season precipitation regimes) alters the effect of nutrients and grazing on community structure. In August 2009, SGS scientist Cynthia Brown participated in network-level synthesis
Literature Cited
Antolin, M.F., L.T. Savage, and R.J. Eisen. 2006. Landscape features influence genetic structure of black-tailed prairie dogs (Cynomys ludovicianus). Lands. Ecol. 21: 867–875
Augustine, D.J. M.R. Matchett, T.P. Toombs, J.F. Cully Jr., T.L. Johnson, J.G. Sidle. 2008. Spatiotemporal dynamics of black-tailed prairie dog colonies affected by plague. Lands. Ecol. 23:255–267.
Augustine, D. J., and D. G. Milchunas. 2009. Effects of prescribed burning on grazed shortgrass steppe. Rangeland Ecology and Management 62:89-97.
Bakker, E. S., M. E. Ritchie, H. Olff, D. G. Milchunas, and J. M. H. Knops. 2006. Herbivore impact on grassland plant diversity depends on habitat productivity and herbivore size. Ecology Letters 9:780-788.
Bakker, E. S., J. M. H. Knops, D. G. Milchunas, M. E. Ritchie, and H. Olff. 2009. Grazer impact on nitrogen cycling along a grassland productivity gradient. Oikos (accepted).
Blecker, S.W., R.L. McCulley, O.A. Chadwick, and E.F. Kelly. 2006. Silica biogeochemistry in grassland ecosystems of the Great Plains. Global Biogeochemical Cycles. 20: GB3023
Burke IC, Yonker CM, Parton WJ, Cole CV, Flach K, Schimel DS. 1989. Texture, climate, and cultivation effects on soil organic-matter content in US grassland soils. Soil Science Society of
America Journal 53: 800-805.
Burke, I.C., A.R. Mosier, P.B. Hook, D.G. Milchunas, J.E. Barrett, M.A. Vinton, R.L. McCulley, J.P. Kaye, R.A. Gill, H.E. Epstein, R.H. Kelly, W.J. Parton, C.M. Yonker, P. Low, and W.K. Lauenroth. 2008. Soil Organic Matter and Nutrient Dynamics of Shortgrass Steppe Ecosystems. Pages 306-341
in W.K. Lauenroth and I.C Burke, eds. Ecology of the Shortgrass Steppe: A Long Term Perspective.
Oxford Univ. Press, N.Y.
Burke IC, Yonker CM, Parton WJ, Cole CV, Flach K, Schimel DS. 1989. Texture, climate, and cultivation effects on soil organic-matter content in US grassland soils. Soil Science Society of
America Journal 53: 800-805.
Coffin, D.P., W.K. Lauenroth, and I.C. Burke. 1996. Recovery of vegetation in a semiarid grassland 53 years after disturbance. Ecological Applications. 6:2 538 - 555
De Ruiter, P.C., J.A. van Veen, J.C. Moore, L. Brussared, and H.W. Hunt. 1993. Calculation of nitrogen mineralization in soil foodwebs. Plant and Soil. 157: 263 - 273
Epstein, H.E., I.C. Burke, and W.K. Lauenroth. 1999. Response of the shortgrass steppe to changes in rainfall seasonality. Ecosystems. 2: 139 - 150
Fischer A. l994a. A simple model for the temporal variations of NDVI at regional scale over agricultural countries. Validation with ground radiometric measurements. Int. J. Remote Sensing, 15, 1421-1446. Fischer A. l994a. A simple model for the temporal variations of NDVI at regional scale over agricultural countries. Validation with ground radiometric measurements. Int. J. Remote Sensing, 15, 1421-1446. FischerA. (1994b) A model for the seasonal variations of vegetation indices in coarse resolution data and
its inversion to extract crop parameters. Remote Sensing Environ. 48, 220--230.
Guenther, D.A. and J.K. Detling. 2003. Observations of cattle use of prairie dog towns. Journal of Range
Management. 56: 410 - 417
Hart, R.H. 2008. Land-use history on the shortgrass steppe. Pages 55-69 in W.K. Lauenroth and I.C Burke, eds. Ecology of the Shortgrass Steppe: A Long Term Perspective. Oxford Univ. Press, N.Y. Hartley LM, Detling JK, Savage L. 2009. Introduced plague lessens the effects of an herbivorous rodent
on grassland vegetation. J. Applied Ecology 46: 861-869.
Heisler-White, J.L., J.M. Blair, E.F. Kelly, K. Harmoney and A.K. Knapp. In press. Contingent productivity responses to more extreme rainfall regimes across a grassland biome. Global Change
Hunt, H.W., D.C. Coleman, E.R. Ingham, E.T. Elliott, J.C. Moore, S.L. Rose, C.P.P. Reid, and C.R. Morley. 1987. The detrital food web in a shortgrass prairie. Biological Fertility of Soils. 3: 57 - 68 Ihori, T., I.C. Burke, W.K. Lauenroth, and D.P. Coffin. 1995. Effects of cultivation and abandonment on
soil organic matter in northeastern Colorado. Soil Science Society of America Journal. 59: 1112 – 1119.
Knapp, A. K., C. Beier, D. D. Briske, A. T. Classen, Y. Luo, M. Reichstein, M. D. Smith, S. D. Smith, J. E. Bell, P. A. Fay, J. L Heisler, S. W. Leavitt, R. Sherry, B. Smith and E. Weng. 2008. Consequences of more extreme precipitation regimes for terrestrial ecosystems. Bioscience 58:811-821.
Lauenroth, W.K., D.G. Milchunas, O.E. Sala, I.C. Burke, and J.A. Morgan. 2008. Net primary production in the shortgrass steppe. Pages 270-305 in W.K. Lauenroth and I.C. Burke, eds. Ecology of the Shortgrass Steppe: A Long Term Perspective. Oxford Univ. Press, NY.
Lauenroth, W. K. and O. E. Sala. 1992. Long-term forage production of North American shortgrass steppe. Ecological Applications. 2: 397 - 403
McClintock, B., T., G. C. White, M. F. Antolin and D. W. Tripp. 2009. Estimating abundance using mark-resight when sampling is with replacement or the number of marked individuals is unknown.
Biometrics. 65:237 246
Milchunas, D. G. 2009. Estimating root production: comparison of 11 methods in shortgrass steppe and review of biases. Ecosystems 12:1381-1402.
Milchunas, D.G., A.R. Mosier, J.A. Morgan, D. LeCain, J.Y. King,and J. A. Nelson. 2005. Root
production and tissue quality in a shortgrass steppe exposed to elevated CO2: Using a New Ingrowth Method. Plant Soil. 268: 111 – 122
Milchunas, D.G., W.J. Parton, D.S. Bigelow, and D.S. Schimal. 1988. Factors influencing ammonia volatilization from urea in soils of the shortgrass steppe. Journal of Atmospheric Chemistry. 6: 323 - 340
Milchunas, D.G., W.K. Lauenroth, I.C. Burke, and J. Detling. 2008. Effects of grazing on vegetation. Pages 389-446 in W.K. Lauenroth and I.C. Burke eds. Ecology of the Shortgrass Steppe: A Long Term Perspective. Oxford Univ. Press, NY.
Moore, J.C., J. Sipes, A.A. Whittemore-Olson, H.W. Hunt, D.W. Wall, P.C. de Ruiter, and D.C. Coleman. 2008. Trophic structure and nutrient dynamics of the belowground food web within the rhizosphere of the shortgrass steppe. Pages 248-269 in W.K. Lauenroth and I.C. Burke. Ecology of the Shortgrass Steppe: A Long Term Perspective. Oxford Univ. Press, NY.
Morgan, J.A., D.G. Milchunas, D.R. LeCain, M.S. West, and A. Mosier. 2007. Carbon dioxide
enrichment alters plant community structure and accelerates shrub growth in the shortgrass steppe. Proc. Nat. Acad. Sci 104(37):14724-14729.
Peters, D.P.C., W.K. Lauenroth, and I.C. Burke. 2008. The role of disturbances in shortgrass steppe community and ecosystem dynamics. Pages 84-118 in W.K. Lauenroth and I.C. Burke. Ecology of the Shortgrass Steppe: A Long Term Perspective. Oxford Univ. Press, NY.
Rooney, N., K. McCann and J.C. Moore. 2008. A landscape theory for food web architecture. Ecol. Lett..
11: 867 – 881
Sala, O.E., W.K. Lauenroth, and W.J. Parton. 1992. Long-term soil water dynamics in the shortgrass steppe. Ecology. 73:4 1175 - 1181
Sala, O.E. and W.K. Lauenroth. 1985. Root profiles and the ecological effect of light rain showers in arid and semiarid regions. American Midland Naturalist. 114: 406 - 408
Sala et al 1988 THERE ARE TWO CHOICES IN SGS LTER DATA BASE:
Sala, O.E., M.E. Biondini, and W.K.Lauenroth. 1988. Bias in estimates of primary production: an analytical solution. Ecological Modeling. 44: 43 – 55
Sala, O.E., W.J. Parton, L.A. Joyce, and W.K. Lauenroth. 1988. Primary production of the central grassland region of the United States: Spatial pattern and major controls. Ecology. 69: 40 - 45
Sangster, A.G., and M.J. Hodson. 1986. Some factors influencing silica transport and deposition in grasses. Am J Botany 73(5):642-643
Scheintaub, M., Derner, J.D., Kelly, E.F. and A.K. Knapp. 2009. Response of the Shortgrass Steppe to fire. Journal of Arid Zone Research.
Stapp, P., M.F. Antolin, and M. Ball. 2004. Patterns of extinction in prairie dog metapopulations:plague outbreaks follow El Nino events. Front. Ecol. Environ.. 2: 235 - 240
Stapp, P. 2007. Rodent communities in active and inactive colonies of black-tailed prairie dogs in shortgrass steppe. Journal of Mammalogy. 88: 241 – 249
Stapp, P., B. Van Horne, M.D. Lindquist. 2008. Ecology of mammals of shortgrass steppe. Pages 132-180
in W.K. Lauenroth and I.C. Burke. Ecology of the Shortgrass Steppe: A Long Term Perspective.
Oxford Univ. Press, NY.
Stapp, P., D.J. Salkeld, H. Franklin, J. Kraft, D.W. Tripp, M.F. Antolin, & K.L. Gage. 2009. Evidence for the involvement of an alternate rodent host in the dynamics of introduced plague in prairie dogs.
Journal of Animal Ecology. 78: 807 - 817
Tripp, D.W., K.L. Gage, J.A. Montenieri, & M.F. Antolin. 2009. Flea abundance on Black-tailed prairie
dogs (Cynomys ludovicianus) increases during plague epizootics. J. Vector-Borne and Zoonotic Diseases 9(3): 313-321.
Wilder , A.P., R.J. Eisen, S.W. Bearden, J.A. Montenieri, D.W. Tripp, R.J. Brinkerhoff, K.L. Gage, and M.F. Antolin. 2008a. Transmission efficiency of two flea species (Oropsylla tuberculata cynomuris and Oropsylla hirsuta) involved in plague epizootics amoung prairie dogs. Ecohealth. 5: 205 – 212. Wilder , A.P., R.J. Eisen, S.W. Bearden, J.A. Montenieri, K.L. Gage and M.F. Antolin 2008b. Oropsylla
hirsuta (Siphonaptera : Ceratophyllidae) can support plague epizootics in black-tailed prairie dogs (Cynomys ludovicianus) by early-phase transmission of Yersinia pestis. Vector-Borne and Zoonotic Diseases 8(3):359-367.
B.)
Information Management 2010 -Nicole Kaplan, Information Manager and Bob Flynn,
GIS and IT Manager
The SGS-LTER Information Management Team (IM Team) works with SGS-LTER Researchers to plan and prioritize information management activities and design systems to support data and metadata integration and knowledge production. We work closely with SGS and other LTER site researchers and graduate students on improving data quality, performing data aggregation and synthesis, developing and implementing LTER standards and keywords, as well as conducting spatial analysis of our long-term datasets. Collaboration technology has allowed us to facilitate communication for coordinating our research activities, reporting findings, and discussing issues. Analytical tools on our website monitor use and data access allowing us to assess how our on-line interfaces are able to meet the needs of the broader community, as well as help to design improvements. We also continue to participate in various LTER Network-wide and cross-site efforts and have contributed to the SGS-LTER 2010 Renewal Proposal, the LTER Strategic Plan, and LTER Strategic Communications Plan.
The IM Team continues to improve access to information and data online
(http://sgslter.colostate.edu), through the creation of level 5 compliant metadata in EML (Ecological
Metadata Language) and through building additional relationships within the database between metadata, data products, and our scientific understandings of site-based processes. The SGS-LTER website has been enhanced to enable users to access information and data from several related sections so discovery requires fewer clicks. We serve maps that provide useful site features, such as historical grazing treatment information, and geospatial visualizations that illustrate time-animated habitat changes for prairie dogs. Users may also customize their own maps using an interactive mapping application called ArcGIS Server. The persistent menu on the new website allows users to access tabular datasets and publications from various sections of the website. We have harvested 66 level 5 EML data packages over the past year into the LTER Metacat, a metadata catalog accessible by the broader ecological community to facilitate data discovery and access. We have taken the approach of prioritizing procedures to
integrate, clean, standardize and load our long-term, core datasets and metadata for on-line access on the SGS-LTER website and harvest to the LTER Metacat. This approach produces high quality datasets and metadata spanning a longer temporal record to support analysis of long-term trends, and requires input from principal investigators to identify and document important tacit details related to the long record of metadata and data. Next steps for the database and website include creating more links between related information in the system and more automated methods for documenting and generating EML to replace the current manual processes. Staff and researchers contribute content regularly to the news and events sections of the website, which were designed to share current activities, accomplishments, and exciting findings. We have also added a new 1.5 terrabyte external drive to our cyberinsfrastructure, which was installed off-site from our SGS-LTER database, web and file server and will extend our back-up and archival capabilities.
We implemented tools locally to collect and analyze information about end-users’ downloading of specific datasets as well as to report a broader overview of people and machines visiting the website. The SGS-LTER data access tracking tools allow us to record data downloads for various user requirements, such as making an inquiry into how our online data access system works, conducting college coursework and scientific research, and applying data to GK-12 education or conservation efforts. Eighty-nine individuals registered themselves on the local system and 80 of them downloaded at least one dataset. There have been a total of 195 downloads of data since July 2009 including data from long-term
monitoring of primary production, meteorology and physiography at the shortgrass steppe research site. The Google Analytics which we recently activated on our website, provides us with different
information about our visitors, including from where and how they are visiting the site. Most of our visitors are from Colorado, but we have visitors from every state in the United States, as well as from 110 other countries or territories. We also can see people are visiting mostly from our home institution, CSU, but many come from across 73 colleges and 262 universities, as well as government agencies such as the USDA, US Forest Service, National Park Service and National Science Foundation. Google Analytical
tools give us a broad overview of users as well as the ability to drill down to report on more specific characteristics and behaviors of visitors.
We are integrating long-term datasets from the SGS-LTER and other sites across the Network to support analysis of long-term records of plant production, species composition, and meteorological measurements in disturbed, grazed and burned areas to describe dynamics occurring at larger temporal and spatial scales. Our existing GIS programs for analysis of SGS-LTER data involve studying the movement of swift fox, visualizing precipitation patterns across the greater region of the shortgrass steppe, and modeling soil properties using satellite imagery. We completed digitizing, attribute labeling, and integrating data collected over thirteen years for our “chart quadrat” project which seeks to analyze growth patterns of individual plants recorded with a pantograph within a square meter permanent quadrat located within various grazing treatments. Researchers are applying these data to projects that analyze the survival and life span of herbaceous plants, model the influence of climate variability on population growth, model species interactions, and test coexistence theory.
We also implemented new technologies to support collaborations between SGS-LTER scientists, staff and students, and with our partners at other agencies and colleagues across the network. We created a Video Teleconferencing (VTC) work station at our SGS-LTER field station, allowing those working in the field to stay in touch with colleagues. We are able to support VTC with up to four units on campus using local equipment in the Natural Resources Ecology Lab. In addition, researchers are planning and discussing progress of new pulsed precipitation experiments in a blog that we implemented with controlled access using WordPress.
Bob Flynn participates in cross-site working groups, including the MALS and Land Fragmentation projects. Nicole Kaplan continues to participate in Network level leadership activities. She finished a three-year term as co-chair of the IM Committee and is now leading an Information Management Committee governance working group. Bob and Nicole attended several workshops at the 2009 All Scientists Meeting and led a workshop on the Grasslands Data Integration project, a data system for integrating species level long-term net primary production data from several grassland LTER sites. She also attended the 2010 Science Council meeting and participated in strategic planning activities for education and outreach, and communications for the LTER network.