Organochlorine pesticide residue levels in soil from the Nyando River Catchment,
Kenya
ABONG'O Deborah Atieno 1,a*, WANDIGA Shem Oyoo 1,b,*, JUMBA Isaac Ogangu 1,c, Van den BRINK Paul J. 2,d, NAZARIWO Betty Bbosa3,e, MADADI Vincent Odongo1,f, WAFULA Godfrey Angoe1,g, KYLIN Henrik 4,h, NKEDI-KIZZA Peter5,i.
1College of Biological and Physical Sciences, School of Physical Science, Department of Chemistry, University
of Nairobi, P.O. Box 30197-00100, Nairobi, Kenya.
2 Wageningen University, Aquatic Ecology and Water Quality Management Group, Wageningen University
and Research Centre, P.O Box 47, 6700 AA Wageningen. The Netherlands
3Department of Chemistry, Makerere University, P.O. Box 7062, Kampala, Uganda.
4Department of thematic studies – Environmental Change, Linköping University, SE-581 83 Linköping,
Sweden
5Soil and water science department, 20169 Mc Carty Hall, University of Florida, USA
adabongo@uonbi.ac.ke*, bwandigas@uonbi.ac.ke*, cijumba@uonbi.ac.ke, dpaul.van de Brink@wur.nl, ebnaziriwo@yahoo.co.uk, fvmadadi@uonbi.ac.ke, ggwafula@uonbi.ac.ke, hhenrik.kylin@liu.se,
ikizza@ifas.ufl.edu
ARTICLE INFO ABSTRACT
Article History:
Available online 31 July 2015
Soil samples were collected from six locations representative of the Nyando River catchment area of the Lake Victoria over a period of two years. Sampling was done four times in the year in February, May, September and December 2005 and 2006 in farms where maize, tea, sugar cane, coffee, rice and vegetables have been grown over the years. This coincided with the effects of different seasons and farming activities on residue levels of the pesticides in use. The objective was to investigate levels and distribution of organochlorine pesticides that have either been banned or are restricted for use in Kenya. Organochlorine pesticides investigated were DDT, lindane, aldrin, dieldrin, heptachlor, endrin, endosulfan (both α- and β- isomers and endosulfan sulphate), the sum is called “total” or ∑endosulfan and methoxychlor. Prior to the ban or restriction in use, these pesticides had found wide applications in public health for control of disease vectors and in agriculture for control of crop pests. The analysis revealed presence of all the targeted pesticides with the highest mean concentrations for methoxychlor 138.97±1.517 µg/kg, ∑endosulfan (30.267±2.098µg/kg), aldrin (18.317±0.276 µg/kg), respectively. The results show the presence of these pesticides in soils in the basin and this could be impacting negatively on the ecosystem health of the area.
©2015 Africa Journal of Physical Sciences (AJPS). All rights reserved.
ISSN 2313-3317
Keywords: Soil
Pesticide residue level River Nyando
Farming Lake Victoria
19 | P a g e 1. Introduction 1.1 Background
The recent endorsement of the international “Stockhom Convention” (SC) on Persistent Organic Pollutants (POP) signed in Stockholm, Sweden, in 2002. At the start the SC specifically banned the use of or unintentional release of “the dirty dozon”, including nine chlorinated pesticides, viz Dichlorodiphenyl-1, 1, 1-trichloroethane (DDT), lindane (γ-hexachlorocycohexan [γ-HCH]), aldrin, endrin, dieldrin, chlordane, heptachlor, toxaphane, mirex and hexachlorobenzen (HCB), one chemical for industrial use viz polychlorinated biphenyls (PCB) and polychlorinated dibenzo-p-dioxins and polychlorinated dibenzofurans produced as by-products during incineration. The SC has a mechanism for banning additional chemicals and has recently included, e.g., hexachlorocyclohexanes (HCHs) and nine other (POPs). The SC became international law on 17 May 2004 (http://chem.pops.int/default.aspx) and has focused the attention of governments on the need to formulate practices on the elimination, restriction in use and management of POPs in the environment.
Despite the official ban or restriction on these pesticides in Kenya, they are still being detected in the environment [1, 2]. Currently the use of some of the organochlorine compounds is allowed under the convention, for health purposes. For example, lindane is a traditional component of lotion, creams and shampoos for the control of lice and mites in humans and in veterinarian products against ectoparasites [3]. DDT is used in the public health sector for malaria vector control. Environmental fate of these pesticides has become an issue in Kenya and many developing and developed countries. The World Health and Food and Agriculture Organizations have developed standards for residue limits in food, drinking water supplies, as well as export products such as fish, fruits and horticultural produce [4]. Due to their environmental and health implications, there is a need to monitor their residue levels at selected sites. Within the Kenyan Lake Victoria basin, pesticides and fertilizers have been increasingly used to boost agricultural production in large-scale farms within the vast catchment [2, 5]. Increased run-off laden with pesticides and fertilizers from these farms is inevitably finding its way into the lake through the rivers draining the basin. Pesticides have also been reportedly used for killing bird pests [6] and in fishing [7]. In May 1999, press reports indicated that fish were allegedly being harvested from the lake by use of endosulfan an organochlorine insecticide. This resulted in the imposition of a fish import ban by the European Union (EU) on all fish from Lake Victoria. Commercial fishing activity around the lake and subsequently the economies of the three riparian countries were greatly affected as a result [8]. Despite the ban on the use of Dichlorodiphenyl-1, 1, 1-trichloroethane (DDT), and other organochlorine pesticides in most of the industrialized world, their use in the East Africa region has continued mainly for public health vector control. Inevitably the residues are finding their way into the lake waters [9; 10].
A number of laboratory studies have been carried out on DDT, DDE and lindane to establish the behaviour of their residues in soil [11]. The half-lives of the pesticides studied showed faster dissipation rates under Kenyan tropical climate compared to the temperate climates [12]. Pesticide residues and their break down products have been found in increasing amounts in water, fish, weeds, soil and sediments from Lake Victoria basin in Kenya [10; 13]. The results from these studies have raised great concern, since total load could easily reach levels that are irreversibly damaging to the lake water. Other studies aimed at providing baseline information on the current levels of organochlorine pesticide residues in aquatic system of Lake Victoria showed high DDE/DDT ratios suggesting that widespread use of DDT has ceased, and significant use of lindane
20 | P a g e
and endosulfan within the Lake Victoria basin in Uganda [14, 15]. Despite the reported rapid degradation of some pesticides in Kenyan soil [16] the potential for bioaccumulation and bio-concentration of these pesticides pose serious ecological and health concerns for the environment [17]. Pesticide leaching or drainage from cultivated land into the surface waters and underlying ground water are a source of pollution because of their environmental mobility and persistence [5].
International cooperation on the environmental quality of the Lake has a long history because of its significance as a source of the River Nile.
More recently the countries that share the lake have joined with the international communities in efforts to manage and preserve its water resources, fisheries and environment. This research work was to fill the knowledge gap in the current research efforts going on in the Kenyan side of Lake Victoria. The objective of this study was to investigate the pesticides use and determine the residue levels of selected organochlorine pesticides that have either been banned or restricted. Special focus was given to the Nyando River catchment area, one of the major drainages to Lake Victoria.The River formally traverses the three districts which are major agricultural and industrial zones in the Eastern Kenya. This coupled with the fact that Nyando watershed has been identified as a major source of sedimentation and nutrient flow into Lake Victoria [5] justifies the choice of the basin for the study.
1.2 The study area, climate, population and land use
The Nyando drainage, has a catchment area of 3450 km2, a total length of 170 km and lies
between 0˚25’S to 0˚10’N and 34˚ 50’W to 35˚50’E. The climate is sub-humid with a mean annual temperature of 23 ˚C and the mean annual rainfall of 1360 mm that varies from 1000 mm near Lake Victoria to over 1600 mm in the highlands [18]. The annual rainfall has a bi-model pattern with peaks during the long rains (April-May) and short rains (October-December). The rainfall is controlled by north and southward movement of the Inter-Tropical Convergence Zone (ITCZ) during the dry seasons (January-March). The population of Nyando is about 746,000, an average population density of 214 persons km-2, and a population growth of about 3.2 % yr-1 [19]. High
livestock densities are common throughout the catchment. The forests are being cleared for charcoal burning and to increase arable land; wetlands are also drained to increase arable land. Small-scale subsistence maize, sorghum and rice farming characterize the lower part of the watershed and the lake plains. At higher altitudes, there are large and small-scale sugar plantations, coffee and tea estates and relatively large-scale maize and horticulture [2]. Flooding is therefore a common occurrence and the area suffers from periodic inundation, particularly after heavy rains in the adjacent escarpments and hills. There is wide spread land degradation throughout the Nyando River basin that currently affects an estimated 39.5-52.9% of the area [5]. The arable soils in the Nyando catchment are classified as sandy loam soil.
2. Materials and methods 2.1 Sampling Sites and Plan
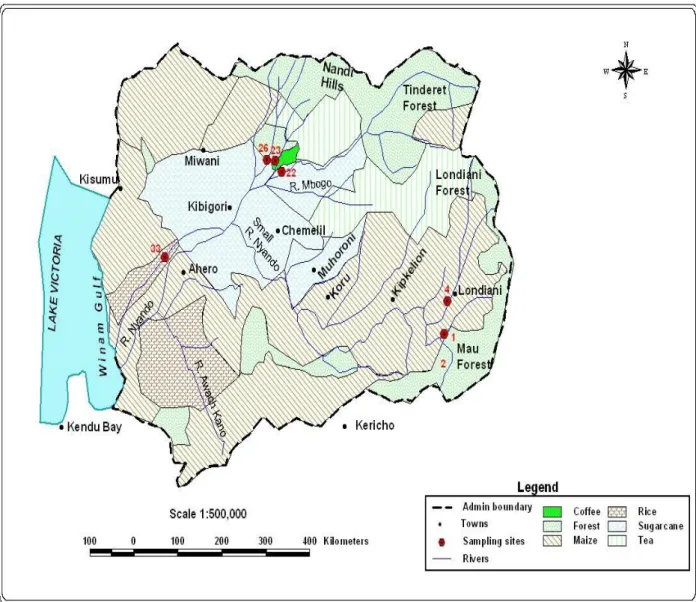
The Nyando River has two main tributaries, small Nyando River (Kericho- upper Nyando sub-catchment) and Ainamotua River (Nandi-lower Nyando sub-sub-catchment). The Awach-Kano River, flows into the main Nyando River 15 km downstream of the small Nyando-Ainamotua confluence (Figure 1). The Nyando basin drains major agricultural and industrial zones of Eastern Kenya.
21 | P a g e
The sampling sites were selected from farms where maize, tea, sugar cane, coffee, rice and vegetables have been grown over the years (Table 1). The Kericho-upper Nyando sub-catchment has sites 1 and 4 while the Nandi-lower Nyando sub-catchment has sites 22, 23, 26 and 33.
Figure 1: River Nyando catchment area and sampling sites
Soil samples (0-30 cm plough layers) were collected from six identified farms representative of the Nyando River catchment area over a period of two years (Fig. 1). The samples were collected from five different points from each of the farms, combined to make composite sample. The farms correspond to sites where various crops are planted (Table 1). Sampling was done four times in the year in February, May, September and December 2005 and in similar periods in 2006. This coincided with the effects of different seasons and farming activities on residue levels of the pesticides in use. Samples collected in February were mainly to capture the effects of the dry season when farmers plough the fields; some pesticides are applied to soil between February and March to kill soil dwelling pests in preparation for the planting season between March and April. Samples collected in May were to capture the effects of the long rain (wet) seasons on pesticides applied in the fields during ploughing and planting. Samples for September (short dry season) were to capture the effects of pesticides applied to the fields after the long rains while those collected in December were to capture the effects of short wet season when vegetables, cash crops and fruits are grown.
22 | P a g e
Table 1: Soil Sampling Sites in River Nyando Catchment Area
Site no.
Name GIS Position Altitude Human activities around the sites
N(+)/S(-) E (m)
1 Kedowa bridge -0.234° 35.545° 2290 Maize and tomatoes farms and depleted forest cover
4 Masaita at Londiani
Township -0.163° 35.584° 2290
Human settlement, maize and cabbage farms on river banks, cattle and sheep watering, raw domestic sanitation effluent discharge into the river
22 Anopsiwa +0.0300° 35.118° 1320 Large scale sugarcane farming, river sand harvesting and recreation
23 Anopngetuny -0.028° 35.118° 1330 Large scale coffee and sugarcane farming,
26 Kapngorium at
Bridge +0.054° 35.100° 1850
Human settlement, large scale tea farming, subsistence agriculture, raw effluent discharge from tea factory
33 Ahero irrigation
channel -0.172° 34.908º 1150
Irrigated rice farming, cattle watering and recreation
2.2 Materials and chemicals
The chemicals used were of analytical grade and were obtained from international suppliers, including Fisher Scientific (USA), Aldrich Chemical Company and BDH (United Kingdom). All the general purpose solvents (acetone and hexane), used were triply distilled before use. Other solvents i.e. diethyl either and HPLC grade hexane were not distilled as these were bought at 99% purity. Sodium chloride and activated charcoal were baked at 120˚C in a Mermmert oven for at least two hours and cooled in desiccators before use. Florisil and anhydrous sodium sulphate were activated at 350 ˚C and 200 ˚C respectively before use for the cleanup process [20].
2.3 Qualitative Chaterization
Reference standards for the organochlorine pesticides obtained from Dr. Ehrenstorfer GmbH Company (Germany) were used for identification by injecting (1 µL) into the Varian Chrompack CP-3800 Gas Chromatograph (GC) under the following conditions: non polar column: CP-SIL 8CB-15 m, 0.25 mm (ID), 0.25µm film; sample size:1µL split ratio 1:20; detector: 63Ni-Electron Capture
(ECD) at 300˚C; column temperature at 150˚C held for 1 minute then changed to 200˚C at 4˚C/min and finally to 300˚C at 4.5 ˚C/min; nitrogen carrier gas flow pressure was, 30 psi, and injector temperature was held at 250 ˚C. The polar column DB-1701-15 m, 0.53 mm internal diameter (id), 0.5µm film was also used to for the identification of standard solutions. Whenever retention times of the sample compounds and standards agreed on both the columns, and the calculated concentrations were about the same, the compound’s identity was ascertained. Data processing was done using Star Version 5.4. The resolution and identification were also confirmed using relative retention times obtained by measuring the retention time of each test analytes relative to that of parathion and comparing the result with published literature values.
23 | P a g e
2.4 Sample collection and extraction
For determination of pesticide residue levels, textures, moisture, pH, total organic carbon and organic matter contents, soil samples were collected from randomly selected locations within the farms adjacent to sites 1, 4, 22, 23, 26 and 33 along the river (Table 1). Characterizations were done at the National Agricultural Laboratory (NAL) based at Kenya Agricultural Research Institute (KARI), in Nairobi using the method [21].
All the pesticides were assumed to have been applied to the fields at rates recommended by the manufactures. Five sampling points were randomly selected within each farm. A soil core was dug using hoe and scooped using a spade down to the depth of 15-30 cm (for assessment of adsorption depth) from the five different locations within a farm and approximately 200 g of the scooped core taken. The cores were thoroughly mixed to give a composite sample. Four replicate samples of approximately 200 g were taken from the composite sample. Two of the replicate samples from each site were labeled Batch A. Each was wrapped in an aluminum foil, labeled, and placed in black plastic bag before transferring to a labeled self-sealing polythene bag and each placed in a plastic container with lid and stored temporarily in polyurethane cool-boxes prior to transportation to the laboratory for analysis and further storage. The other two replicates labeled Batch B were treated for field recoveries. They were placed in aluminium foil and spiked with 4 ml of 100 mg/kg of pesticide standard mixture (obtained from IoIc, Warsaw: Puder, Poland) and packed as was done for Batch A. In the laboratory, portions of unspiked samples were taken for characterization while the rest were stored at ≤ -19 ᵒC to wait for extraction and pesticide residue levels analysis this was done within 7 days. The samples were left to thaw overnight and air dried. Each dried samples was crushed and homogenized in mortar and pestle and sieved (250 µm mesh size). Triplicates (10 g) of each sample were thoroughly mixed with desiccant (10 g, anhydrous sodium sulphate activated at 110 ο C) to dry the soil samples before soxhlet-extraction (24 hours;
150 ml distilled acetone: hexane 1:1). The individual extracts were concentrated to about 10 ml using rotary evaporator.
2.5 Sample clean-up
The 10-ml extracts were cleaned up through a 60 cm long x 2 cm (id) fabricated glass columns packed with 15 g of activated florisil (magnesium silicate, 60-100 mesh size) and topped up with 4 g of activated anhydrous sodium sulphate (dry agent) and 1.5 g of activated charcoal as a decolourizer. The extracts were eluted through the columns at a flow rate of 3 ml/min using 200 mL of 6%, 15% and 50% of diethyl ether in HPLC grades hexane. The eluents were combined and concentrated to 1ml in rotary evaporator at 40˚C, transferred to graduated tubes, reconstituted in a 5 ml HPLC grade n-hexane, reduced further to 5 ml using a stream of nitrogen gas and taken for GC analysis using the conditions set above. The matrix blanks and laboratory recovery samples were extracted at the same time with the actual samples. 10 g of activated anhydrous sodium sulphate was placed in the thimble and extraction procedures followed as for soil samples. While for the recovery analysis, triplicate 10g portions of soil samples thought to be free from pesticide residues (from the University of Nairobi’s Chiromo Campus) were spiked with 0.1 ml, 0.2 ml, 0.4 ml and 0.6 ml of 100 mg/kg of a mixture of the pesticide standards. Each spiked sample was homogenized for even distribution of pesticide residues and stored in deep freezer overnight to attain equilibrium. Recovery samples were also extraction following the procedures as for the field samples. The identified retention times, were confirmed by running the samples on the two different columns used above with different stationary phases. Whenever retention times of the sample analytes agreed on both of the columns, and the calculated concentrations were about the same, the compound’s identity was ascertained.
24 | P a g e
Where necessary, the resolution and identification were also confirmed using relative retention times obtained by measuring the retention time of each test analyte relative to that of parathion and comparing the result with published literature values.
2.6 Data analysis
The data obtained was analyzed using statistical programme for social scientists (SPSS) to establish relationship between pesticide residue levels in the samples from different sampling sites and the sampling seasons. Bivariate correlation coefficients were established using Pearson product moment correlation coefficient, “r”, dimensionless index, whose value is in the range -1.0≤r≤1.0 3. Results and discussion
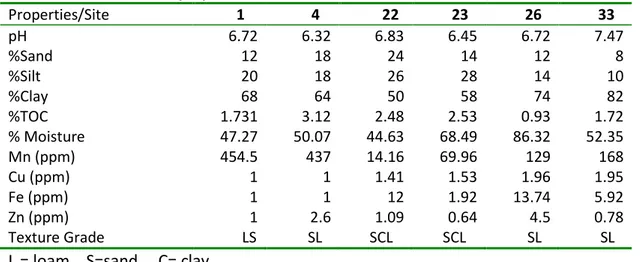
All soil samples had a high, clay content which varied between 50-82%. Silt content of the soil varied between 10-28% while sand varied between 8-24%. The total organic carbon (TOC) varied between 0.93-3.12 percent (Table 2). Soil contents of clay and organic carbon are the main factors that regulate pesticide retention capacity in the soil, with higher retention the more clay and organic matter soil contents.
Table 2: Soil texture and properties at various sites
Properties/Site 1 4 22 23 26 33 pH 6.72 6.32 6.83 6.45 6.72 7.47 %Sand 12 18 24 14 12 8 %Silt 20 18 26 28 14 10 %Clay 68 64 50 58 74 82 %TOC 1.731 3.12 2.48 2.53 0.93 1.72 % Moisture 47.27 50.07 44.63 68.49 86.32 52.35 Mn (ppm) 454.5 437 14.16 69.96 129 168 Cu (ppm) 1 1 1.41 1.53 1.96 1.95 Fe (ppm) 1 1 12 1.92 13.74 5.92 Zn (ppm) 1 2.6 1.09 0.64 4.5 0.78 Texture Grade LS SL SCL SCL SL SL L = loam, S=sand C= clay
All the pesticide analyzed in this study were banned in Kenya in 1986 except for aldrin, dieldrin, lindane, and DDT, the use of which at the time were restricted to the control of whose uses were at the time restricted to the control of termites in the building industry and in the public health for vector control [22]. Methoxychlor is not banned or restricted but was commonly used. The pesticide residue levels detected in the samples were not corrected since all recovery values were within the acceptable range of 70-120% [23]. The mean recovery levels detected were as given in Table 3.
25 | P a g e
Table 3: Percent recoveries for the soils and Limits of Detection (LOD)
Compound % Recovery LOD
(µg/L)
Compound %Recovery LOD (µg/L) Aldrin 76.10±1.35 0.0040 lindane 85.77±3.58 0.0016 dieldrin 96.42±2.91 0.0035 methoxychlor 92.16±0.41 0.0016 endosulfan Sulphate 86.40±2.36 0.0024 o,p-DDT 90.13±1.23 0.0016 α-endosulfan 92.03±0.99 0.0012 p,p-DDT 90.88±0.49 0.0015 β-endosulfan 84.81±0.88 0.0022 p,p-DDD 77.02±1.39 0.0017 Endrin 87.37±1.31 0.0024 o,p-DDE 86.09±2.22 0.0017 heptachlor 82.67±1.64 0.0012 heptachlor-epoxide 86.95±0.83 0.0012 an=3 mean ± standard deviation
February and September were considered dry seasons. Figures 2 and 3 show the average pesticide residue levels for the two months respectively.
26 | P a g e
Figure 3: Detected pesticide residue levels in September
The overall detection frequency (finds above the limit of detection) of the sixteen organochlorine pesticides in samples collected during the dry months of February and September were 53% and 38 % respectively. While the detection frequency during the wet months of May and December were 59% and 56% respectively. The number of residues levels detected was slightly higher in February than in September. The dry seasons showed strong positive Pearson correlation coefficients (P<0.01) of 0.991 and 0.989 in February and September respectively. The wet seasons had strong positive Pearson correlation coefficients (P<0.01) of 0.999 and 0.949 in May and December respectively. The wet seasons had percentage higher detection levels than the dry seasons. The results reveal that pesticide residue levels leached much more in the wet season than in dry. As expected, leaching of pesticide residue is higher during the wet season than the dry. This is, obviously due to the higher flow of water during the wet season. However, ecosystem effects will depend on not only the leaching but also the concentrations in the water. Although leaching is higher during wet than dry seasons, the absolute concentrations in the recipient waters may be lower during wet season due to higher dilution.
There was no aldrin detected in the soil samples in February and September from any of the sampling sites while in the wet seasons aldrin was detected at site 23 (4.444±0.051µg/kg) in May (Figure 4) while site 26 had mean value of 6.906 µg/kg (range BDL-14 µg/kg) and site 33 had a
27 | P a g e
value of 9.2 µg/kg (range BDL-18.317µg/kg) in December (Figure 5). The results show higher levels of aldrin in soil in December than in May.
Figure 4: Detected pesticide residue levels in May
28 | P a g e
Figure 5: Detected pesticide residue levels in December
Aldrin was detected at sites 4, 26 and 33 in fields in December. Due to its persistent nature and hydophobicity, aldrin is known to accumulate and/or bioconcentrate mainly as its conversion product dieldrin [24]. Dieldrin, a metabolite of aldrin was detected at a frequency of 20% from three sites (1, 26 and 33) in February and September (P<0.01). There is positive correlation in concentration of dieldrin in February at sites 1 (10.20±0.73µg/kg) and 33 (12±1.2µg/kg). The concentrations showed a decreasing trend in September. These results imply that dieldrin may have been applied directly to the three fields in February and does not originate from the degradation of aldrin. Dieldrin was detected in sites, 1, 23, 26 and 33. Site 1 showed the highest level (11±2.3µg/kg) followed by 23 (7.7±0.44µg/kg), in May. In December site 4 showed (range BDL-13.32 µg/kg) followed by 1 (range BDL-12.24µg/kg). May had higher residue levels than December. These results show that both aldrin and dieldrin are in use for controlling pests in the three sites.
Endosulfan sulfate which is a degradation product of endosulfan was detected in the soils from all the sampling sites in February and September.
29 | P a g e
However there was a stronger positive correlation in mean residue concentrations detected at sites 22 (1.468±0.223) and 23 (0.992±0.095) in February and sites 23 (1.978 ± 0.107) and 33 (1.451 ± 0.012) in September. Endosulfan (α-and β-endosulfan) was detected as β-endosulfan from all the sampling sites in February with site 26 having the highest mean concentration of 14.767±4.511µg/kg while site 1 had the lowest value of 0.310±0.017µg/kg. In September, β-endosulfan was only detected at site 26 with average value of 25.716±2.174µg/kg. These results show that endosulfan is in use in the Nyando drainage basin as β-endosulfan and endosulfan sulfate. During the wet seasons β-endosulfan was detected only at site 26 (range BDL-25.827 ± 0.496µg/kg) and (BDL-28.971± 0.553 µg/kg) in May and December respectively whereas α-endosulfan was not detected in the soil samples. The result shows that β-α-endosulfan was in use at site 26; however endosulfan sulfate was not in use but could be a degradation or aerial deposition product.
Endrin was detected in site 1 and 33 in February and not from any other site in September. Site 1 had mean concentration of 0.6 µg/kg (range BDL-1.2) and site 33 had a mean of 0.89µg/kg (range BDL-1.8 µg/kg). This result does not reveal any recent application of endrin in the fields; therefore amount detected in February could be as a result of previous use or atmospheric deposition. The residue was also detected at sites 1 (BDL-1.720 µg/kg) and 33 (BDL-2.117 µg/kg) in May and at sites 4 (2.7± 0.28µg/kg) and 33 (BDL-10 µg/kg) in December. Higher levels were detected in December than in May.
Heptachlor was not detected from any of the sites during the sampling periods. However its degradation product heptachlor epoxide was detected in sites 26 and 33 in February and not in September and in the same sites in May and December. The conclusion from the absence of heptachlor, but presence of its degradation product, must be that heptachlor has not been used in the area in recent times.
Hexachlorocyclohexane (HCH), formally known as Benzene Hexachloride (BHC) exists in eight isomers. In this study only gamma HCH (γ-HCH, commonly known as lindane) was monitored due to lack of pure standards for the other isomers. Lindane was detected in both February and September in three sites; 1, 26 and 33. In February, site 26 had the highest mean concentration of 3.9µg/kg (range BDL-7.765µg/kg). In September site 1 had highest mean concentration of 3.130µg/kg (range BDL-6.259 µg/kg). It was not detected in any of the sampling sites in May but was present in sites 4, 23 and 26 in December. Site 4 had the highest average value of 4.493µg/kg (range BDL-8.985±1.318 µg/kg). The compound may have been in use in December in vegetables, coffee and tea fields respectively.
The highest February level of methoxychlor was I detected at sites 4, 23, 26 and 33 while the highest September levels were found at in sites 4, 26 and 33 The levels detected in February were higher than those detected in September. Site 33 showed the highest mean concentration of (36.349±0.985µg/kg and 26 had higher mean value (19.652±0.920 µg/kg) in September. The methoxychlor is mostly used at sites 4, 26 and 33. The residue levels were detected from all the sampling stations in May and December. Site 26 showed the highest mean of 70.412µg/kg (range 1.853-138.970µg/kg) in May and highest level from site 1 (63.468µg/kg) in December.
According to Smith [26] the amount of methoxychlor in the environment is seasonal due to its periodic utilization in farming. Sprayed methoxychlor settles in the ground and degrades more rapidly in the soil that has supply of oxygen and therefore does not lead to significant
30 | P a g e
bioaccumulation; however it was important to monitor its illegal use along the River Nyando drainage basin.
p,p’-DDT and p,p’-DDD were detected at frequencies of 60% each in February. The concentration of p,p-DDT was highest at site 1 (6.094±0.442 µg/kg) in February and at site 33 (5.685±0.704 µg/kg) in September. In December, the highest levels of p,p-DDT and p,p-DDE were detected at site 33 (4.904 µg/kg) and (7.609µg/kg) respectively.
Studies by other researchers have also shown that aldrin and heptachlor were in higher concentration than their converted products [26, 27]. In this study, the concentrations of dieldrin, heptachlor epoxide and endosulfan sulfate were notably higher than aldrin, heptachlor and endosulfan respectively in most samples. In more recent studies aimed at providing baseline information on the current levels of organochlorine pesticides in aquatic system of Lake Victoria showed ratios of DDE to DDT suggesting previous use of the pesticides and significant use of lindane and endosulfan within the lake region [14]. The major sources of organochlorine pesticide residues levels in Lake Victoria region are agricultural activities and aerial sprays in public health vector control. DDT was extensively applied in aerial sprays against mosquitoes to control malaria in the 1960s and early 1970s [28]. The importation, distribution and public use of some of these compounds was banned or restricted in Kenya in 1986. Impacts of pesticides on human health and Environment in the Nyando River catchments have been documented [29]. An assessment of toxicity risks of pesticides in water, aquatic fauna and flora along River Nyando catchment will be reported in a subsequent paper.
4. Conclusion
The study documents list of organochlorine pesticide residue levels in soil in the Nyando River catchment area. The results reveal that methoxychlor is wildly used and that aldrin; endrin and heptachlor have not been used in the catchment area. Most pesticides frequently detected are dieldrin > endosulfan >lindane > methoxychlor.Since most pesticide residues were detected in the soils during short rain and the dry periods, it implies that along the River Nyando drainage basin most pesticides are used during the period between December and February. Pesticide application to the fields followed the observed trend of; dry seasons>short rain seasons>wet seasons. The pesticides detection frequency was high in wet seasons than in the dry. Soil samples from the Nandi-Lower Nyando sub-catchment area had more pesticides concentrations than the Kericho-Upper Nyando section.
From the results of this study and other studies conducted within Lake Victoria catchment area [13; 29], it would be important to monitor and ascertain the residue levels of organophosphates, banned or restricted organochlorine pesticides in soil and aquatic environment along the other drainage basins in Lake Victoria.
Acknowledgements
The International Foundation for Science (IFS) provided the research grant No.W3982-1 to Deborah Abongo, Higher Education Loans Board (HELB) Kenya provided partial sponsorship. Mr. John Okungu, Project Manager, Lake Victoria Environmental Management Project in Kisumu provided the field vehicle and officers who assisted in data collection.
31 | P a g e References
[1] Wandiga, S.O., Lalah, J.O., Kaigwara, P.N., Getenga, Z. & Mghenyi, J.M. (2001) The major environmental factors that influence rapid disappearance of pesticides from tropical soil in Kenya. Toxicol. Environ. Chem., 81: 161-197.
[2] Abong’o, D.A. (2009) Occurrence, distribution and environmental impacts of organochlorine pesticide residues in the Lake Victoria catchment: A case study of River Nyando drainage basin of Winam Gulf, Kenya. PhD thesis, University of Nairobi, Kenya.
[3] Sparovek, G., Anisimova, M.A., Kolb, M., Bahadir, M., Wehaga, H. & Schnug, E. (2001) Organochlorine Compounds in a Brazilian watershed with sugarcane and intense sediment redistribution. J. Environ. Qual., 30: 2006-2010. [4] Food and Agricultural Organization of United Nations/WHO, Pesticides Residues in food-1994.Report of Joint
Meeting of FAO Panel of Experts on Pesticide Residues in Food and the Environment and WHO Toxicological and Environmental Core Assessment Groups (FAO plant production and protection Paper 127).
[5] Shepherd. K., M. Walsh, F. Mugo, C. Ong, T. Svan Hansen, B. Swallow, A. Awiti, M. Hai, et al. (2000): Improved Land Management in Lake Victoria Basin: Linking Land and Lake, Research and Extension, Catchment and Lake Basin, First Report of Progress and Results July 1999 to March 2000. Working paper 2000-2. Nairobi: International Centre for Research in Agroforestry.
[6] Aryamanya-Mugisha. H. (1993) Pesticides and Environmental Degradation. Proceedings of Uganda National symposium on Pesticide Information Network. (UNSPIN). APEMAF Publication No. 6: pp 1-2.
[7] Orgaram. D.A. (1992) Mining Industry, hazardous materials and toxic chemicals. National Environmental Task Force No. 6: pp 71-83.
[8] Lake Victoria Environmental Management Project (LVEMP), (2003) Phase 1, Revised draft scientific stocking report-progress during LVEMP 1 and challenges for the future. World Bank: Washington, DC.
[9] Calamari, D., Aketch, M.O. & Ochumber, P.B.O. (1995) Pollution of Winam Gulf, Lake Victoria, Kenya: A case study for preliminary risk assessment: Lake Reservoirs Res. Manage: 1: 89-106.
[10] Madadi, V.O. (2005) Chemodynamics studies and assessment of pesticides residue levels in Lake Victoria catchment area for Rivers Sio and Nzoia. MSc. Thesis. Department of Chemistry, University of Nairobi.
[11] Wandiga, S.O. & Natwaluma, H. C. B. (1984) Degradation and Dissipation of persistent Pesticides in the Tropics, Kenya J. Sci. Tech. (series A), 5: 31-34.
[12] Wandiga. S.O. (1996) Organochlorine pesticides: Curse or blessing of tropical environment. In: Environment and development, a public lecture series. Kenya National Academy of Sciences Press. Nairobi, Kenya: pp 64-92. [13] Getenga. Z.M., Kengara, F.O. & Wandiga, S.O. (2004) Determination of organochlorine pesticides in soil and
water from River Nyando Drainage system within Lake Victoria Basin, Kenya. Bull. Environ. Contam. Toxicol
72(2): 335-342.
[14] Mbabazi, S.B. (1998) Levels of lindane in soil plants and selected soil fauna in a sprayed maize agroecosystem: MS.c Thesis, Makerere University, Kampala, Uganda.
[15] Kasozi G.N. (2001) Analysis of organochlorine pesticide residues in the aquatic ecosystem of Lake Victoria, Unpublished M.Sc. Thesis, Makerere University, Kampala, Uganda.
[16] Wandiga, S.O. & Natwaluma, H. C. B. (1984) Degradation and Dissipation of persistent Pesticides in the Tropics, Kenya. J. Sci. Tech. (series A), 5: 1-34.
[17] Wandiga, S.O. (1996) Organochlorine pesticides: Curse or blessing of tropical environment. In: Environment and development, a public lecture series. Kenya National Academy of Sciences Press. Nairobi, Kenya: pp 64-92. [18] National Environmental Secretariat (2002) First National Communication of Kenya to the Conference of the
parties to the United Nation Framework Convention on Climate change (UNFCCC), Nairobi, Kenya. National Environmental Secretariat.
[19] Kenya CBS. (2009) Population of Kenya: Ministry of planning and Development census report, Nairobi, Kenya. [20] UNESCO, (1993) Chlorinated biphenols in open ocean waters: Sampling, extraction, clean up and instrumental
determination. 10C Manuals and guides. 27:20.
[21] Avery, B.W. & Bascomb C.L. (1982) Soil Survey Laboratory Mathods Harpenden, UK.
[22] Pest Control and Product Board (PCPB) (1992) Record on annual import statistics of various pesticides imported in Kenya, Government Press, Nairobi, Kenya.
[23] Hill, A. (2000) Quality control procedures for pesticide residue guidline for residue monitoring in the European Union, 2nd Ed; Document no. SANCO/3103/2000, European Commission.
[24] Wandiga, S.O. (1995) Organochlorine Pesticides: Curse or blessing to tropical agriculture? Kenya National Academy of Science, Nairobi, Kenya, Public lectures Series; 81-90.
[25] Smith, A.G. (1991) Chlorinated Hydrocarbon Insecticides. In: Wayland, J., Hayes, Jr., Edward, R. & Laws, Jr. (Eds), Handbook of Pesticide Toxicology, Volume 3, Classes of Pesticides. Publ. by Academic Press, Inc., NY.
32 | P a g e
environments and organisms in Göksu Delta, Turkey. Aquatic Toxicology, 39(2): 171–181. http://doi.org/10.1016/S0166-445X(96)00849-1.
[27] Barlaz N.E. (2002) Determination of organochlorine pesticide residues in water and sediment samples in inner Anatolia in Turkey: Bull Environ. Contam. Toxicol., 69: 236-242.
[28] Mitema E.S; F. K Gitau., (1990) Organochlorine residues in Fish from Lake Victoria, Kenya. Africa J. Ecol. 28(3): 234-239.
[29] Abongó, D.A., Wandiga, S.O., Jumba, I.O., Madadi, V.O. & Kylin, H. (2014) Impacts of pesticides on Human health and environment in the River Nyando catchment, Kenya. International Journal of Humanities, Arts, Medicine