Using Visual and/or Content Features?
Bruce Ferwerda
Department of Computer Science and Informatics School of Engineering
Jönköping University Jönköping, Sweden bruce.ferwerda@ju.se
Marko Tkalcic
Department of Computer Science Free University of Bozen-BolzanoBozen-Bolzano, Italy marko.tkalcic@unibz.it
ABSTRACT
Instagram is a popular social networking application that allows users to express themselves through the uploaded content and the different filters they can apply. In this study we look at person-ality prediction from Instagram picture features. We explore two different features that can be extracted from pictures: 1) visual fea-tures (e.g., hue, valence, saturation), and 2) content feafea-tures (i.e., the content of the pictures). To collect data, we conducted an online survey where we asked participants to fill in a personality question-naire and grant us access to their Instagram account through the Instagram API. We gathered 54,962 pictures of 193 Instagram users. With our results we show that visual and content features can be used to predict personality from and perform in general equally well. Combining the two however does not result in an increased predictive power. Seemingly, they are not adding more value than they already consist of independently.
CCS CONCEPTS
• Information systems → Recommender systems; • Human-centered computing→ User models; User studies;
KEYWORDS
Personality, Instagram, picture content, social media
ACM Reference Format:
Bruce Ferwerda and Marko Tkalcic. 1997. Predicting Users’ Personality from Instagram Pictures: Using Visual and/or Content Features?. In Pro-ceedings of ACM Woodstock conference (WOODSTOCK’97),Jennifer B. Sartor, Theo D’Hondt, and Wolfgang De Meuter (Eds.). ACM, New York, NY, USA, Article 4, 5 pages. https://doi.org/10.475/123_4
1
INTRODUCTION
Personality is considered a stable construct to capture individual characteristics to explain behavioral differences with [23]. These personality-based individual differences has shown to be a useful factor to rely personalization strategies on. Hu and Pu [16] showed that personality-based systems are more effective in increasing users’ loyalty towards the system and decreasing cognitive effort
Permission to make digital or hard copies of part or all of this work for personal or classroom use is granted without fee provided that copies are not made or distributed for profit or commercial advantage and that copies bear this notice and the full citation on the first page. Copyrights for third-party components of this work must be honored. For all other uses, contact the owner/author(s).
WOODSTOCK’97, July 1997, El Paso, Texas USA © 2016 Copyright held by the owner/author(s). ACM ISBN 123-4567-24-567/08/06...$15.00 https://doi.org/10.475/123_4
compared to systems without personality information. In addition, the domain independent nature of personality allows it being in-corporated across domains [1]. Hence, once personality is known of a user, it can be incorporated into different platforms.
Given the usefulness of personality traits to personalize experi-ences in systems, research has started to give attention to map the relations between personality and behaviors (e.g., health [15, 28], education [3, 22], movies [4], music [6–9, 12, 29], marketing [24]). Although there is an increased interest in identifying the relation-ships between personality and behaviors, the question remains on how to obtain users’ personality for incorporation. A common approach is to use self-report measurements: a questionnaire is being used in order to assess the user’s personality. However, ques-tionnaires are time consuming and intrusive; it interrupts the flow between the user and the system.
To overcome the intrusiveness of using questionnairs to measure users’ personality traits, several researchers have made an attempt to predict personality from the digital footprint that users leave behind. The usefulness of social networking sites (SNSs) as an external information source to predict personalities from becomes especially apparent through the increased interconnectedness of systems. Through single sign-on (SSO) buttons users are given the opportunity to easily register and login to the system with their SNS account. Besides providing convenience to users, it also allows access to information that can be exploited for personality acquisition and thereby circumvent the usage of questionnaires.
SNSs such as Facebook, Twitter, and Instagram consist of an abundance of additional information that can be used to infer per-sonality traits from: Golbeck, Robles, and Turner [14] looked at Facebook profiles to make a personality predictor, and Quercia et al. [25] used Twitter messages to indicate personalities of users. In this work we focus specifically on personality predictions from Instagram pictures. Instagram is a popular mobile photo-sharing application with currently over 800 million users.1With the use of
picture filters, Instagram allows its users to create and express a dis-tinct personal style by adjusting and manipulating the appearance of the content they want to share. Previous work of Ferwerda et al. [11, 13] on predicting personality traits from Instagram pictures extracted the visual features of Instagram pictures and showed that these properties consist of personality information of users. A few other work showed that personality can be predicted from pictures. However they mainly focus on content features instead of the vi-sual features. For example, Celli et al. [2] analyzed compositions of
Facebook profile pictures (e.g., facial close-ups, facial expressions, alone or with others) for personality prediction.
The contributions of this work to personality research comes in two fold: 1) we extend prior research by Ferwerda et al. [11, 13] by exploring the predictive value of personality in the content features of Instagram pictures, and 2) we explore whether combining visual features with content features improves personality prediction of Instagram users.
2
RELATED WORK
There is an increasing body of work that looks at how to implicitly acquire personality traits of users. Since all kind of information can relate to personality traits, even information that is not directly relevant for a specific purpose may still contain information that is useful for the extraction of personality (e.g., Facebook [8], Twit-ter [25, 27], and Instagram [10, 11]). The increased connectedness between SNSs and applications through SSO buttons provide an abundance of information that can be exploited to implicitly acquire personality traits of users. Except for basic information, SSOs often gain access to other parts of the user’s profile as well [5].
Quercia et al. [25] looked at Twitter profiles and were able to predict users’ personality traits by using their number of followers, following, and listed counts. With these three characteristics they were able to predict personality scores with a root-mean-square error 0.88 on a [1,5] scale. Similar work has been done by Golbeck, Robles, and Turner [14] on Facebook profiles. They looked at the sentiment of posted content and were able to create a reliable per-sonality predictor with that information. More comprehensive work on the prediction of personality and other user characteristics using Facebook likes was done by Kosinski, Stillwell and Graepel [21].
Besides posted content on SNSs, the features of pictures has shown to consist of personality information as well. Work of Ferw-erda, Schedl, and Tkalcic [11, 13] on Instagram pictures, showed that the way filters are applied to create a certain distinctiveness can be used to predict personality traits of the poster. Others (e.g., [2, 26]) have focused on the content of pictures. They showed that compo-sitions of Facebook profile pictures consist of indicators of users’ personality. This makes us believe that the content of Instagram pictures may consist of useful information as well about the poster’s personality. Additionally, Skowron et al. [27] showed by combining linguistic and picture features they were able to improve predic-tions with 10-20% in each trait. Hence, besides exploring the content features of pictures for personality information, we further explore combining the content and visual features of pictures as well.
3
METHOD
To investigate the relationship between personality traits and pic-ture feapic-tures, we asked participants to fill in the 44-item BFI personality questionnaire (5point Likert scale; Disagree strongly -Agree strongly [18]). The questionnaire includes questions that ag-gregate into the five basic personality traits of the FFM: openness, conscientiousness, extraversion, agreeableness, and neuroticism. Additionally, we asked participants to grant us access to their Insta-gram account through the InstaInsta-gram API2to crawl their pictures.
2https://www.instagram.com/developer/
We recruited 193 participants through Amazon Mechanical Turk, a popular recruitment tool for user-experiments [20]. Participation was restricted to those located in the United States, and also to those with a very good reputation (≥95% HIT approval rate and ≥1000 HITs approved)3to avoid careless contributions. Several control
questions were used to filter out fake and careless entries. Pictures of each participant were crawled after the study. This resulted in a total of 54,962 pictures. The Mahalanobis distance was calculated to further identify outliers. This left us with 134 completed and valid responses. Age (18-64, median 31) and gender (60 male, 74 female) information indicated an adequate distribution. From hereon, we define the picture-collection term as all the Instagram pictures of a single user.
3.1
Visual Features
For each picture in a picture-collection that was crawled, we ex-tracted several features. The exex-tracted features are discussed below. Most of the features are color-based, some are content-based. For color-based features we use the color space that is most closely related to the human visual system, i.e., the Hue-Saturation-Value (HSV) color space [30].
3.1.1 Brightness.For each picture, we calculated the average brightness and variance across all the pixels in the picture. Pictures that have a high average brightness tend to be bright, obviously. These features represent how light/dark a picture is and how much contrast there is in the picture, respectively. Pictures that have a high variance tend to have both dark and light areas, whereas pictures with a low variance tend to be equally bright across the picture. Furthermore, we divided the brightness axis into three equal intervals and counted the share of pixels that fall into each of these intervals (low/mid/high brightness). Pictures that have a high value in the low brightness feature tend to be darker, those that have a high value in the mid brightness feature tend to have mostly neither dark nor bright areas, while those pictures that have a high value in the high brightness feature tend to have lots of bright areas.
3.1.2 Saturation. We calculated the average saturation and the variance for each picture. Pictures with low average saturation tend to be bleak, colorless, while pictures with high saturation have more vivid colors. Pictures with a high saturation variance tend to have both bleak and vivid colors. Here we also divided the saturation axis into three equal intervals and calculated the share of pixels that fall into each interval (low/mid/high saturation). pictures that have a high value in the low saturation tend to have more bleak colors, those with a high value in the mid saturation feature tend to have neither bleak nor vivid colors while those pictures that have a high value in the high saturation feature tend to have vivid colors across most of the picture area.
3.1.3 Pleasure-Arousal-Dominance (PAD).As the filters on In-stagram intend to create a certain expression, we adopted the PAD model of Valdez and Merhabian [31]. They created general rules of the expression of pleasure, arousal, and dominance in a picture as a combination of brightness and saturation levels:
(1) Pleasure = .69 Brightness + .22 Saturation
3HITs (Human Intelligence Tasks) represent the assignments a user has participated
Using Visual and/or Content Features? WOODSTOCK’97, July 1997, El Paso, Texas USA (2) Arousal = -.31 Brightness + .60 Saturation
(3) Dominance = -.76 Brightness + .32 Saturation
3.1.4 Hue-related features. We extracted features that repre-sented the prevalent hues in pictures. We chose features that rep-resent various aspects of the hues. For each of the basic colors (red, green, blue, yellow, orange, and violet) we counted the share of pixels that fall into each color. As the discrete color clustering of the hue dimension is nonlinear and subjective, we divided the hue into 10 equal intervals and calculated the share of pixels for each interval. However, these intervals are hard to describe with subjective color descriptions. Furthermore, we calculated the share of pixels that fall into cold (violet, blue, green) and warm (yellow, red, orange) colors.
3.2
Content Features
To analyze the content of the pictures, we used the Google Vision API.4The Google Vision API uses a deep neural network to ana-lyze the pictures and assign tags ("description") with a confidence level ("score": rϵ[0,1]) to classify the content. For each picture in a picture-collection a JSON file was returned with tags and the confidence level (example given in Listing 1).
1 [ { 2 " s cor e ": 0.8 7 3 4 8 1 3, 3 " mid ": "/ m /0 6__v ", 4 " d e s c r i p t i o n ": " s n o w b o a r d " 5 }, { 6 " s cor e ": 0.8 6 4 0 9 2 4, 7 " mid ": "/ m /0 1fklc ", 8 " d e s c r i p t i o n ": " pink " 9 }, { 10 " s cor e ": 0.8 1 7 5 4 1 0 6, 11 " mid ": "/ m /0bpn3c2", 12 " d e s c r i p t i o n ": " s k a t e b o a r d i n g e q u i p m e n t and s u p p l i e s " 13 }, { 14 " s cor e ": 0.8 1 3 1 7 8 1, 15 " mid ": "/ m /0 6_fw ", 16 " d e s c r i p t i o n ": " s k a t e b o a r d " 17 }, { 18 " s cor e ": 0.7 3 2 9 2 4 1, 19 " mid ": "/ m /0 5y5lj ", 20 " d e s c r i p t i o n ": " s p o r t s e q u i p m e n t " 21 }, { 22 " s cor e ": 0.6 4 8 6 6 6 4 4, 23 " mid ": "/ m /0 2nnq5", 24 " d e s c r i p t i o n ": " l o n g b o a r d " 25 } ]
Listing 1: Example JSON file returned by the Google Vision API for one picture
Using the Google Vision API, we were able to retrieve 4090 unique labels from the Instagram pictures. In order to create an initial clustering of the labels, we used a k-means clustering method
4https://cloud.google.com/vision/
that is applied to the vectors that represent the terms in the joint vector space. The vectors were generated with the doc2vec ap-proach using a set of embeddings that are pre-trained on the Eng-lish Wikipedia5. Using this method we collated the labels into
400 clusters.6After that, the output of the k-means was
manu-ally checked and the clusters were further (manumanu-ally) collated into similar categories. This resulted into 17 categories representing:
(1) Architecture (2) Body parts (3) Clothing (4) Music instruments (5) Art (6) Performances (7) Botanical (8) Cartoons (9) Animals (10) Foods (11) Sports (12) Vehicles (13) Electronics (14) Babies (15) Leisure (16) Jewelry (17) Weapons
For each participant, we accumulated the number of category occurrences in their Instagram picture-collection. Since the number of Instagram pictures in each picture-collection is different, we normalized the number of category occurrences to represent a range of rϵ[0,1]. This in order to be able to compare users with differences in the total amount of pictures.
In addition to the Google Vision API, we counted the number of faces and the number of people in each picture. We used the standard Viola-Jones algorithm [32]. A manual inspection of the Viola-Jones face detector results revealed some false positives (e.g., a portrait within the picture) and false negatives (e.g., some rotated and tilted faces). However, in general the users who tended to take pictures of people (e.g., selfies) had a higher number of average number of faces/people per picture than those users who tended to take mostly still photographs.
4
PERSONALITY PREDICTION MODELS
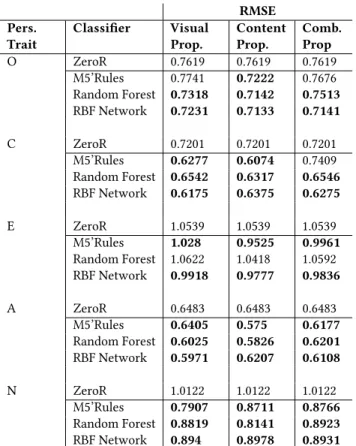
We trained our predictive model with several classifiers in Weka, with a 10-fold cross-validation with 10 iterations. For each classifier we used, we report the root-mean-square error (RMSE) in Table 1, to indicate the root mean square difference between predicted and observed values. The RMSE of each personality trait relates to the [1,5] score scale (see Table 1).A ZeroR classifier was used to create a baseline model. Three different classifiers were used and compared against the baseline model: M5’ rules, random forest, and radial basis function network (RBF network). Each classifier was applied to the visual properties, content properties, and a combination of the two picture features (i.e., visual+content features).
We first started to train our predictive model with the M5’ rules [33]. This is a classifier that has shown to be an effective classifier in previous work of Quercia et al. [25] on personality prediction from
5https://github.com/jhlau/doc2vec
6The k-means clustering method allows for setting a parameter for the number of
clusters to be forced. Different number of clusters were tried out. Setting the k-means to automatically define 400 clusters resulted in clusters with least errors in clustering the labels.
RMSE Pers. Trait Classifier Visual Prop. Content Prop. Comb. Prop O ZeroR 0.7619 0.7619 0.7619 M5’Rules 0.7741 0.7222 0.7676 Random Forest 0.7318 0.7142 0.7513 RBF Network 0.7231 0.7133 0.7141 C ZeroR 0.7201 0.7201 0.7201 M5’Rules 0.6277 0.6074 0.7409 Random Forest 0.6542 0.6317 0.6546 RBF Network 0.6175 0.6375 0.6275 E ZeroR 1.0539 1.0539 1.0539 M5’Rules 1.028 0.9525 0.9961 Random Forest 1.0622 1.0418 1.0592 RBF Network 0.9918 0.9777 0.9836 A ZeroR 0.6483 0.6483 0.6483 M5’Rules 0.6405 0.575 0.6177 Random Forest 0.6025 0.5826 0.6201 RBF Network 0.5971 0.6207 0.6108 N ZeroR 1.0122 1.0122 1.0122 M5’Rules 0.7907 0.8711 0.8766 Random Forest 0.8819 0.8141 0.8923 RBF Network 0.894 0.8978 0.8931 Table 1: Different prediction models for each personal-ity trait using only the visual properties, content proper-ties, and a combination of both. ZeroR classifier represents the baseline. The boldfaced numbers indicate an out per-formance of the baseline. Root-mean-square error (RMSE) is reported (r ∈ [1,5]) to indicate prediction performance of the personality traits: (O)penness, (C)onscientiousness, (E)xtraversion, (A)greeableness, (N)euroticism.
Twitter data. The M5’ rules outperform the baseline model in pre-dicting most of the personality traits (except for the openness trait using the visual features).
To further explore possible improvements by other classifiers, we tried out the random forests classifier. Random forests are known to have a reasonable performance when the features consist of high amounts of noise [17]. Compared to the M5’ rules, the random forest classifier show slight improvements on half of the personality traits: openness to experience, agreeableness, and neuroticism (for the latter prediction only improved based on content features). For the other half of the personality traits M5’ rules outperforms the random forest classifier.
As the M5’ rules and random forest classifiers failed to outper-form the baseline in all personality traits, we used the RBF network classifier. The RBF network is a neural network that has shown to work well on smaller datasets [19]. Applying the RBF network classifier we were able to gain an prediction improvement on all personality traits using the visual as well as the content features.
Since both the visual as well as the content features showed to be reliable predictors of personality traits, we also explored personality prediction by combining the two. However, combining visual and content features does not result in an improvement of the personality prediction. Instead, the RMSE values adjust towards the average of the visual and content features. Hence, although the visual and content features are good predictors on their own, they do not complement each other much.
Table 2 displays a comparison with prior research that use similar approaches to predict personality from SNS data. Compared to prior work of Ferwerda et al. [13] and Quercia et al. [25] we are able to outperform predictions in some traits. Whereas, visual and content properties do not complement each other in our study, Skowron et al. [27] found features that were able to improve prediction when being combined. Nevertheless, across all studies we found similar patterns and comparable results whereas most difficult traits to predict are consistently extraversion and neuroticism.
RMSE Pers. traits Comb. Prop. [13] [27] [25] O 0.71 0.68 0.51 0.69 C 0.62 0.66 0.67 0.73 E 0.98 0.90 0.71 0.96 A 0.61 0.69 0.50 0.78 N 0.89 0.95 0.73 0.97
Table 2: Comparison of personality prediction compared to prior work of Ferwerda et al. [13], Skowron et al. [27], and Quercia et al. [25]. Root-mean-square error (RMSE) is reported (r ∈ [1,5]) to indicate prediction performance of the personality traits: (O)penness, (C)onscientiousness, (E)xtraversion, (A)greeableness, (N)euroticism.
5
CONCLUSION
We explored the predictive value of different kind of features that can be extracted from pictures. Prior work of Ferwerda et al. [13] already showed that the visual features of Instagram consist of useful information to predict personality from. However, they did not explore other features that can be extracted from the pictures (i.e., content features). In this work we show that the visual features as well as the content features consist of information for personality prediction that attain similar results.
Although prior work [27] showed to be able to improve their personality predictor by combining information from SNSs, we were not able to achieve that. The visual and content features show to be good predictors on their own, but they do not seem to provide added value to each other when being combined. When combining the two features into one predictor, our results show that the RMSE adjust towards the average instead of showing an improvement. Hence, when personality prediction from Instagram picture is ought to be done, a focus on either visual features or content features will suffice to create a personality prediction model.
Using Visual and/or Content Features? WOODSTOCK’97, July 1997, El Paso, Texas USA
REFERENCES
[1] Iván Cantador, Ignacio Fernández-Tobías, and Alejandro Bellogín. 2013. Relating personality types with user preferences in multiple entertainment domains. In CEUR Workshop Proceedings. Shlomo Berkovsky.
[2] Fabio Celli, Elia Bruni, and Bruno Lepri. 2014. Automatic personality and inter-action style recognition from facebook profile pictures. In Proceedings of the 22nd ACM international conference on Multimedia. ACM, 1101–1104.
[3] Guanliang Chen, Dan Davis, Claudia Hauff, and Geert-Jan Houben. 2016. On the impact of personality in massive open online learning. In Proceedings of the 2016 conference on user modeling adaptation and personalization. ACM, 121–130. [4] Li Chen, Wen Wu, and Liang He. 2013. How personality influences users’ needs
for recommendation diversity?. In CHI’13 Extended Abstracts on Human Factors in Computing Systems. ACM, 829–834.
[5] Pern Hui Chia, Yusuke Yamamoto, and N Asokan. 2012. Is this app safe?: a large scale study on application permissions and risk signals. In Proceedings of the 21st international conference on World Wide Web. ACM, 311–320.
[6] Bruce Ferwerda, Mark Graus, Andreu Vall, Marko Tkalcic, and Markus Schedl. 2016. The influence of users’ personality traits on satisfaction and attractiveness of diversified recommendation lists. In 4 th Workshop on Emotions and Personality in Personalized Systems (EMPIRE) 2016. 43.
[7] Bruce Ferwerda and Markus Schedl. 2014. Enhancing Music Recommender Systems with Personality Information and Emotional States: A Proposal.. In UMAP Workshops.
[8] Bruce Ferwerda and Markus Schedl. 2016. Personality-Based User Modeling for Music Recommender Systems. In Joint European Conference on Machine Learning and Knowledge Discovery in Databases. Springer, 254–257.
[9] Bruce Ferwerda, Markus Schedl, and Marko Tkalcic. 2015. Personality & Emo-tional States: Understanding Users’ Music Listening Needs.. In UMAP Workshops. [10] Bruce Ferwerda, Markus Schedl, and Marko Tkalcic. 2015. Predicting personality
traits with instagram pictures. In Proceedings of the 3rd Workshop on Emotions and Personality in Personalized Systems 2015. ACM, 7–10.
[11] Bruce Ferwerda, Markus Schedl, and Marko Tkalcic. 2016. Using instagram picture features to predict users’ personality. In International Conference on Multimedia Modeling. Springer, 850–861.
[12] Bruce Ferwerda, Marko Tkalcic, and Markus Schedl. 2017. Personality Traits and Music Genres: What Do People Prefer to Listen To?. In Proceedings of the 25th Conference on User Modeling, Adaptation and Personalization. ACM, 285–288. [13] Bruce Ferwerda, Emily Yang, Markus Schedl, and Marko Tkalcic. 2015. Personality
traits predict music taxonomy preferences. In Proceedings of the 33rd Annual ACM Conference Extended Abstracts on Human Factors in Computing Systems. ACM, 2241–2246.
[14] Jennifer Golbeck, Cristina Robles, and Karen Turner. 2011. Predicting personality with social media. In CHI’11 extended abstracts on human factors in computing systems. ACM, 253–262.
[15] Sajanee Halko and Julie A Kientz. 2010. Personality and persuasive technology: an exploratory study on health-promoting mobile applications. In International Conference on Persuasive Technology. Springer, 150–161.
[16] Rong Hu and Pearl Pu. 2011. Enhancing collaborative filtering systems with per-sonality information. In Proceedings of the fifth ACM conference on Recommender systems. ACM, 197–204.
[17] Elizabeth M Humston, Joshua D Knowles, Andrew McShea, and Robert E Syn-ovec. 2010. Quantitative assessment of moisture damage for cacao bean quality using two-dimensional gas chromatography combined with time-of-flight mass spectrometry and chemometrics. Journal of Chromatography A 1217, 12 (2010), 1963–1970.
[18] Oliver P John and Sanjay Srivastava. 1999. The Big Five trait taxonomy: History, measurement, and theoretical perspectives. Handbook of personality: Theory and research2, 1999 (1999), 102–138.
[19] Lav R Khot, Suranjan Panigrahi, Curt Doetkott, Young Chang, Jacob Glower, Jayendra Amamcharla, Catherine Logue, and Julie Sherwood. 2012. Evaluation of technique to overcome small dataset problems during neural-network based contamination classification of packaged beef using integrated olfactory sensor system. LWT-Food Science and Technology (2012).
[20] Aniket Kittur, Ed H Chi, and Bongwon Suh. 2008. Crowdsourcing user studies with Mechanical Turk. In Proceedings of the SIGCHI conference on human factors in computing systems. ACM, 453–456.
[21] Michal Kosinski, David Stillwell, and Thore Graepel. 2013. Private traits and attributes are predictable from digital records of human behavior. Proceedings of the National Academy of Sciences of the United States of America110, 15 (mar 2013), 5802–5. https://doi.org/10.1073/pnas.1218772110
[22] Michael J Lee and Bruce Ferwerda. 2017. Personalizing online educational tools. In Proceedings of the 2017 ACM Workshop on Theory-Informed User Modeling for Tailoring and Personalizing Interfaces. ACM, 27–30.
[23] Gerald Matthews, Ian J Deary, and Martha C Whiteman. 2003. Personality traits. Cambridge University Press.
[24] S C Matz, M Kosinski, G Nave, and D J Stillwell. 2017. Psychological targeting as an effective approach to digital mass persuasion. Proceedings of the National
Academy of Sciences114, 48 (nov 2017), 12714–12719. https://doi.org/10.1073/ pnas.1710966114
[25] Daniele Quercia, Michal Kosinski, David Stillwell, and Jon Crowcroft. 2011. Our Twitter profiles, our selves: Predicting personality with Twitter. In IEEE Third Conference on Social Computing. 180–185.
[26] Cristina Segalin, Fabio Celli, Luca Polonio, Michal Kosinski, David Stillwell, Nicu Sebe, Marco Cristani, and Bruno Lepri. 2017. What your Facebook Profile Picture Reveals about your Personality. In Proceedings of the 2017 ACM on Multimedia Conference, MM 2017, Mountain View, CA, USA, October 23-27, 2017. 460–468. https://doi.org/10.1145/3123266.3123331
[27] Marcin Skowron, Marko Tkalčič, Bruce Ferwerda, and Markus Schedl. 2016. Fusing social media cues: personality prediction from twitter and instagram. In Proceedings of the 25th international conference companion on world wide web. International World Wide Web Conferences Steering Committee, 107–108. [28] Kirsten A Smith, Matt Dennis, and Judith Masthoff. 2016. Personalizing reminders
to personality for melanoma self-checking. In Proceedings of the 2016 Conference on User Modeling Adaptation and Personalization. ACM, 85–93.
[29] Marko Tkalčič, Bruce Ferwerda, David Hauger, and Markus Schedl. 2015. Per-sonality correlates for digital concert program notes. In International Conference on User Modeling, Adaptation, and Personalization. Springer, 364–369. [30] Marko Tkalcic and Jurij Tasic. 2003. Colour spaces: perceptual, historical and
applicational background. IEEE EUROCON. Computer as a Tool (2003), 304–308. https://doi.org/10.1109/EURCON.2003.1248032
[31] Patricia Valdez and Albert Mehrabian. 1994. Effects of color on emotions. Journal of Experimental Psychology: General123, 4 (1994), 394.
[32] Paul Viola and Michael J. Jones. 2004. Robust Real-Time Face Detection. In-ternational Journal of Computer Vision57, 2 (May 2004), 137–154. https: //doi.org/10.1023/B:VISI.0000013087.49260.fb
[33] Ian H Witten and Eibe Frank. 2005. Data Mining: Practical machine learning tools and techniques. Morgan Kaufmann.