1876-6102 © 2017 The Authors. Published by Elsevier Ltd. This is an open access article under the CC BY-NC-ND license (http://creativecommons.org/licenses/by-nc-nd/4.0/).
Peer-review under responsibility of the scientific committee of the 8th International Conference on Applied Energy. doi: 10.1016/j.egypro.2017.03.805
Energy Procedia 105 ( 2017 ) 3903 – 3908
ScienceDirect
The 8
thInternational Conference on Applied Energy – ICAE2016
Potential of energy saving in a data center – application of an
agent-based modelling
Qinxing Wang
a, Nianzhi Huang
a, Haiyang Lin
a, Hailong Li
b, Ronald
Wennersten
a, Qie Sun
a*
aInstitute of Thermal Science and Technology, Shandong University, China bSchool of Business, Society and Technology, Mälardalen University, Sweden
Abstract
Conventional approaches for modelling energy consumption for data center are limited to deal with the randomness, emergence and interdependence in energy systems. To fill the gap, an agent-based method was proposed and implemented to simulate the electricity consumption of a data center and to explore the potential of energy saving. The study found that a large amount of energy can be saved by dynamically operating the cooling load according to the practical load of the servers, namely 13% of the total energy consumption can be saved in the dynamic energy saving case (DESC) and 17% in the enhanced dynamic energy saving case (EDESC). The power usage effectiveness (PUE) of the data center can decrease from 1.71 in the original situation to 1.49 in the DESC and 1.42 in the EDESC. By contrast, the frequency of data backup has a heavy impact on the electricity consumption of the data center, while the frequency of computing tasks do not.
© 2016 The Authors. Published by Elsevier Ltd.
Selection and/or peer-review under responsibility of ICAE
Keywords: agent-based model; data center; photovoltaic system; investment cost
1. Introduction
With the explosive growth of digital information, energy consumption of data centers keeps increasing. In 2014, data centers in the U.S. consumed an estimated 70 billion kWh, accounting for about 1.8% of total U.S. electricity consumption. [1-3]. The energy consumption of data centers can be divided into two parts: the electricity consumed by the electronic devices and the electricity consumed by the ventilation and
Qie Sun. Tel.:+86-(0)531-88399000-2306
E-mail address: qie@sdu.edu.cn.
© 2017 The Authors. Published by Elsevier Ltd. This is an open access article under the CC BY-NC-ND license (http://creativecommons.org/licenses/by-nc-nd/4.0/).
cooling system. In order to decrease the energy consumption of data centers, many data centers locate in the places where the ambient temperature is appropriate and therefore free cooling technologies can be applied.
As the increase in the number of data centers, how to reduce the energy consumption of data centers has attached more and more attentions.Conventional approaches for modelling energy consumption for data center have been adopted by many researchers [4, 5], but they are incapable of dealing with the interdependence, randomness and emergence in energy systems. To address this gap, the agent-based method has recently become increasingly popular to investigate the complexity of energy systems. Agent-based models consists of a set of agents, which interact each other and the environment according to certain rules [6, 7]. Agents can be low or medium level intelligent objects, e.g. machine, or highly intelligent objects, e.g. human beings. An agent’s state is the specific collection of parameters that define an agent or all of the relevant information about what this agent is at this moment [8, 9]. Therefore, it is a good method to deal with complex energy systems regarding the interdependence, randomness and emergence.
The aim of this paper is to develop an agent-based model to simulate electricity consumption of a data center and explore the potential of energy savings. The remainder of the paper is organized as follows: Section 2 introduces the methodology; Section 3 reports the results; and Section 4 concludes the paper with the main findings.
2. Methodology
2.1. Agent-based modelling of the electricity consumption in a data center
For a data center, cooling is required to remove the heat released by the electronic devices to ensure their proper operation. The total electricity consumption in a data center can be calculated as:
⁄ (1) where represents the electricity consumption of servers, is the electricity consumption for lighting (14W/m2) [10], and the efficiency of cooling system ( ) is assumed to be
3.29 [11].
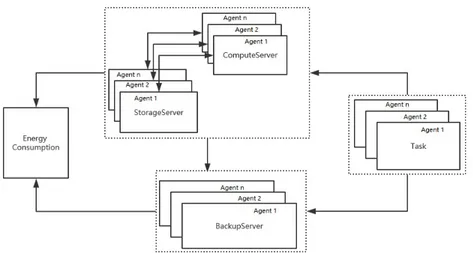
An agent-based model was developed to simulate the energy consumption of a small data center (Fig 1), which involves: 40 computing servers, 20 storage servers and 20 backup servers. The rated power of every server is 400W and the space size is 100 m2. Every server is represented by an agent in the model with two
states: “Idle” and “on”. This paper assumed that the actual power of a server in the “idle” state is 35% of its rated power and randomly 35-95% of the rated power when it is in the state “on”, depending on the computing task (Table 1). It is assumed that a new computing task will arrive every 10 seconds.
A computing task may require multiple computing servers to work together and a complicated task may employ more servers than a simple task does. A day is divided into a peak period i.e. 09:00-21:00 and a valley period: during the peak period, a complicated task may employ 21-40 servers at a time, while it may employ 0-20 servers during the valley period. The number of employed servers follows a random discrete uniform distribution.
When the computing servers are computing a task, the same number of storage servers as computing servers start to work. When a computing task is finished, backup servers start to back up the data. In addition, all the backup servers will operate an overall back up every hour.
To ensure the operation of the data center, a cooling system is running to keep the temperature at an appropriate level. At present, most data center set the power of the cooling system according to 95-100% of the rated power of the servers.
2.2. Potential of electricity saving for data center
As the cooling system normal provides more cooling effects than necessary, there is a large potential of energy saving by operating the cooling system according to the actual power of the servers. The study assumes that the cooling system contain many individual cooling units and every unit can independently operate and cool down one server. For the first step, the cooling system can operate at 35% of the servers’ rated power when they are in the “idle” state and 95% of the servers’ rated power when they are “on”. For the ease of the following analysis, it is called dynamic energy-saving case (DESC). On the basis of DESC, energy can be further saved if the cooling units operates at the actual power of the server, rather than 95% of its rated power. This is called enhanced dynamic energy saving case (EDESC) in this study.
Therefore, the potential of energy savings in DESC and in EDESC can be respectively calculated as: / (2) / (3) In addition, the study also calculated the power usage effectiveness (PUE) of the data center, i.e. the ratio of total amount of energy used by a computer data center facility to the energy delivered to computing equipment, as the indicator for its overall energy efficiency[12]
⁄ (4)
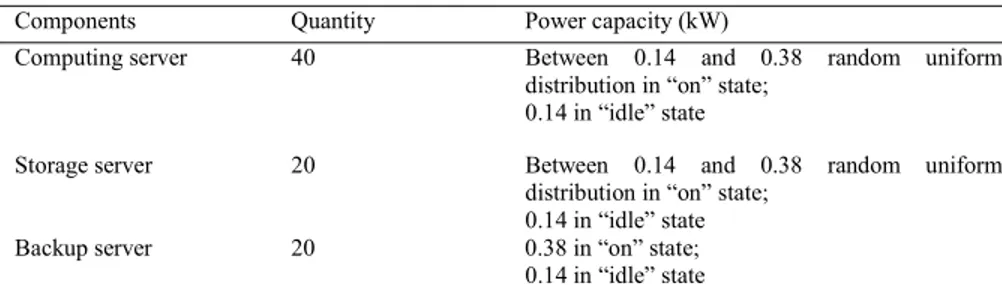
Table.1 Input parameters of data center
Components Quantity Power capacity (kW)
Computing server 40 Between 0.14 and 0.38 random uniform
distribution in “on” state; 0.14 in “idle” state
Storage server 20 Between 0.14 and 0.38 random uniform
distribution in “on” state; 0.14 in “idle” state
Backup server 20 0.38 in “on” state;
0.14 in “idle” state
3. Results and discussion
The agent-based model was implemented in Anylogic 7.3.5. The time step of this simulation was set to 1 second and the model simulated the operation of the data center for one year.
Fig 3 shows the results of the electricity consumption of the servers and the cooling system in one day. The average load of the servers is between 11 kW and 22 kW, which is about 34-68% of the servers’ rated power and the load peaks every hour due to the regular tasks of backup. In practice, the load of the servers is dependent on the actual requirements of computation and the regularity of backups, which might be slightly different from the present model. The paper further examined this through a sensitivity analysis. According to the simulation, the electricity consumption of the servers (136 MWh) accounts for about 58% of the data center’s total amount of electricity consumption (232 MWh). In contrast, the cooling system accounts for about 37% of the total electricity consumption (84 MWh). Correspondingly, lighting accounts for about 5% of the total electricity consumption (12 MWh). In addition, the study also found that the electricity consumption in the peak period accounts for 56% of the total consumption, while the valley period accounts for only 44%. It implies that leveling-out the computation loads and reducing peak loads would contribute to energy saving of the data center.
Fig 4 shows the load of the cooling system in different cases and a significant decrease in the cooling load can be obtained in both DESC and EDESC. The potential of energy saving in DESC is 30 MWh representing about 13% of the total electricity consumption in the original case and the potential in EDESC reaches about 39.6 MWh representing about 17% of the total electricity consumption. The results imply that a huge amount of electricity can be saved by dynamically operating the cooling system according to the load of the servers. In addition, the value of PUE decreased from 1.71 in the original situation to 1.49 in the DESC and in 1.42 in the EDESC.
4. Sensitivity analysis
This study employed sensitivity analysis to determine the impacts of time interval of tasks and data backups on the model.
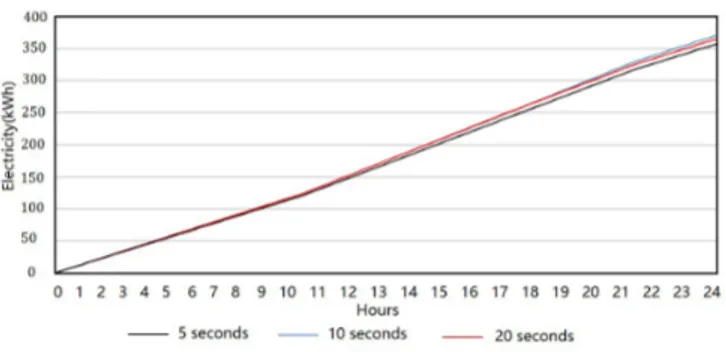
The study simulated the electricity consumption of servers when tasks arrive every 5 seconds, 10 seconds and 20 seconds (Fig 5). It was found that the electricity consumption in the cases of 5 seconds, 10 seconds and 20 seconds are 358 kWh, 365 kWh and 370kWh, respectively. The results implied that the time interval of task arrival had very small impact on the total electricity consumption.
For data backups, the study simulated electricity consumption of servers when the data center perform backups every 10, 30, 60 and 120 minutes. The results showed that the electricity consumption in a day
would be 128 kWh, 75 kWh, 62 kWh and 57 kWh. This means that the frequency of data backup has a significant impact on the total amount of energy consumption.
Fig. 3 Power variation of severs and cooling system
Fig. 4 Power variation of cooling system in different cases
Fig. 5 Sensitivity analysis for time interval of task arrival
5. Conclusion
In this paper, an agent-based method was developed to simulate energy consumption of a data center. For an ordinary data center, the servers consume about 58% of the total electricity consumption, the cooling system consume about 37% and the lighting about 5%. A significant amount of electricity can be save by
dynamically operating the cooling load according to the practical load of the servers. For the dynamic energy saving case (DESC) and the enhanced dynamic energy saving case (EDESC), about 13% and 17% of the data center’s total electricity consumption can be saved, respectively. The power usage effectiveness (PUE) of the data center can decrease from 1.71 in the original situation to 1.49 in the DESC and 1.42 in the EDESC. By contrast, the frequency of data backup has a heavy impact on the electricity consumption of the data center, while the frequency of computing tasks do not.
Acknowledgement
This work was supported in part by Project ZR2014EEM025 supported by Natural Science Foundation of Shandong Province, China; and the 973 Program 2013CB228305, China.
References
[1] Koomey JG. Worldwide electricity used in data centers. Environmental Rsearch Letters. 2008; 3:8.
[2] Ham S-W, Kim M-H, Choi B-N, Jeong J-W. Simplified server model to simulate data center cooling energy consumption. Energy and Buildings. 2015; 86:328-39.
[3] LBNL. United States Data Center Energy Usage Report. 2016. Available at: http://datacenters.lbl.gov/.
[4] Fan XW, Wolf-Dietrich; Barroso, Luiz André. Power provisioning for a warehouse-sized computer. International Symposium on Computer Architecture. 2007; 35(2):13-23.
[5] Luo L, Wu W, Tsai WT, Di D, Zhang F. Simulation of power consumption of cloud data centers. Simulation Modelling Practice and Theory. 2013; 39:152-71.
[6] Norvig SJRP. Artificial Intelligence: AModern Approach. Prentice Hall, Upper Saddle River, New Jersey; 2009. [7] Agent-Based Modelling of Socio-Technical Systems. Springer Dordrecht Heidelberg New York London: Springer; 2013. [8] Barbati M, Bruno G, Genovese A. Applications of agent-based models for optimization problems: A literature review. Expert Systems with Applications. 2012; 39(5):6020-8.
[9] Zhang T, Siebers P-O, Aickelin U. Modelling electricity consumption in office buildings: An agent based approach. Energy and Buildings. 2011; 43(10):2882-92.
[10] H.S. Sun SEL. Case study of data centers' energy performance. Energy and Buildings. 2006; 38(2006):12.
[11] Zongcheng Y. Improve the Efficiency of the Chiller Measures Analysis. Refrigeration and Air Conditioning. 2011; 25(5):14. [12] PUE: A Comprehensive Examination of the Metric. 2012. Available at: https://datacenters.lbl.gov.
Biography
Qinxing Wang is a PhD candicate in Shandong Universicty. He is studying at the Institute of Thermal Science and Technology, Shandong University. His researche focuses include sustainable energy system and industrial ecology.