ARTICLE
Patient Reported Outcome Measures (PROMs) after total hip-
and knee replacement surgery evaluated by the Postoperative
Recovery Profile questionnaire (PRP) – improving clinical quality
and person-centeredness
Renée Allvin RNA MScN PhD
a, Anna-Maria Kling MScS
b, Ewa Idvall RNT PhD
cand Elisabeth
Svensson PhD
da Acute Pain Nurse, Department of Anesthesiology and Intensive Care, Örebro University Hospital, Örebro, Sweden b Statistician, Statistical and Epidemiology Unit, Örebro University Hospital, Örebro, Sweden
c Professor, Faculty of Health and Society, Malmö University, Malmö and Skåne University Hospital, Sweden d Professor, Statistics Department, Örebro University, Örebro, Sweden
Abstract
Rationale and aims: The importance of evaluating postoperative recovery with consideration to the patient’s perspective has been emphasized. The aim of this study was to demonstrate how the recovery-specific Postoperative Recovery Profile (PRP) questionnaire can be used to evaluate patient-reported outcome measures (PROMs) after hip- and knee replacement in the enhancement of clinical quality and the person-centeredness of clinical services.
Method: Patients undergoing primary total knee- and hip replacement were eligible for this longitudinal follow-up study. The participants completed the PRP questionnaire on repeated occasions. In this paper, data from Day 3 and Month 1 after discharge were used. The change in recovery, between the two measurement occasions, on item-, dimensional- and global levels, both for each patient and for the group, were evaluated.
Results: A total number of 75 patients were included. One month after discharge the median PRP score was 13 (partly recovered) out of 19. Recovery changes towards lower levels of problems/difficulties were shown in both item-, dimensional- and global levels of recovery month 1 after discharge, as compared with Day 3. The group of patients was homogenous in change.
Conclusions: We demonstrated that the PRP questionnaire can be used to evaluate postoperative recovery after hip- and knee replacement surgery on item-, dimensional- and global levels. Data from each recovery level can be useful for quality development and in informing increases in the person-centeredness of clinical services. The global population scores can be used to evaluate treatment effect on a group of patients. It can also be used to define endpoints in follow-up studies.
Keywords
Arthroplasty, clinical quality, measurement, outcome, person-centeredness, postoperative recovery, questionnaire Correspondence address
Dr. Renée Allvin, Department of Anesthesiology and Intensive Care, Örebro University Hospital, 701 85 Örebro, Sweden. E-mail: rene.allvin@orebroll.se
Accepted for publication: 17 July 2012
Introduction
Hip- and knee replacement are widely recognized as being effective for the treatment of osteoarthritis. In Sweden, Norway, Denmark, England, Canada, the USA, Australia and New Zealand, the crude incidence rates (per 100,000) range from 66 to 143 and from 77 to 153 for primary knee- and hip replacement, respectively [1]. Every surgical procedure is followed by a period of postoperative recovery involving biomedical issues and personal experiences. During the last decades, advances have been made to facilitate and shorten the recovery process. Specialized fast-track joint replacement units have been
established in, for example, Denmark and the UK, reporting mean postoperative stays of 3.8 and 3.7 days, respectively [2,3]. This means that the majority of the recovery period takes place in the patient’s home environment. Thus, the importance of evaluating postoperative recovery proper with consideration given to the patient’s perspective cannot be over-emphasized.
The outcome of joint replacement surgery has often been assessed with focus on revision rates, complications, mortality and their connection to different types of interventions, for example, surgical technique, implants and prosthetic material [4]. However, the use of patient-reported outcome measures (PROMs) to gather information about patients’ perceptions of their health
status have gained increased acceptance [5]. Generic measurement instruments (e.g., the EQ-5D) have been used to assess health-related quality of life after orthopedic surgery [6]. Disease- and site specific instruments (e.g., the Oxford knee score) have been used to assess clinical outcomes with focus on pain and physical function [7]. Although important, these instruments do not necessarily provide all of the information needed about what is important to individuals during recovery after a surgical intervention [8]. To obtain a more complete evaluation of the patients’ status, a recovery-specific instrument could also be used.
During the last decades, a system of national quality registries containing individualized data concerning patient problems, medical interventions and outcomes after treatment has been established in Swedish healthcare. The Swedish hip (www.shpr.se) [9] and knee arthroplasty (www.knee.se) [10] registries have received both national and international recognition. A prerequisite for quality registries is to continuously develop, use and report PROMs. It is therefore a challenge to find useful measurement instruments for different groups of patients and for different purposes in the PROM area. Therefore, the aim of this study was to evaluate PROM after total hip- and knee replacement surgery by using the Postoperative Recovery Profile (PRP) questionnaire [11,12] on item-, dimensional- and global levels, both for each patient and for the group. The global score is important for estimating a population-based profile of recovery. Data from each level provide an integrated description of the status of the individuals, which can be most useful for quality development on ward- and/or department levels and as a tool to increase the person-centeredness of clinical services.
Method
Study design and population
Patients undergoing primary total knee- and hip replacement were eligible for this longitudinal follow-up study of recovery. A consecutive sample of 83 in-patients at a university hospital in central Sweden were informed and consented to participate in this study. Inclusion criteria were that the patients had to be 18 years or older and could read and understand Swedish. Patients with cognitive dysfunction that precluded complete cooperation, or any severe pre-existing medical condition that limited objective assessment after surgery, were excluded. The enrolment of participants was performed on the ward.
After inclusion, the participants completed the PRP questionnaire on repeated occasions during 12 months. In this paper, data from Day 3 and Month 1 after discharge were used. At discharge from the hospital, the participants received the questionnaire to be completed 3 days after discharge together with a prepaid envelope. The
The background and peri-operative variables collected during hospital stay were; sex, age, surgical procedure, physical classification according to the American Society of Anesthesiologists (ASA), length of postoperative stay, duration of surgery, blood loss and marital status. The study was approved by the Regional Ethical Review Board in Uppsala, Sweden (2006/047) and was conducted in accordance with the ethical standards formulated in the Helsinki Declaration.
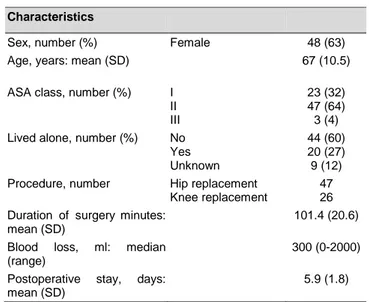
Table 1 Demographic data of the participants and peri-operative characteristics (n=73)
Characteristics
Sex, number (%) Female 48 (63)
Age, years: mean (SD) 67 (10.5)
ASA class, number (%) I II III
23 (32) 47 (64) 3 (4) Lived alone, number (%) No
Yes Unknown
44 (60) 20 (27) 9 (12) Procedure, number Hip replacement
Knee replacement
47 26 Duration of surgeryminutes:
mean (SD)
101.4 (20.6)
Blood loss, ml: median (range)
300 (0-2000)
Postoperative stay, days: mean (SD)
5.9 (1.8)
ASA = American Society of Anesthesiologists
Patient reported outcome measures
The Postoperative Recovery Profile (PRP) questionnaire is a multi-dimensional, multi-item questionnaire for self-assessment of general postoperative recovery [11,12]. The recovery dimensions are physical symptoms, physical
functions, psychological, social and activity measured by
19 items. Patients’ perceived problems/difficulties are assessed by the response categories severe, moderate, mild,
none which means that the data consist of ordered
categories.
The PRP questionnaire provides recovery profiles for each individual and for the group both on item and dimensional levels. The 19 item responses describe a detailed individual response profile over the recovery dimensions and the item frequency distributions describe the item response profile of the group. Each of the 5 dimensional scores is defined by the most severe level of problem/difficulty assessed in the dimension, providing an individual dimensional profile. The frequency distributions of the dimensional scores describe the dimensional PRP-profile of the group. An overall individual global score of recovery is defined by the number of items that is assessed as none of the 19 items. Hence, the global score is an indicator sum ranging from 0 to 19. A previous study has
almost fully recovered (indicator sum 15-18), partly recovered (indicator sum 8-14), slightly recovered
(indicator sum 7) and not at all recovered (indicator sum <7) [12].
Statistics
The demographic data were described by frequency distribution, median (Md) and range or mean and standard deviation (SD), respectively, when appropriate. The group response profiles of the dimensions and of the items, respectively, were described by the medians (Md) and quartiles (Q1, Q3) and illustrated with bar charts. The change in recovery on item and dimensional levels between the 2 occasions, according to the 2 assessments on the PRP, were evaluated by a statistical method developed for paired ordered categorical data [13]. This statistical method makes it possible to evaluate the level of systematic change attributed to the group separately from the level of individual variation of changes. Such evaluation of the sources of changes is clinically important; the presence of systematic change is a sign of homogeneity change and reflects the efficacy of treatment on the study group and large individual variability indicates heterogeneity in changes. The frequency distribution of the individual pairs of ordered categorical assessments were described by square contingency tables, where the main diagonal of unchanged categorical assessments is oriented from the lower-left to the upper-right corner. The measure of systematic change between the 2 assessments, the Relative Position, RP, was calculated.
The RP expresses the extent to which the frequency distribution of scale assessments on the follow-up occasion is shifted towards higher rather than lower categorical levels compared with the first set of assessments. A negative RP value indicates that the group more likely assessed lower levels of problem/difficulty on the follow-up occasion. Possible values of RP range from (-1) to 1.
The Relative Rank Variance, RV, is a measure of individual variations in change that are unexplained by the measure of systematic group change. The higher the value, RV< 1, the more heterogeneous are the individual changes. The measures and the 95% confidence intervals (CI) of RP and RV were calculated by means of a free software program [14]. Statistically significant RP and RV values on at least 5% level are indicated by 95% confidence intervals that do not cover the zero value of the measures.
Results
A total number of 75 patients were included. Of these, 2 patients withdrew before discharge. All patients had undergone primary hip- or knee arthroplasty due to osteoarthritis. Patient demographics and peri-operative data have been presented above in Table 1.
Recovery changes in items
The evaluation of change is based on the patients’ assessments on the PRP questionnaire Day 3 and Month 1 after surgery. In the following text, the measures are explained by three of the variables. According to the frequency distribution of paired assessments of pain, (Figure 1a), 23 patients assessed the same levels of pain on the 2 occasions and the remaining 41 (64%) of patients used lower levels of pain in the one-month follow-up assessments.
The significant RP value of 0.45 (95% (CI): 0.55 to -0.34) indicates that the changes in pain assessments are systematic changes in common for the group. According to the RP value, one can expect that it will be 45 percentage units more likely that patients will perceive lower rather than higher levels of pain one month after discharge from hospital as compared with the third day after discharge. The measure of additional individual variations RV, 0.01 (9% (CI): 0 to 0.02) is negligible, which means that the main explanation is that the patients are homogeneous in the change in assessments between the occasions.
Figure 1b shows the pattern of change in assessments of muscle weakness. The proportion unchanged
assessments was comparable with that of pain assessments, 35%, but the explanation of the change in assessments between the two occasions differs. Besides a significant systematic change in common for the group, RP, -0.28 (95 % (CI): -0.43 to -0.13), the RV value of 0.16 indicates additional individual variations.
According to the frequency distribution of paired assessments of re-establishment of everyday life (Figure 1c), 35% of patients perceived an unchanged level and 50% lower levels of influence on re-establishment of everyday life in the one-month follow-up assessment. The significant RP value of -0.33 (95 % (CI) -0.44 to -0.21) indicates that the changes can be regarded as homogeneous for the group of patients. The individual variations from the systematic group change, RV, 0.06 (95% (CI): 0 to 0.12), were negligible.
Table 2 shows the proportion of unchanged assessments, the measures of systematic change, (RP) and of individual variability, (RV) for all 19 items. The proportions unchanged assessments ranged from 35%,
muscle weakness, to 96%, interest in surroundings. The
most pronounced significant RP measures of systematic group changes ranged between -0.25 to -0.45, for personal
hygiene and pain, respectively. The RV values of
individual variability were negligible except for muscle
weakness. The low RV values demonstrate that the group
can be regarded as homogenous in changes of recovery level. The RP values demonstrate lower levels of problems/difficulties on the assessment one month after discharge, except for bladder function and feeling down.
Figure 1a The pattern of change in pain assessed by the PRP questionnaire for 64 patients between Day 3 and Month 1 after discharge. The diagonal of unchanged assessments is indicated
Day 3 M ont h 1 A B C D Severe pain D 1 1 Moderate pain C 4 4 8 Mild pain B 5 16 2 23 No pain A 13 13 6 32 13 18 26 7 64
Figure 1b The pattern of change in muscle weakness assessed by the PRP questionnaire for 60 patients between Day 3 and Month 1 after discharge. The diagonal of unchanged assessments is indicated Day 3 M ont h 1 A B C D
Severe muscle weakness D 0
Moderate muscle weakness C 1 4 4 2 11
Mild muscle weakness B 4 7 11 22
No muscle weakness A 10 11 6 27
15 22 21 2 60
Figure 1c The pattern of change in re-establishing everyday life assessed by the PRP questionnaire for 62 patients between Day 3 and Month 1 after discharge. The diagonal of unchanged assessments is indicated Day 3 M ont h 1 A B C D
Severe influence on re-establishment of everyday life D 1 2 3
Moderate influence on re-establishment of everyday life C 1 1 10 9 21 Mild influence on re-establishment of everyday life B 1 7 12 1 21
No influence on re-establishment of everyday life A 4 9 4 17
6 17 27 12 62
Recovery changes in dimensions
Figures 2a and 2b show the frequency distributions of the dimensions of PRP Day 3 and Month 1 after discharge, respectively. The frequency distributions for physical
symptoms (n=67) and physical functions (n=67) Day 3
after discharge is similar (Md=moderate, Q1 =moderate, Q3=mild), but a higher proportion of the category none is seen for physical function (20% vs. 30%). Similar distributions are also seen for the social (n=67) and activity (n=66) dimensions. The proportion of patients who assessed none problems/difficulties in the dimensions Month 1 after recovery ranged from 72% to 25%. Correspondingly, the range of assessments none Day 3 after recovery was 65% to 7%.
Table 3 shows the proportions of unchanged assessments and of systematic group change and additional individual variability between the PRP dimensions
changes. The RP values range from -0.42 to -0.05, indicating lower levels of problems/difficulties Month 1 after discharge as compared with Day 3. The RV values for occasional disagreement were negligible for all dimensions.
Global level
The number of items (out of 19) assessed as none problems/difficulties, defines the individual population-based profile of recovery. In Figure 3, the frequency distribution of the global recovery indicator scores is shown. The median PRP score (indicator score) Day 3 after discharge was 11 (partly recovered, q1= partly
recovered; 13= partly recovered). On the Month 1
Table 2 The measures of the proportions of unchanged assessments and of systematic group change and additional individual variability between the PRP items between Day 3 and Month 1 after
discharge. The proportion unchanged assessments (PA %), the number of patients (n), the measure of systematic change, relative position (RP), the measure of individual variability, relative rank variance (RV). The 95% confidence intervals (CI) of the measures
Item PA % (n) RP (95 % CI) RV (95 % CI)
Pain 36 (64) -0.45 (-0.56 to -0.34) 0.01 (0 to 0.02) Nausea 89 (63) -0.08 (-0.16 to -0.001) 0.001 (0 to 0.004) Fatigue 48 (63) -0.33 (-0.44 to -0.21) 0.03 (0 to 0.06) Appetite changes 83 (64) -0.12 (-0.20 to -0.03) 0.004 (0 to 0.01) Sleeping difficulties 57 (63) -0.15 (- 0.28 to -0.02) 0.08 (0.01 to 0.15) Gastrointestinal function 68 (62) -0.14 (-0.27 to -0.01) 0.004 (0 to 0.08) Bladder function 91 (67) 0.05 ( -0.02 to 0.11) 0.001 (0 to 0.002) Mobilization 39 (66) -0.44 (-0.56 to -0.32) 0.04 (0 to 0.08) Muscle weakness 35 (60) -0.28 (-0.43 to -0.13) 0.16 (0.05 to 0.28) Sexual function 88 (52) -0.07 (-0.13 to -0.01) 0.001 (0 to 0.01)
Anxiety and worry 73 (64) -0.11 (-0.23 to 0.003) 0.02 (0 to 0.06)
Feeling down 79 (61) 0.003 ( -0.09 to 0.10) 0.01 (0 to 0.02) Feeling lonely/abandoned 90 (67) -0.06 ( -0.13 to 0.01) 0.001 (0 to 0.002) Difficulties in concentration 94 (64) -0.001 ( -0.05 to 0.04) 0.001 (0 to 0.002) Social activities 56 (63) -0.26 (-0.38 to -0.13) 0.05 (0 to 0.10) Dependence on others 42 (66) -0.31 (-0.42 to -0.19) 0.04 (0.01 to 0.08) Interest in surroundings 96 (67) -0.01 ( -0.07 to 0.04)
Re-establish everyday life 37 (62) -0.33 (-0.44 to -0.21) 0.06 (0 to 0.12)
Personal hygiene 68 (65) -0.25 (-0.36 to -0.14) 0.01 (0 to 0.02)
Figure 2a The distributions of the levels of recovery in the dimensions of the PRP questionnaire, 72 patients measured Day 3 after discharge
0% 10% 20% 30% 40% 50% 60% 70% 80% 90% 100% Activity Social Psychological Physical functions Physical symptoms Cumulative proportion
Dimensional level of PRP
Figure 2b The distributions of the levels of recovery in the dimensions of the PRP questionnaire, 68 patients measured Month 1 after discharge
Figure 3 The frequency distribution of PRP scores (indicator sums) assessed by 72 patients 3 days after discharge, median score 11 (q1, 9; q3, 13)
0% 10% 20% 30% 40% 50% 60% 70% 80% 90% 100% Activity Social Psychological Physical functions Physical symptoms Cumulative proportion
Dimensional level of PRP
Severe Moderate Mild None
PRP indicator score 0 2 4 6 8 10 12 0 5 10 15 20 PRP score Frequency
Table 3 The measures of the proportions of unchanged assessments and of systematic group change and additional individual variability between the PRP dimensions between Day 3 and Month 1 after discharge. The proportion unchanged assessments (PA %), the number of patients (n), the measure of systematic change, Relative position (RP), the measure of individual variability, relative rank variance (RV). The 95% confidence intervals (CI) of the measures
Dimension PA % (n) RP (95 % CI) RV (95 % CI) Physical symptoms 42 (67) -0.42 (-0.53 to -0.31) 0.05 (0.01 to 0.10) Physical functions 43 (67) -0.25 ( -0.37 to -0.12) 0.10 (0.01 to 0.19) Psychological 67 (67) -0.05 (-0.17 to 0.06) 0.04 (0.0 to 0.01) Social 43 (67) -0.32 (-0.44 to -0.20) 0.07 (0.01 to 0.12) Activity 38 (66) -0.30 (-0.41 to -0.19) 0.05 (0.0 to 0.11)
Discussion
We described how the previously developed PRP questionnaire was used in the evaluation of patient-reported recovery after hip- and knee replacement surgery. A statistical method previously developed [13] and used [15,16] to analyze pairs of ordered categorical data from rating scales and instruments were used. The method was chosen as it makes it possible to measure individual changes of recovery levels separated from systematic group changes. This information makes it possible to decide whether a surgical intervention or rehabilitation therapy is most appropriate for individual patients or for groups of patients. It can also provide information regarding potential risk patients within specific groups. All 19 items in the PRP, except from bladder function and
feeling down, were assessed with a statistically significant
systematic change towards lower levels of problems/difficulties on the Month 1 follow-up occasion. This indicated that the group was homogenous in change. However, the reason of change in assessments differed. The items pain and muscle weakness had comparable proportion unchanged assessments between the two occasions. For pain, the observed change was explained specifically by a systematic change for the group and conclusions could be drawn regarding expected lower pain levels month one after hip- and knee replacements. For
muscle weakness, the change was partly explained by
individual variations. In an evaluation of the effect of different treatment or rehabilitation methods this is of clinical importance because it indicates the efficacy of the treatment on the group. In a group with large individual variability in change a standardized treatment method would not necessarily be the optimal alternative. This knowledge should be of great importance to highlight and be aware of when PROMs are analyzed in the different Swedish National Quality Registries. According to the Swedish Association of Local Authorities and Regions [17], the vision of the registries is to constitute an overall knowledge system that is actively used for quality
improvement and increasing the person-centeredness of clinical services.
During recovery from hip- and knee replacement, a majority of patients improve with regard to physical symptoms, for example, pain and stiffness [18] and self-reported physical functioning [19]. In this study, all PRP dimension scores showed similar progresses towards lower levels of problems/difficulties for all dimensions. Recovery dimensions can be seen as different trajectories within the overall recovery process. Critical junctures in the trajectory can be identified as either improvements or setbacks in relation to the expected outcome. It has been shown that patients who have undergone hip- or knee replacement surgery hope to achieve a level of physical function far superior to that before surgery [20]. However, functional capacity and actual daily activity do not automatically contribute to patient satisfaction. Better self-reported mental functioning, less pain and fulfilled expectations regarding postoperative pain all affect the level of satisfaction [21]. In this study, the frequency distributions for the psychological dimension included a higher proportion of assessment none problems/difficulties compared with the other dimensions. However, we analyzed the change in recovery profiles between two measurements occasions within a relatively short-term perspective after the joint replacement. In a longer perspective, the progress for different recovery trajectories would possibly differ. The greatest recovery improvements have been reported within the first 6 months after surgery [22,23].
Our main focus was on illustrating the evaluation of different levels of recovery for both individual patients and for the group. Therefore, the study population was relatively small and no comparison between the two surgical interventions was made. The PRP questionnaire was previously developed to measure general post-operative recovery. However, there might be a need for a supplementary disease-specific part of the questionnaire. Patient-related measurements of health-related quality of life, functional rehabilitation and general post-operative recovery provide different information. These outcome measures are complementary to each other and therefore
play an important role in ensuring improved outcome from joint replacement. Knowledge of recovery profiles can be used in pre-operative information to increase patient awareness of the recovery process and to facilitate the overall recovery. The PRP questionnaire could also be a useful clinical tool for physicians, nurses or other healthcare professionals in their contact and clinical relationship with individual patients, for example, during post-operative follow-up visits.
Conclusion
In conclusion, the evaluation of post-operative recovery after total knee- and hip replacement by the PRP questionnaire showed recovery changes towards lower levels of problems/difficulties one month after discharge from hospital. The global PRP score one month after discharge was 13, which means partly recovered. This progress was demonstrated in both item-, dimensional- and global levels of recovery. Data from each recovery level can be useful for quality development and in increasing the person-centeredness of clinical services. The global population scores can be used to evaluate treatment effect on a group of patients. It can also be used to define endpoints in follow-up studies.
References
[1] Canadian Institute for Health Information, Canadian Joint Replacement Registry (CJRR). (2008). 2007 Annual Report—Hip and Knee Replacements in Canada. Ottawa: CIHI.
[2] Husted, H., Holm, G. & Jacobsen, S. (2008). Predictors of length of stay and patient satisfaction after hip and knee replacement surgery. Fast-track experience in 712 patients.
Acta Orthopaedica 79 (2) 168–173.
[3] Lawlor, M., Humphreys, P., Morrow, E., Ogonda, L., Bennett D., Elliott, D. & Beverland, D. (2005). Comparison of early postoperative functional levels following total hip replacement using minimally invasive versus standard incisions. A prospective randomized blinded trial. Clinical Rehabilitation 19, 465–474.
[4] Montin, L., Leino-Kilpi, H., Suominen, T. & Lepistö, J. (2008). A systematic review of empirical studies between 1966 and 2005 of patient outcomes of total hip arthroplasty and related factors. Journal of Clinical Nursing 17, 40-45. [5] Rolfsson, O., Dahlberg, L. E., Nilsson, J-Å., Malchau, H. & Garellick, G. (2009). Variables determining outcome in total hip replacement surgery. Journal of Bone and Joint
Surgery, (British Volume) 91 (2) 157-161.
[6] Jansson, K.Å. & Granath, F. (2011). Health-related quality of life (EQ-5D) before and after orthopedic surgery. Acta Orthopaedica 82 (1) 82-89.
[7] Jahromi, I., Walton, N.P., Dobson, P.J., Lewis, P.L. & Campbell, D.G. (2004). Patient-perceived outcome
[8] Learmont, I.D., Young, C. & Rorabeck, C. (2007). The operation of the century: total hip replacement. Lancet 307, 1508-1519.
[9] Kärrholm, J. (2010). The Swedish Hip Arthroplasty Register (www.shpr.se). Acta Orthopaedica 81 (1) 3–4. [10] Knutson, K. & Robertsson, O. (2010). The Swedish Knee Arthroplasty Register (www.knee.se). The inside story. Acta Orthopaedica 81 (1) 5–7.
[11] Allvin, R., Ehnfors, M., Rawal, N., Svensson, E. & Idvall, E. (2009). Development of a questionnaire to measure patient-reported postoperative recovery: content validity and intra-patient reliability. Journal of Evaluation
in Clinical Practice 15, 411-419.
[12] Allvin, R., Svensson, E., Rawal, N., Ehnfors, M., Kling, A-M. & Idvall, E. (2011). The Postoperative Recovery profile (PRP) – a multi-dimensional questionnaire for evaluation of recovery profiles. Journal
of Evaluation in Clinical Practice 17 (2) 236-243.
[13] Svensson, E. (1998). Ordinal invariant measures for individual and group changes in ordered categorical data.
Statistics in Medicine 17 (24) 2923-2936.
[14] Avdic, A. & Svensson, E. (2010). Svenssons method 1.1 ed. Örebro. Interactive software supporting Svenssons
method. Accessed from
http://www.oru.se/hh/Elisabeth_Svensson.
[15] Svensson, E. & Starmark, J. E. (2002). Evaluation of individual and group changes in social outcome after aneurysmal subarachnoid haemorrhage: a long-term follow-up study. Journal of Rehabilitation Medicine 34 (6) 251-259.
[16] Svensson, E, Schillberg, B., Kling, A-M. & Nyström. B. (2012). Reliability of the Balanced Inventory for Spinal Disorders, a questionnaire for evaluation of outcomes in patients with various spinal disorders. Journal of Spinal
Disorders & Techniques 25 (4) 196-204.
[17] Swedish Association of Local Authorities and
Regions. (2011). http://www.kvalitetsregister.se/om_kvalitetsregister/quality
_registries.
[18] Salmon, P., Hall, G.M., Peerbhoy, D., Shenkin, A. & Parker, C. (2001) Recovery from hip and knee arthroplasty: Patients' perspective on pain, function, quality of life, and well-being up to 6 months postoperatively.
Archives of Physical Medicine and Rehabilitation 82 (3)
360-366.
[19] Jones, C.A., Beaupre, L.A., Johnston, D.W. & Suarez-Almazor, M.E. (2007). Total joint arthroplasties: current concepts of patient outcomes after surgery. Rheumatic
Disease Clinics of North America 33 (1) 71-86.
[20] Gustafsson, B.A., Ponzer, S., Heikkila, K. & Ekman, S.L. (2007). The lived body and the perioperative period in replacement surgery; older people’s experiences. Journal
of Advanced Nursing 60 (1) 20-28.
[21] Vissers, M.M., de Groot, I.B., Reijman, M., Bussmann, J.B., Stam, H.J. & Verhaar, J.A. (2010). Functional capacity and actual daily activity do not contribute to patient satisfaction after total knee arthroplasty. BMC Musculoskeletal Disorders 11, 121
establishing prognosis following total knee arthroplasty.
Physical Therapy 88 (1) 22-32.
[23] Nilsdotter, A.K., Toksvig-Larsen, S. & Roos, E.M. (2009). A 5 year prospective study of patient-relevant outcomes after total knee replacement. Osteoarthritis and cartilage/OARS. Osteoarthritis Research Society 17 (5) 601-606.