Reprint from TireTeclwmlagyInternational '99»
_ Olle
* *
PP. 75-82
rdström f
f
05 O') O') Fl'=-N
m
x U >~. a uH h :CB mI
=;
SwedishNatianalRaadand
V
Transport Research Institute *
VTI särtryck 324 - 1999
HGVs on ice - friction properties
of new and worn treads
Reprint from Tire Technology International 99, pp. 75 82
Olle Nordström
HGVs on Ice
friction properties of new and worn treads
Ensuring maximum traction efficiency under adverse
winter conditions is a major concern for safe road
transport. HGV tires have been examined to identify
potential problems and establish directions for
further research
Olle Nordström, Swedish National Road an Transport Research Institute (VTI
n the light of proposed regulations concerning the use of winter tires and similar equipment on heavy vehi cles, and the requirement of a mini mum tread depth of 3mm during winter, there is a corresponding need to investi gate the friction properties of various tire types in new and worn condition. It is also desirable that further studies be car ried out on the effect on ice friction of the new, lighter 3g studs. As a result, the Swedish National Road Administration commissioned the VTI to conduct a fric
Tire Technology International 99
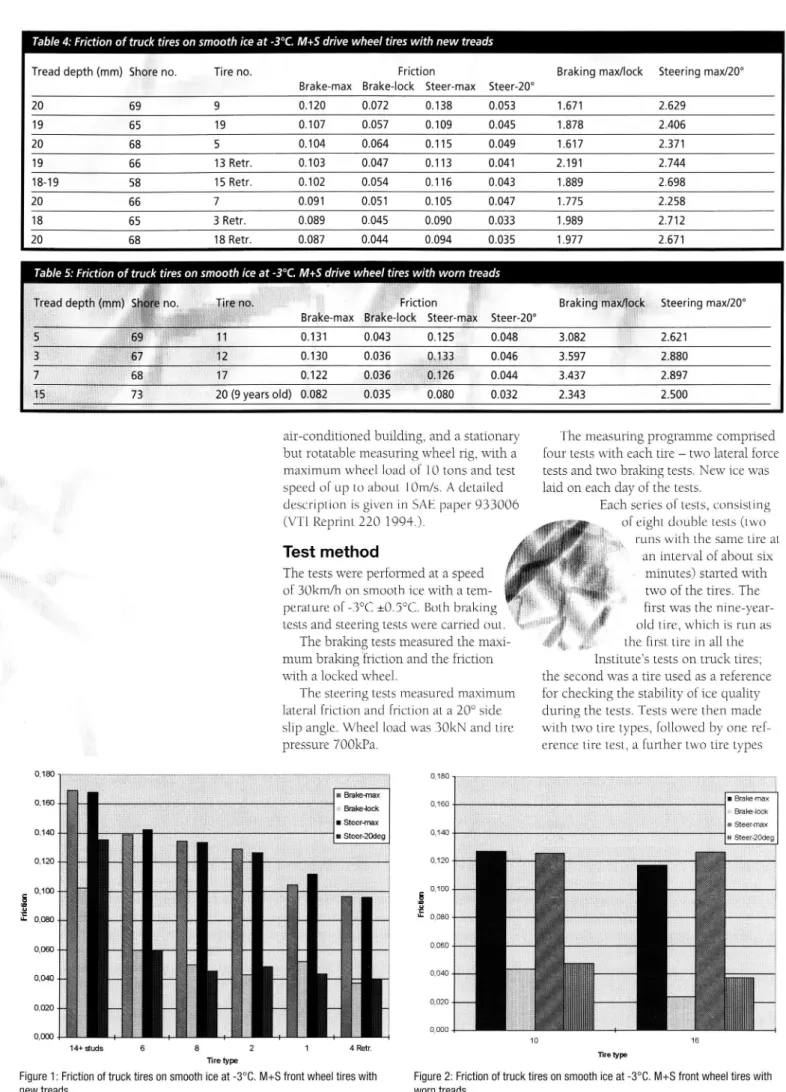
Table 1: Friction of truck tires on smooth ice at -3°C. Front wheel M+S tires with new treads
Tread depthl Shop, no Tire code Friction] _ _ Braking max/lock Steering max/20°
Brake-max Brake leek?-51,.Steer-max Steer-20°
19-20 ___...
62
14 + studs
0.169
0.103
_0.168
0.136
1.649
1.240
15 _ 65 6 0.139 0.060 0.143 0.060 2.317 2.395 16 69 8 0.135 0.050 0.134 0.046 2.690 2.934 14 618 . 2 0.129 0.043 0.127 0.049 3.000 2.608 19-20 66 1 0.105 0.052 0.112 0.044 2.010 2.575 15 66 4 Retr. 0.097 0.037 0.096 0.040 2.608 2.430Table 2: Friction of truck tires on smooth ice at -3°C. Front wheel M+S tires with new treads
Tread depth (mm) Shore no. Tire code Friction Braking max/lock Steering max/20° Brake-max Brake-lock Steer-max Steer 20°
10 64 10 0.127 0.044 0.126 0.048 2.920 2.653 5 69 16 0.118 0.024 0.127 0.037 5.000 3.419
Table 3: Friction ratio between new and worn truck tires on smooth ice at -3°C. M+S front wheel tires
Friction ratio between new and worn tire Tread depth (mm) Shore no. Tire no. (% of the value of a worn tire)
Brake-max Brake-lock Steer-max Steer 20° 19&10 __ 62&64 14;10 133 236 133 285 19&10 66&64 1;10 82 120 89 92 16&5 69&69 8;16 114 213 106 123
The test programme
The programme comprised comparative testing of the braking and lateral friction on ice of truck tires in both as new and
worn condition, with and without studs. Twenty truck tires types commonly used in Sweden (315/70R 22.5 or 12R
22.5 and, in one case, an HR 22.5) were tested, with all tires classed M+S. Accord
ing to information from the tire suppliers, demand for summer tires for heavy vehi cles is very limited in Sweden. Winter tires are fitted at the start of the winter season and are used throughout the year until
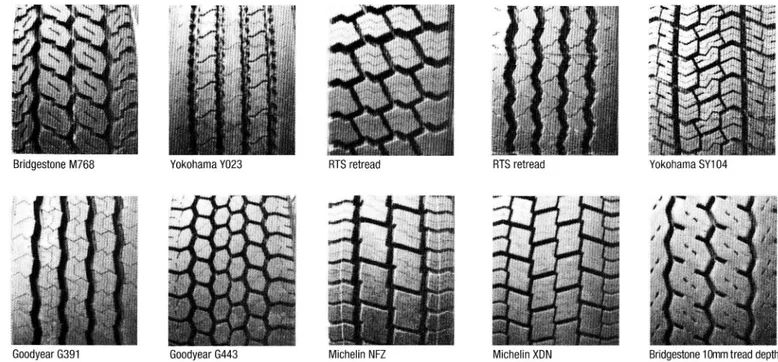
Bridgestone M768
RTS retread
lG1dooyear 0391
00010yea 0443
|V||cehlin NFZ
Tire treads used in the tests
XDN
they are replaced the following winter. As
a result, no summer tires were tested.
Five front tire types, including one
retread, were tested in an as new condi tion, with two of these also in worn con
dition, together with eight types of drive
wheel tire with new treads, of which four
were retreads. Four types of drive wheel
tire were also tested in worn condition.
One type of front tire was also tested with
248 studs. The studs were distributed in four rows on the outermost tread blocks.
One of the 20 tires was nine years old.
Test equipment
The tests were carried out at VTI s tire testing facility, which has a moving road track 55m long and 0.6m wide in an
Yokohama SY104
Tire Technology International 99
Table 4: Friction of truck tires on smooth ice at -3°C. M+S drive wheel tires with new treads
Tread depth (mm) Shore no. Tire no. Friction Braking max/lock Steering max/20°
Brake max Brake-lock Steer max Steer-20°
20 69 9 0.120 0.072 0.138 0.053 1.671 2.629 19 65 19 0.107 0.057 0.109 0.045 1.878 2.406 20 68 5 0.104 0.064 0.115 0.049 1.617 2.371 19 66 13 Retr. 0.103 0.047 0.113 0.041 2.191 2.744 18-19 58 15 Retr. 0.102 0.054 0.116 0.043 1.889 2.698 20 66 7 0.091 0.051 0.105 0.047 1.775 2.258 18 65 3 Retr. 0.089 0.045 0.090 0.033 1.989 2.712 20 68 18 Retr. 0.087 0.044 0.094 0.035 1.977 2.671
Table 5: Friction of truck tires on smooth ice at -3°C. M+S drive wheel tires with worn treads
_ _ 'Friction Braking max/lock Steering max/20°
Brake-max Brake-lock Steer-max Steer-20°
0.131 0.043 0.125 0.048 3.082 2.621
0.130 0.036 0.133 0.046 3.597 2.880
68 ..
17
0.122
0.036
0.126
0.044
3.437
2.897
15 73 20 (9 years old) 0.082 0.035 0.080 0.032 2.343 2.500
air conditioned building, and a stationary The measuring programme comprised but rotatable measuring wheel rig, with a four tests with each tire two lateral force maximum wheel load of 10 tons and test tests and two braking tests. New ice was speed of up to about lOm/s. A detailed laid on each day of the tests.
description is given in SAE paper 933006 Each series of tests, consisting
of eight double tests (two runs with the same tire at
an interval of about six minutes) started with two of the tires. The
first was the nine-year
old tire, which is run as the first tire in all the (VTI Reprint 220 1994.)
Test method
The tests were performed at a speed of BOkm/h on smooth ice with a tem perature of -3OC iOöOC. Both braking tests and steering tests were carried out.
The braking tests measured the maxi-
mum braking friction and the friction Institutes tests on truck tires; with a locked wheel. the second was a tire used as a reference
The steering tests measured maximum for checking the stability of ice quality lateral friction and friction at a 20o side during the tests. Tests were then made slip angle. Wheel load was 30kN and tire with two tire types, followed by one ref pressure 700kPa. erence tire test, a further two tire types
0,180 . , 0,180
& Brake-max l Brake max
0,160 - Brake-lock 01160
Brake-lock I Steer-max f/z Steer-max (1140 ' l Steer-20deg 0 140 _ lill Steer-20deg
0,120 _ 5 0,100- E 5: 'nå- 0080 - å 0,060 0,040 0,020 -0,000 . . 14+ studs 6 8 2 1 4 Retr. T Tire type "& type
Figure 1: Friction of truck tires on smooth ice at -3°C. M+S front wheel tires with Figure 2: Friction of truck tires on smooth ice at -3°C. M+S front wheel tires with
Tire Technology International '99 0,160 , _ , _ _ _ , 0.140
_ , I Bmke4nax 0,140 . f ~ _ , m Brake-look 0 120 _ _ I Steer max 03120 s Steer-20deg | , , 0,100 - , 0,100 __ **** _ _ , , ; _ I ' 'i ;S; fli; iii; _; _ Äh _ . 0-080' ' % 0,080 E E I LE 0,060- » 0.060 . | 0,040 -0,040 s 0020 , 0,020 &? ' ä _ 0,000 % , x. \\ E Xx: 0,000 - '
9 19 5 13 Retr. 15 Retr. 7 3 Retr. 18 Retr. 11
Tlretype
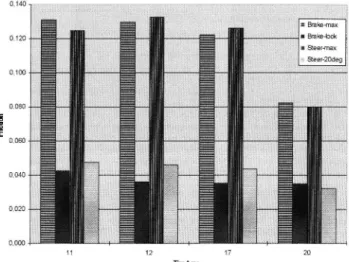
Figure 3: Friction of truck tires on smooth ice at 3°C. M+S drive wheel tires with
new treads worn treads
Table 6: Friction ratio between new and worn truck tires on smooth ice at -3°C. M+S drive wheel tires
' 'Eétween new and worn tire
Tread depth Shore no. Tire code (% of the value of a worn tire)
(mm) Brake-max Brake-lock Steer-max Steer 20° 20&3 _ 668167 7;12 70 142 79 101 20&7 "698168 9;17 98 201 110 121 20&5 68&69 5;11 79 151 92 102
The best new non-studded tire had a
maximum friction almost 1.5 times greater
than the worst new tire
Table 7: Friction of truck tires on smooth ice at -3°C. M+S drive wheel tires with new treads
Repeatability
Tread depth Shore no. Tire code , Friction W
(mm) Brake-max {Brake-lock Steer-max Steer-20°
19 65 19 0.111 0.057 0.112 0.046 19 65 19 0.109 0.056 0.111 0.045 19 65 19 0.106 0.056 0.114 0.045 19 65 19 0.106 0.059 0.102 0.046 19 65 19 0.109 0.058 0.113 0.048 19 65 19 0.105 0.058 0.113 0.048 19 65 19 0.111 0.057 0.108 0.044 19 65 19 0.107 0.056 0.110 0.044 19 65 19 0.109 0.059 0.112 0.045 19 65 19 0.109 0.058 0.101 0.047 19 65 19 0.103 0.057 0.107 0.046 19 65 19 0.104 0.057 0.113 0.047 19 65 19 0.106 0.055 0.106 0.044 19 65 19 0.102 0.055 0.107 0.044 Mean 0.107 0.057 0.109 0.045 Std dev. 0.003 0.001 0.004 0.001 Max 0.111 0.059 0.114 0.048 Min 0.102 0.055 0.101 0.044
, , ä Brakemax ~ , | Brake-lock I m Steer-max . ' Steer ZOdeg
1 2 1 7 20 Tire type
Figure 4: Friction of truck tires on smooth ice at -3°C. M+S drive wheel tires with
and a concluding reference tire test. Owing to the short interval between consecutive runs, a polishing effect on
the ice resulted, so that the first run
gave higher friction than subsequent runs. This corresponds to the actual situ ation with a heavy vehicle, where at least one tire always travels in the same track as another.
In each individual run, the braking friction test yielded a maximum value
(Brake-max) and a value with a locked wheel (Brake-lock), while the lateral fric
tion test yielded a maximum value (Steer max) and a lateral friction value at a 20o side slip angle (Steer 200).
Data processing
The mean of the respective type of
fric-tion value was calculated for each tire in a series. Mean, maximum and minimum values, and standard deviation for the four different friction measurements for all reference tire values were calculated.
The results were considered sufficiently stable to avoid the need for any correction for varying ice quality.
The relationship between the friction
means Brake-max and Brake-lock, and between Steer max and Steer ZOO was also
calculated, together with the relationship
between the different friction values for new and worn tires.
Resu s
The results are given as a summary of the means in Figures 1 to 4 and Tables 1 to 7, showing the means for the various series of tests.
The results of the tests reveal major differences in friction between the differ-ent types of tire. The best new non-studded tire had a maximum friction
Goodyear G443 3mm tread depth Yokohama 8104 5mm tread depth
MichelinZDN
7mm tread depth Michelin XFN 5mm tread depth Tire treads used in the testsalmost 1.5 times greater than the worst
new tire. If the studded tire is included,
the factor becomes 18.
Friction is reduced by wear with a locked wheel and at a ZOO side slip angle. The latter value represents conditions in skidding of the whole vehicle or excessive steering angle when entering a curve.
However, the maximum friction values
increased somewhat with wear for most tires. A probable explanation is that the contact area is larger, which is favourable for friction between dry surfaces, but
Tire Technology International 99
Boss (retread) Michelin Euromaster (retread)
5mm. The two least worn tires which had similar results had tread depths of 5 and 10mm respectively.
In earlier tests with the
same tire, siping, i.e. cutting
grooves across the tread, has been found to increase fric tion. With the new tires, siping was not found to cause any differ-ence in friction, which can be interpreted as indicating that other tread characteris-tics and rubber mixtures masked the
The compulsory use of winter tires with a
tread depth of at least 3mm would not
guarantee better friction properties on ice
unfavourable when a film of water is formed, which occurs during wheel lock-ing and lateral slidlock-ing (skiddlock-ing). The decrease in friction in the latter condi-tions compared with the maximum val ues is very great. In the worst case, braking friction decreased to about one fifth and lateral friction to about one fourth of the maximum value. For the best new front tire, about 43 per cent of the maximum value remained for both braking and steering.
Tread depth in itself does not appear to be decisive. The tire with the least tread depth, 3mm, was clearly better than the worst tire, which had a tread depth of
effect in this investigation. However, the worn tire which had the lowest value for a locked wheel had the least transverse tread detail. With the studded tire, 59 per cent of the braking capacity and about 80 per cent of the steering capacity remained.
Somewhat surprisingly, no clear rela tionship between the hardness of the tread rubber in terms of Shore number at 20°C and the measured friction was found. This is shown by the values in the Tables 1 to 7.
Discussion and conclusions Studs are the only way of preventing a dramatic decrease in braking and steering
Bridgestone W970
Bandaq (retread)
Michelin NI+S, nine years old, 15mm tread depth
capacity on ice if an attempt is
made to utilise more than the maximum available
friction, e.g. through an
excessive steering angle.
Compared with non-stud ded tires, steering capacity can be expected to be two or three times better under these conditions. The compul sory use of winter tires with a tread depth of at least 3mm would not guaran tee better friction properties on ice. The results indicate that good sliding friction properties of non-studded tires require such tires to be siped. This means a tread depth greater than 5mm probably about 8mm.
There is a substantial difference between the best and worst non studded
tire in terms of friction properties.
There-fore the designation winter tire in itself does not guarantee the best possible winter properties. The same applies to simple criteria such as soft rubber, which is often claimed to be characteristic of a good winter tire.
Consumer information based on practical tests on ice applying the proce-dure used in this investigation should help to increase safety. Further research focusing on the effects on stability, steer ing and braking properties when using studded and non-studded tires on differ
ent vehicles, and of the number of studs,
is desirable in order to illuminate the safety potential of studded tires on heavy vehicles. .