1
ASSEMBLY LINE IMPROVEMENT WITHIN
THE AUTOMOTIVE INDUSTRY:
APPLICATION OF SOFT SYSTEMS
METHODOLOGY TO MANUFACTURING
FIELD
Sandeep Gohil
Kalyani Kulkarni
FINAL THESIS WORK 2012
Production Development & Management
2 thesis project is a part of the two-year Master degree of the Master of Science programme.
The authors take full responsibility for the opinions, findings and results. Examiner: Glenn Johansson
Supervisor: Johan Karltun Credit Points: 30 ECTS Date: 2012-08-27
3
Abstract
In today’s manufacturing industry there is an increased focus to produce the right product at right time and in the automotive sector the pressure on suppliers in order to deliver is high. In this matter the organization has to have clear and reachable goals together with a production system that can meet these goals. The aim of this study was to observe and discover improvements in an assembly line called EUCD 1 at a company working in the automotive industry. The task was from a third party perspective to identify bottlenecks and put forth
recommendations for the future as to how the improvement work should be carried out at the line. The production flow has been mapped out by the use observations, interviews with personnel working on the line, qualitative and quantitative data along with System Soft methodology. The interview questions were based on Porras’ and Robertson’s Organizational framework which is divided into four sections namely technology, social factors, physical settings and organizational arrangement.
The line assembles three types of gearboxes consisting of different models which make this line very complex. This case study also includes literature studies in order to support the results found in this thesis.
This report includes a rich picture of the current state at the line for understanding how the line operates. Along with this observation and interviews have been made. Observations are supported by quantitative data and analyses to justify the problematic situation in the production line. The current state has been analysed with the help of the theories used and it revealed a distinct gap between the actual production and desired goals for the organization. The company used a methodology of solving the everyday problematic issues by temporary solutions which led to the reappearance of problems again.
The analyses conducted have resulted in general recommendation as to how the organization should be working to eliminate the different bottlenecks permanently. A desired state has been put forward that includes how the company should operate in a long term future to make the EUCD 1 assembly line more stable with less variation in standstill situations.
The report ends with a discussion of the methodology used along with the findings obtained. The three research questions are answered along with discussions regarding how we could have done this thesis in a different manner. The reports sums up with a section for reliability of the data collected and what future studies can be conducted in the area.
4
Keywords
Organizational development, Production development, Lean production, Soft systems methodology (SSM), Overall Equipment Efficiency (OEE), TPM
6
Table of Contents
1
Introduction ... 10
1.1 BACKGROUND ... 10 1.2 PROBLEM FORMULATION ... 11 1.3 AIM ... 11 1.4 RESEARCH QUESTIONS ... 11 1.5 DELIMITATIONS ... 12 1.6 OUTLINE ... 122
Theoretical background ... 13
2.1 SYSTEM THINKING ... 13 2.1.1 Reinforcement process ... 14 2.1.2 Balancing process ... 14 2.2 ORGANIZATIONAL DEVELOPMENT ... 15 2.2.1 Organizational arrangement ... 16 2.2.2 Social factors ... 16 2.2.3 Physical settings ... 16 2.2.4 Technology... 17 2.3 PRODUCTION DEVELOPMENT ... 18 2.3.1 Lean production ... 182.3.2 The seven wastes ... 19
2.3.3 Work group as focal point for problem solving ... 19
2.4 BOX SCORE ... 20
2.4.1 First time through (FTT) ... 20
2.4.2 Overall Equipment Efficiency (OEE)... 20
2.5 TPM ... 21
3
Method approach and implementation ... 23
3.1 CASE STUDY ... 23 3.1.1 Case description ... 23 3.2 DATA COLLECTION ... 23 3.3 PRIMARY DATA ... 24 3.3.1 Observation ... 24 3.3.2 Measurements ... 24 3.3.3 Interviews... 24 3.4 SECONDARY DATA ... 24 3.4.1 Measurements ... 24
3.5 SOFT SYSTEMS METHODOLOGY (SSM) ... 25
3.5.1 Stage 1 &2: The problem defined ... 25
3.5.2 Stage 3: Modelling and formatting root definitions ... 27
3.5.3 Stage 4 & 5: Building conceptual models and comparing with real world situations .... 27
3.5.4 Stage 6: Defining changes that are desirable and feasible ... 27
3.5.5 Stage 7: Taking action ... 28
3.6 RESEARCH QUALITY ... 28
3.6.1 Reliability... 28
3.6.2 Validity ... 28
4
Analysis and Result ... 29
4.1 DESCRIPTION OF LAYOUT ... 29
4.1.1 Cell 1 ... 31
4.1.2 Cell 2 ... 33
4.1.3 Cell 3 ... 33
4.2 ANALYSIS OF SYSTEM PERFORMANCE (2:ND ANALYSIS) ... 36
7
4.2.2 Building a rich picture ... 37
4.2.3 Imbalance of line ... 41
4.2.4 Technical breakdowns ... 41
4.2.5 Description of problems ... 42
4.2.6 Quality issues ... 43
4.2.7 Financial Analysis ... 44
4.2.8 Root cause definitions (point 3 SSM) ... 45
4.3 LONG TERM RECOMMENDATIONS ... 46
4.3.1 Work group organization and work task allocation ... 46
4.3.2 TPM ... 47
4.3.3 Problem solving and root cause analysis ... 47
4.3.4 Supplier issue ... 48
5
Discussion and conclusions ... 49
5.1 DISCUSSION OF METHODS ... 49
5.2 DISCUSSION OF FINDINGS ... 50
5.3 CONCLUSIONS AND RECOMMENDATIONS ... 51
5.4 SUGGESTION ON FURTHER STUDIES ... 52
6
References ... 53
7
Appendices ... 57
7.1 INTERVIEW QUESTIONS ... 57
7.1.1 Questions for line supervisor ... 57
7.1.2 Questions for production technicians ... 59
8
List of Figures
Figure 2.1 Factors Constituting the Organizational Work Setting(Porras and
Robertson 1992) ... 15
Figure 3.1 Seven steps in Soft System Methodology (SSM) ... 26
Figure 4.1 Layout Assembly EUCD 1 ... 30
Figure 4.2 Activity chart ... 32
Figure 4.3OEE Robot cell... 32
Figure 4.4 Robot cell downtime ... 33
Figure 4.5 Categories of problem robot cell ... 33
Figure 4.6 OEE End of line ... 35
Figure 4.7 EOL downtime ... 35
Figure 4.8 Category of problem EOL ... 36
Figure 4.9 Balancing process of productivity parameter ... 37
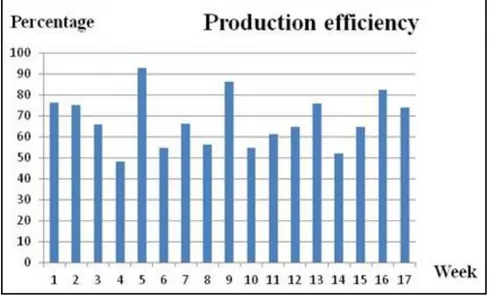
Figure 4.10 Production Efficiency at EUCD 1... 38
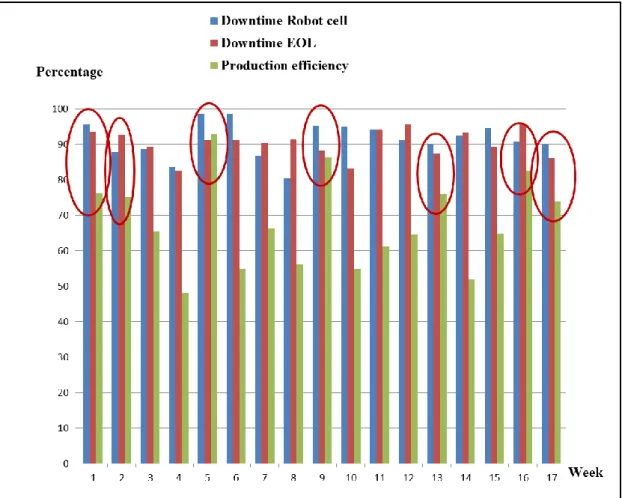
Figure 4.11Figure 4.11 Comparative graph between Downtime percentages Robot cell & EOL with production efficiency) ... 39
Figure 4.12Reality picture of EUCD 1(Current state of the system) ... 40
Figure 4.13FTT End of Line ... 43
Figure 4.14 Rework problem categories during week 9,10,11,12 & 13 ... 44
8
LIST OF TABLES
Table 2.1 Selection of theories ... 13
Table 4.1 Details of EUCD 1 ... 31
Table 4.2 Non-value added work tasks ... 41
9
ACKNOWLEDGMENT
We would like to thank the company and our supervisor Mr. Patrick Hansson, production manager in driveline plastics at the company for providing this
opportunity for us. Further we would like to give a warm thanks to our supervisor Mr. Johan Karltun, professor at Jönköping University for guiding us along the thesis project. Finally we want to thank our examiner Mr. Glenn Johansson who made it possible for us to complete our master degree.
10
1 Introduction
This chapter describes a brief background of the automotive manufacturing industry and the importance of maintaining high quality production. Further it relates to our specific study and leads to our problem formulation and aim. Furthermore research questions, delimitations and outline of the thesis are presented.
1.1 Background
In today’s fierce competition, productivity is an important factor for a company’s success and particularly Sweden is known for its “world class” development and productivity (Almstrom & Kinnander, 2007). On a national level the capacity utilization level is close to 100 % but we see that this is mostly measured by economic figures and not on what’s actually happening at the shop floor.
Furthermore, market variations and powerful customers require assembly stations to frequently change to deal with the demand in order to quickly adapt new products and variants (Bruch, Karltun & Dencker, 2008). Bruch et al. (2008) argues that workplace settings that are characterized by uncertainty needs to change, with knowledge based behavior, work roles and proactive behavior in order to contribute to competitive advantages. Further lean thinking is a set of tools to improve a business and an organization needs to manage business
enterprises as it works towards lean. It is therefore important that businesses also focus on the accounting system and measurement methods to change from traditional thinking to lean thinking by accessing data and reports that supports lean manufacturing (Maskell & Kennedy, 2007). It is very clear that the
automotive industry has created higher pressure to solve problems in terms of switching from traditional mass production to lean production (Sturgeon & Florida, 2000) whilst producing higher quantity products with improved quality. The case study has been performed on a company within the automotive industry that supplies parts for the leading automotive companies. The company showed that it was working with lean manufacturing since long time and has made relevant progress in the area, with development of cells, monitoring the performance and continuous improvements. The challenge however was to find the next step towards making the company a lean enterprise in the true sense whilst finding solutions to the distinct problems faced at cellular level. At the company our project has focused on the assembly section of the plastic division. We have analyzed a production line called EUCD 1 assembly line which produces gear shifters for Volvo, Land Rover and Ford. The assembly line has 12 stations divided into 3 cells namely Body shell assembly, Electronic assembly and Final test. The company used lean tools such as kanban, 5S, kaizen and standardized work instructions and products were produced 2 days in advance of delivery. Previously the company has implemented certain Kaizen projects on the ECUD line, but there were some issues that still remained and therefore resulted in insufficient outcomes. Thus we were provided with this opportunity to
11 observethese issues from a thirdperson perspective, to follow methodologies and theories learnt during our academic program.
1.2 Problem formulation
As a first part of the thesis project we conducted a pre study in order to
understand the assembly process better and to find possible issues affecting the productivity performance of the line.
Variability occurs in all production systems and affects performance (Hopp & Spearman, 2001). We found that the following reasons could be possible causes for variation in the processes.
i. Unplanned outages (Machine breakdowns) - The first problem was related to machine area i.e. the last station at the assembly namely the End of the line (EOL). The station had high frequency of stoppage which was
accountable for creating disruption in production.
ii. Operator variation (Absenteeism) - The second problem we encountered during the pre-study was absenteeism among operators. The lack of manpower affected the distribution of workload affecting the overall performance of the line.
We came to the conclusion that technical and human related organizational
problems would be our main areas and focus of interest. Along with these distinct problems, we have considered a more overall approach of implementing long term solutions whilst balancing the everyday production problems at EUCD 1. .
1.3 Aim
The main aim of this thesis project was to identify the root causes behind the problems causing disruption in the flow of EUCD 1 and suggest suitable
improvements and recommendations. Furthermore to design a structured process to solve the everyday routine problems at the assembly line along with
generalizing the findings to an overall production development strategy for the company.
1.4 Research Questions
Based on the problems observed and our aim we established three essential research questions to be answered in the thesis where question 1 and 2 are practical following question 3 to be more theoretical.
Q1: Why are the current productivity output targets not met at EUCD 1?
Q2: Which process of improvement and methods should be followed to increase the consistency of the manufacturing processes?
12 Q3: How can the suggested methods be used and adapted for the development of similar/future production cells?
1.5 Delimitations
The thesis project does not consider quality issues related to the product design. Rather quality that’s addressed in the production process is taken into account. Furthermore technical and design issues for the automated robotic system were excluded but maintenance i.e. working of the robot was studied and considered. We moreover did not consider the changeover time and tasks between the products since moreover all the products follow a similar assembly process.
1.6 Outline
The thesis project is divided into four main chapters of content. After this
introduction chapter followsa theoretical background which includes the relevant theory for the case. In this chapter there is an in depth description of the concepts used. Further the chapter was re-written a number of times as the project took different direction.
Following the theoretical background a presentation of the methods used during the project is presented. This chapter included how different data e.g. qualitative and quantitative data was collected.
In the next chapter in this thesis we present the result and analysis of the
problematic situation at the company, following with general recommendation for them.
The final chapter in this report is the discussion and conclusions where the discussion is based on the process by which the project was carried out with reference to the methodology and findings. Besides this the chapter reveals the reliability of the data and what future research can be made in order to make the project more enhanced.
Except the four main chapters this report also includes an appendix section that can be of interest for the readers.
13
2 Theoretical background
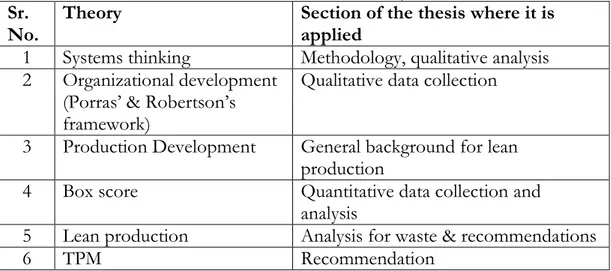
This section gives the reader the background information in the problem area from a theoretical point of view. The theory described was used both for establishing a current picture of the line as well as in the analysis phase. Further the choice of theorieswas based on the findings from pre-study conducted and alignment of the three research questions. The following Table2.1 provides information about the theories where they were applied during the project. We thereby begin by system thinking and further narrowing down to lean production and TPM.
Table 2.1 Selection of theory
Sr.
No. Theory Section of the thesis where it is applied
1 Systems thinking Methodology, qualitative analysis 2 Organizational development
(Porras’ & Robertson’s framework)
Qualitative data collection 3 Production Development General background for lean
production
4 Box score Quantitative data collection and analysis
5 Lean production Analysis for waste & recommendations
6 TPM Recommendation
2.1 System thinking
Senge (1990) defines systems as a complex network of different elements whose interactions are interdependent. Systems consist of variables whose functioning is interdependent.Systems can be observed in everyday situations e.g. an ecosystem; human organisms are composed of different systems like circulatory, respiratory, nervous etc. Social systems like families, design systems in airplane etc. Thus in all walks of life systems are observed.
Similarly, organizations are also systems where the complete effect of different interacting processes takes a long time to observe. In addition to this, these interactions being complex in nature, the control over them becomes an intangible and unclear process (Kirsch, 1996). Most often, there is immense complexity in organization since there are more number of variables involved. It is mostly hard for employees and managers to observe the whole pattern of change, being part of such systems, and thus the tendency is developed to focus on individual events(isolated parts of the system) instead of the pattern developed (Senge, 1990 pg. 7). Due to this most organizations get stuck in the vicious circle of focusing on the temporary solutions instead of solving the fundamental problems. Furthermore this failure of getting stuck with this approach can be due to many reasons, one of which being failure in
recognizing systems development due to limitations in organizational learning, design of organization or educational barriers (Lyytinen & Robey, 1999).
14 Thus systems thinking approach is a framework which allows managers to make these patterns visible and help us to manage the changes and complexity effectively. One reason that also needs to be considered in viewing the
organization management from a systems point of view is that human beings involved in the system are capable of generating their own purposes making the systems more complex and purposeful (Senge, 1990 pg. 10). In order to understand constraints and elements of a system we need to recognize Mental
models and Boundaries. As stated by (Senge, 1990 pg. 8) “Mental models are
deeply ingrained assumptions, generalizations or even pictures or images that influence how we understand the world and how we take action.” Boundaries to systems are the limiting factors that hinder the development process. This ideology is the base of the organizational development model developed by Porras and Robertson and will be explained further in the upcoming chapter. Further if change is contemplated with the existing mental model it leads to first order learning, whereas if change is contemplated by radically changing the existing mental models to fit the patterns of change, it leads to effective second order learning. In a single variable the boundary can be easily visible, e.g. in case of machine, organism but in a system, identification of boundary is not precisely apparent. The second order learning is important to realize the actual boundaries of the system.
Senge (1990 pg. 69) says that “Systems thinking offers a language by restructuring how we think”. Systems are based on two components
(Balancing and Regenerative processes) and are explained in the next sections. Systems thinking begins with understanding the concept named “feedback” that is based on cause and effect of actions. In simple terms it involves learning the structures that manifest an archetypal pattern of escalation. In order to develop these patterns which are based on cycle of events, there are mainly 2 types of feedback processes namely reinforcing and balancing processes.
2.1.1 Reinforcement process
Reinforcing feedback types of processes manifest as amplifying processes either generating growth or decline. These processes are observed when relationship between cause and effect starts to amplify e.g. increased sales or decreased sales of a product due to mouth-to mouth publicity of the quality of the product (Senge, 1990 p. 79).
2.1.2 Balancing process
A balancing feedback process is goal oriented, and it takes place when a gap between the desired goal and actual state is observed. A balancing system requires stability (Senge, 1990 pg. 83). Effective planning creates a balancing process, which is satisfied only if either, enough efforts are generated or goal is weakened. Most of the time, this process goes unnoticed in reality. In addition to these processes there are often “delays, interruptions in the flow of
15 influence which makes the consequences of the actions occur gradually” (Senge, 1990 pg. 79).
2.2 Organizational development
Organizational development (OD) focuses on planned change and follows Kurt Lewis statement “In order to truly understand something, try changing it” (Porras& Robertson, 1992). Even if organizations know how to do things, like building automobiles, what does it really mean? (Dosi, Nelson & Winter, 2000). Although many contributions have been established to OD the field still has its problems. The purpose of this section is to view the change associated with organizational development by the use of Porras and
Robertson’s organizational framework that focuses on the technical and social aspects of the system. Porras and Robertson develop this framework because they believe that focusing on identifying the key factors influences the on the
job behavior will give a picture how the current working conditions are in an
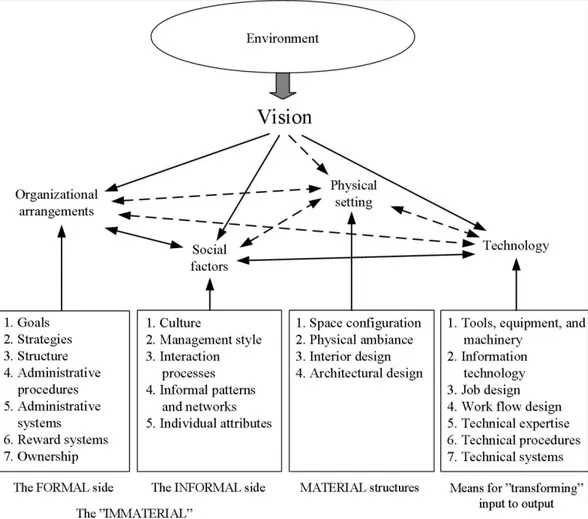
organization. These work setting factors have been divided into four categories according to Porras and Robertson (1992) and can be seen in Figure 2.1.
Figure 2.1 Factors Constituting the Organizational Work SettingOrganizational arrangement
16
2.2.1 Organizational arrangement
The organizationalarrangement consists of underlying categories as seen in Figure 2.1 above, where it explains the formal elements by which the
organization has to coordinate the people and their behavior. Usually consist in written format for all employees to know but not necessarily be adopted by each single individual. One of the strongest strategic points is to clarify the organizations goals and strategy in order to reach the goals. The goals and strategies are closely linked to each other and the strategies specify how the goals will be achieved. The question is which pattern to follow and how the environment needs to interact in order for the organization to achieve its company goal (Porras& Robertson, 1992). But the process to achieve goals and set strategies will be dependent on the formal structure which refers to the formal work roles and responsible tasks for each individual (Porras&
Robertson, 1992). Furthermore the formal structure defines the different subsystems and the relationship amongst them and how the information flow combines these to each other (Friedkin, 1982). In an organization, different reward systems can be applied and Gerhart & Bretz (1994) argue that workers tend to respond if only there is some kind of reciprocal obligation e.g. a sense where managers notice the value of skilled workers and are willing to delegate responsibility.
2.2.2 Social factors
The social factor covers the individual factors such as groups, interaction, patterns etc. Draft & Lengel (1983) explain that in both confusing
environments and internal differences, organizations must create an acceptable level of order where managers explain structure and clarity for the individuals in order to get right data and information from the participants. This will form social norms and procedures along with establishing an organizational culture. The culture in an organization has been a topic of much interest over the years yet it is hard to understand, as it is a complex phenomenon including many elements that need to fit in order to have a positive environment (Edgar, 1990). Training of individuals has become vital during the past decades and it is the supervisors e.g. managers responsibility to train workers accordingly. Thus there is a lack in industries to improve the work as to how it is being conducted after training (Robinson & Schroeder, 1993).
2.2.3 Physical settings
The physical setting explains the external factors that affect individual, both positively and negatively for them to perform their responsible tasks. The settings don’t take into account non-technical/non-social part of the work environment (Porras & Robertson, 1992). The physical ambiance affects performance and behavior at work. Tyre & Hippel (1997) explain that each setting represents a mix of resources that can be used to solve different
17 problems in a non-formal way which generates confidence and a feeling of being noticed. Secondly a learning organization will be dependent on the physical settings in order to establish a comfortable environment for example problem solving and decision making.
2.2.4 Technology
This final category in Porras & Robertson’s organizational framework explains the technology and encompasses all the factors that transform the
organizations input to output (Porras & Robertson, 1992). There are a number of different aspects that need attention. First of all, the tools, equipment and machinery are important as they produce product output and refer to any physical objective that creates an object, product or service (Porras & Robertson, 1992). The size and time taken in order to produce the right object can vary from complex and large to simple and small with and estimated variation of time. According to Peters & O’Connor (1980) much progress has been made to identify the variance in terms of individual ability and motivation, but variance in performance needs a complete understanding so that the interaction together with the measurement variables such as
preparation, tools and equipment can be established and decrease the
performance variance. The machinery determines the takttime e.g. work flow design and in a production line, jobs determine the creation of a specific flow and are co-dependent on knowledge in the process for it to produce the right products/goods (Porras& Robertson, 1992). Ballard (1999) states that 100% capacity is possible if it can bepredicted accurately. However due to high production variance, the work flow is not highly reliable. Manufacturing is a segment with high variance in order to control this; the job design acquires critical knowledge, skill and ability in order to perform jobs in terms of select, place and train workers for a specific job task. The requirement objective is to fulfill the current job design but also to generate new job designs or redesign existing ones (Ilgen & Hollenbeck, 1990). Moreover the job design combines a series of tasks which are performed by individuals to control work processes, get feedback, and to use the variance of skilled possessed and continuous interaction with other members (Porras & Robertson, 1992). To establish a preset of job design the methods for performing tasks in the transformations input to output are to be described. These are very briefly described and they directly relate to the transformation process (Porras & Robertson, 1992). Moreover it takes into account the specific task that requests to be performed in a specific way. A supporting tool is to have a technical system that provides the status of different features. It can include variance in different systems in real time control for example inventory system, maintenance system etc. (Porras & Robertson, 1992.). The persons responsible for maintaining the system are the technical expertise that includes individual level of skill and knowledge that will allow them to conduct different types of task that requires special skills (Ballard, 1999). The system can be used to plan and carry out maintenance activities and to have an effective maintenance system is critical as it extends equipment life with proper condition (Swanson, 2001).
18
2.3 Production development
Production development is a term more traditional than production
engineering (Bellgran & Säfsten, 2005 p. 2) and it describes the need for long term actions in production system development. With the ongoing increasing competition, the focus on production has a more or less value for every manufacturing company, not only in Sweden but the rest of the Western world (Bellgran & Säfsten, 2005 p. 2). One way of improving the current production system is by the use of tools and methods supporting the way of working within the production cell. The ongoing condition of industrial change on a regular basis and as the company isamajor factor in the market it comes with opportunities as much as change of requirements (Bellgran & Säfsten, 2005 p. 3). Nowadays, customer expects much more than low prices for e.g. high quality products and on time delivery. Factors such as delivery at right price along with requiring suppliers with continuous development of new products, companies tend to give more attention towards outsourcing and production is instead movedtolow wages countries such as China. One main reason for this move is that companies in Sweden see the world as a big factory and are maximizing profit when facilities are located in a different place of the world (Bellgran & Säfsten, 2005 p. 4). The accepted traditional concept of mass production practiced in the automotive industry was challenged by lean production in the 1990’s and has led to changes in the manufacturing industry (Holweg, 2007). One aspect that has been historically separate is productivity and quality (Gunasekaran, Korukonda, Virtanen &Yli-Olli, 1993). This is due to the fact that quality has not been given the equal amount of importance compared to productivity. Nowadays right quality goods eliminate unnecessary costs and reworks whilst improving
productivity.The next session explains the basics of lean along with Toyota production systems that has become a global phenomenon to think lean.
2.3.1 Lean production
Lean production is a foundation practiced in order to reduce waste
transactions and has a customer focus along with continuous improvements (Liker & Morgan, 2006 pg. 5). Most of the manufacturing companies today have started with lean initiatives and it is spread across diverse range of industries. But in spite of implementing lean tools companies have learned that selective application of lean doesn’t lead to sustainable improvements. (Liker & Morgan, 2006 pg. 5). Liker et al. (2006) argues that companies are required to have some sort of lean program/tool in order to stay competitive as mass production has been replaced by lean production. Lean production, often referred as Toyota system is an “ideal state” through simplification and contains several different concepts (Fujimoto & Takeishi, 2001). One of the concepts is the elimination of the seven wastes which is described more in detailed in upcoming section.
19
2.3.2 The seven wastes
One of the first steps in lean is to understand what customer value is and in order to do so identification of necessary activities and resources is required (Poppendieck, 2002). When this is understood, the rest are wastes and non-value adding activities towards customer. There are seven different wastes (Muda) identified by the master himself, Taiichi Ohno which are;
Overproduction
Inventory
Extra processing steps
Motion (Movement)
Defects*
Waiting*
Transportation
In our thesis project, defects and waiting are the two essential identified waste activities. Defects relates to problems such asfrequent errors, product quality problems or poor delivery performance (Hines & Taylor, 2000). The bottom line is that defects are a cause of direct costs. With reference to Toyota production system, defects should be seen as opportunity to improve rather than something traded off, which instead is poor management (Hines & Rich, 1997). Waiting refers to activities where people are inactive (Hines et al, 2000). The waiting among people can occur for example when machinery breaks down and it leads to a poor flow along with longer lead times. Waiting can also occur when goods are not moving or if the previous production cell isnotoperating (Hines et al, 1997). An ideal state should be a one piece flow which leads to faster and more consistent produced products with minimum defects. The waiting time is seen as a non-value adding activity and should be used for training, maintenance activities etc.
2.3.3 Work group as focal point for problem solving
One of the principles of Lean is developing exceptional people and teams. According to this principle the focal point of problem solving activities are the work groups or teams at the shop floor who are responsible for value added activities. It is however also a challenge to accommodate the problem solving activities in between the process of maintaining daily production. (Liker et. al 2006) In lean thinking these value adding people find themselves at the top of the hierarchy while the rest of the members in the hierarchy are to provide support to the operators. The next in line after the team members or operators is the team leader. The team leader is a person who has spent a considerable time on the line and has gained enough knowledge about it. The next in line is the group leader or supervisor who is responsible for
20
2.4 Box Score
In visual management box score is an efficient tool for weekly measurements and keeping track of how the value stream is performing. Box score helps to monitor how a value stream is performing with measurement figures etc. As company works towards lean manufacturing and overlook the entire flow of the production instead of each single production cells, it has become more important for an organization to present the stream in a better way (Maskell & Baggaley, 2004 p. 146). Box score enables one to present in a consistent way, different types of lean targets for example FTT (first time though), OEE (Overall Equipment Efficiency) It helps a team to keep a track on key information and keeps everyone informed about the current state, to keep tracks of the efforts being taken to improve the value stream in order to meet the long and short term goals. The benefit of box score is that it can be applied throughout the organization which makes it understandable for everyone (Maskell & Baggaley, 2004 p. 147). Within a lean organization, all personal have a common view and language in order to talk about how the production line is performing.
2.4.1 First time through (FTT)
The first time through is a measurement of quality and has the purpose of monitoring if the right product is produced the first time (Salomon, 2003 p. 33). Even though it keeps track on scrap-, rework-, and repair rate it’s more a measurement of the effectiveness of the standardized work which is an important feature in lean production. Standardized work will more or less guarantee that the right products are produced the first time. In a FTT report, percentage of products produced without any rework or scrap in the first attempt is calculated. In simple terms percentage of products which are
accepted as first time through in terms of quality are calculated as given by the following formula:
FTT= (Total Units Processed – Rejects or rework) ÷ Total Units Processed
2.4.2 Overall Equipment Efficiency (OEE)
Another performance measure is Overall Equipment Efficiency (OEE) which is a time and quality based measure (Bellgran & Säfsten, 2010). Furthermore OEE is a support tool for total productive maintenance since it monitors the production capability in the machine.OEE is used to monitor the efficiency of automatic and semiautomatic production systems (Bellgran & Säfsten, 2010). OEE is addressed to the machines within the cells (Solomon, 2003 p. 37) and tracks the machines ability to produces right products in right quality. In cells the total cycle time is dependent on the machine and requires tracking of three measurements; downtime, production rate and FTT. It’s important to use the
21 OEE for the right machines e.g. the bottleneck as calculating OEE is time consuming.
OEE requires three types of data; machine availability, machine performance and quality of products and is calculated as:
OEE= Availability*Performance efficiency*Quality
Each of these measurements below is calculated as follows:
Availability= (total machine time available – downtime)/ Total time Performance efficiency=Actual run rate/ideal run rate
Quality= (total quantity manufactured – Number rejected)/Total quantity manufactured
2.5 TPM
In order to achieve high quality performance companies tend to improve productivity and reduce cost as much as possible. In order to do so, an efficient maintenance system is required. It will not only extend equipment lifetime but also produce right products at the first time (Swanson, 2001). Traditionally manufacturing companies tend to use reactive maintenance e.g. fixing machinery problems when it happens. Assembly lines consisting of machinery need attention to maintenance activities in order to prevent breakdowns and establishing high quality products. Total productive
maintenance (TPM) is one system that can increase the consistency of a line in order to maintain a high level of productivity (Borris, 2006). According to Bellgran & Säfsten (2010) maintenance is defined as technical and
administrative actions that include maintaining or restoring a unit to the condition where it allows the function desired. TPM consists of not only maintenance activities andmachineries but also leads the organization towards improvement activities of equipment. Moreover according to Bellgran et al. (2010) TPM has its base in three corner stone’s namely follow up of
operational disturbances e.g. by the means of measurement tools such as OEE which will help in finding the factors limiting the production. The second corner stone is to have an operator maintenance that will be of use to suggest how maintenance and production should work as one unit. The final stone in TPM is the environment e.g. enhancing a climate that provides the production with the support and resources needed to continuous improvement.
Similar to the wastes included in the Lean theory, there are 7 wastes included in the TPM theory. They are mentioned as follows (Sekine & Arai, 1998).
22 1) Minor stoppages, major stoppages: Waste due to minor
stoppagesoccurs when certain equipment keeps stopping and starting causing disruptions in the rhythm of the process. The timing of stoppages last up to 4 minutes. It can be caused due to a work piece getting caught in machine parts, jamming of parts, work getting
crushed or damaged during assembly, parts not being grasped properly or sensors of the machine giving wrong readings, computer display malfunctioning and even due to shortage of material supply.Waste due to medium or major stoppage occurs when the equipment stops
functioning causing the entire line to stop. Medium stoppages last from 4 to 30 minutes whereas major stoppages last for more than half an hour. They usually occur during production start-up. These occur due to not understanding the weak points of the machinery or due to severely deteriorated parts.
2) Lengthy set up times: This waste occurs when changeover goes wrong and changeover process is not standardized. This can also be a result due to not recognizing deviations from standards.
3) Manual rework, defects, faulty products and low yields: This waste is resulted due to chronic problems with machinery and equipment consequently leading to a lower FTT and lower yield. The problems with machinery can occur due to chronic abnormalities, haphazard setups, frequent changeovers and strenuous work.
4) Planned downtime: These wastes occur due to the capacity of the equipment exceeding the demand from the equipment or insufficient skill among older operators for operating advanced equipment or untrained operators.
5) Incomplete 5 S application: This occurs when the last 2 S’s (standardize and sustain) of 5 S are not implemented. This waste is resulted due to poor maintenance of the working environment which can cause hazards to the equipment, tools or fixtures.
6) Overproduction by large equipment: This waste occurs due to production of unfinished or finished inventory. This occurs because large equipment tends to have a more complex changeover process resulting in less frequent changeovers.
7) Equipment problems at production startup: This waste occurs when the machine designers and users lack exchange of ideas which can result in equipment problems in the initial phases.
23
3 Method approach and implementation
This section explains the case description, the chosen research method and techniques that were used during the thesis work. It also gives explanations as to why these methods were appropriate and supported by the theory.
3.1 Case study
Case study research helps to develop an understanding of a scientific phenomenon in its natural setting (Williamson, 2002). This allowed deeper understanding of the issues related to the organization and increased the relevancy of the recommendations for the line. It enabled us to find possible root causes for the production problems encountered.
The delimitation of a case study approach is that the data collection analysis will be heavily dependent on researcher’s previous experience and
interpretations (Williamson, 2002). In order to improve the reliability during the project, the measures were repeated during a long period of time e.g. absenteeism statistics, time studies etc. To handle the delimitations external supervision was helpful to broaden the perspective.
3.1.1 Case description
The project was been carried out at Kongsberg Automotive AB located inMullsjö, Sweden. The company manufactures driveline system components for automobiles like cable systems, throttle controls and transmission shift control systems. The area chosen for improvement was EUCD 1 which manufactures gear shifters for the companies’ key customers Volvo, Ford and Land Rover. Previously, many Kaizen events had been carried out on this line, but without any sustainable results. The production manager wanted to
investigate what were the exact causes for the production variance and
therefore we were given the project. Thus according to our research questions we started with identifying the factors that affect productivity targets and later to find improvements for the same.
3.2 Data collection
The data gathered during the thesis project were both qualitative and
quantitative. According to Williamson (2000) by the use of multiple sources of data collection can be used in case studies such as observations, interviews and questionnaires. When deciding the data collection techniques the researchers should have in mind the two types of data e.g. primary and secondary data. Primary data refers to data collected for the first time whilst secondary refers to data collected by someone else which can be used for further analysis (Kothari, 2004).
24
3.3 Primary data
The following section gives the source of the primary data used during this project
3.3.1 Observation
Observation is a data collection technique in which the researcher observes processes and behaviors over a specific period of time (Thietart et al. 2001). In this thesis project we have observed the individual work stations at EUCD 1. Observations have been a primary data source for identification of problems in the line. The observation of each individual work station has been helpful for the basic understanding of the assembly line.
3.3.2 Measurements
Time measurement was used for finding the timings of different activities at the individual work stations at EUCD 1 in order to check the flow and the balance the line. Further this detailed time study was used to prepare the activity chart. During the pre-study we measured the actual process times at the different stations in the line to compare them with the actual overall takt time.
3.3.3 Interviews
For this thesis interviews were conducted with production and quality technicians, operator and line supervisor. The questions can be found in appendix and were based on Porras and Robertson’s organization framework. The interviews were also recorded so that no information was lost. During the interviews Thietart et al. (2001) recommend to tape the interview in order to not to miss out on any information. The interview was conducted with line supervisor, maintenance manager, production manager, quality technician, production technician, maintenance operator and four assembly line operators.
3.4 Secondary data
This section contains the data we obtained from other sources at the company.
3.4.1 Measurements
Data was collected from different departments within the company to assist our findings and suggestions. We hadtaken datafrom control sheets to find deviations in quality of the products and studied the maintenance activities from shift records. Furthermore a closer look into statistical data e.g. FTT. From the shift records we also took daily productivity data and absenteeism.
25
3.5 Soft systems methodology (SSM)
SSM is a cyclic process of learning which takes place from identifying a
problematic situation to defining or taking action to improve it. (Checkland & Poulter, 2010).Soft systems methodology (SSM) is a tool to handle complexity in real-life problem situations (Checkland, 1999, pg. 11). It is a framework used to address chaotic situations which lack in proper root definition.One important advantage of using SSM is to constrain the extent of the situation and thereafter expand it in detail (Williams, 2005).Thus the unstructured problem gets a moreover structured model and enables the researcher to evaluate different developed models corresponding to the goals. SSM is based on core elements of worldview and human actions involved in everyday situations (Checkland & Poulter, 2010). Therefore SSM can have wide range applications ranging from service sectors to information sectors. It enables of perceive an overall view by means of linear step-by step approach. (Ison, 2008)SSM follows 7 steps of implementation mentioned as follows (Lester, 2008) and can be seen in the following Figure.3.1.
1. Identifying the problematic situation. 2. Building a rich picture of the situation.
3. Formulating root definitions of relevant systems (Key processes that need to take place within the desired system).
4. Building Conceptual Models of Changed Systems. 5. Comparing the models with the real world situation. 6. Defining changes that are desirable and feasible. 7. Taking action.
3.5.1 Stage 1 &2: The problem defined
This stage doesn’t mean defining the problem directly but identifying the area of general interest to improve. The definitions and organizational boundaries are not fixed, making the framework more flexible and enabling changes in the boundaries at a later stage. It is a starting point which can shift as different aspects get involved with the existing situation (Ison, 2008).The boundaries get shifted because of the fact that each person has different perspective and interest, thereby different judgments are made based on the same situation. (Ison, 2008).As stated by Checkland (1999) the second stage is characterized as “Building a rich picture”; since a rich picture helps to understand and formalize existing situations better. The purpose of the second step is to build a deep presentation of the current situation (Lester, 2008 pg. 1). The picture should be constructed by considering criteria such as structure, processes, climate, issues expressed by people and conflicts (Williams, 2005).
26 Figure 3.1 Seven steps in Soft System Methodology (SSM)
27
3.5.2 Stage 3: Modelling and formatting root definitions
Modelling involves “moving away from the “real world” into the world of systems” (Williams, 2005). A purposeful model is one that is a linkage of activities which together forms a purposeful whole (Checkland & Poulter, 2010). A clear definition of the purposeful activity to be modelled is required tobuild a complex situation model. This stage is the most challenging stage and involves understanding of different perspectives that influence a situation. SSM tries to address all these perspectives that have an impact on the nature of the purposeful activity (Checkland, 2010).It is carried out by selecting a perspective and putting it through CATWOE analysis (Customers, Actors, Transformation, Worldview, Owner and Environment).
Customers are the oneswho benefit from this transformation
Actors are thosewhofacilitate the transformation these customers and
people involved in transformation activities.
Transformation refers to the process from “start” to “finish” and what is
changed.
Worldview gives the transformation a meaningful perspective.
Owner is the one that controls the transformation.
Environment refers tothat which influences but does not control the
system e.g. constraints outside the system.
3.5.3 Stage 4 & 5: Building conceptual models and comparing with
real world situations
A purposeful model provides a structure for discussion bringing out some of the important worldviews that may require making changes or alterations to perform improvements. (Checkland & Poulter, 2010) The model has
processes which are governed by an equation of “PQR”. Where P= what should be done, Q= how it is carried out and R= for achieving what type of result (Lester, 2008). This equation is primarily used in building conceptual models. Thereafter, this conceptual model is compared with real-life scenarios, where feasibility of the model is confirmed.
3.5.4 Stage 6: Defining changes that are desirable and feasible
Assessment of existing resources is carried out and all possible constraints are identified to make appropriate changes in the model. It also involves
discussions to identify changes that are not only desirable but also culturally feasible i.e. it is required that everyone agrees for a common platform and even the conflicting worldviews are addressed (Checkland & Poulter, 2010). This results in making the formulation of models and implementation plans in a generalized manner (Checkland, 2005).
28
3.5.5 Stage 7: Taking action
This stage involves physically starting the implementation process of
addressing the problematic situation. The evaluation of the model is done by conforming that the model is compatible to the real life situation. The effect is monitored after implementation and further improvement possibilities are identified. It is a continuous learning cycle which focuses on rigorous
analytical process. (Checkland& Poulter,2010).This learning cycle takes place on account of a conscious reflective process which takes place before, after or during the real life problem situation. (Checkland & Poulter, 2010).
3.6 Research Quality
3.6.1 Reliability
According to Williamson (2002) achieving the same results and findings with a repetitive study or experiment will determine the reliability of the study. Our research was a case study performed within the automotive industry and leaves a question as to how reliable our study was. If future studies with similar approach to the specific line will be conducted, we believe that the result will vary.
3.6.2 Validity
A research has two types of validity, internal and external (Yin, 1994). Internal is the quality of the work whereas external explains the generalization level of findings. In this study the internal validity comes from the method we had chosen with the use of data collection techniques along with our approach. For our external validity we have used research methods from previous researchers but from another field e.g. SSM is used within the IT sector. With this we have established research questions. We thereafter stated different pictures about our findings and result to illustrate the current state at the company.
29
4 Analysis and Result
This chapter gives an overview of the assembly process along with detailed analysis of current working condition at EUCD 1.
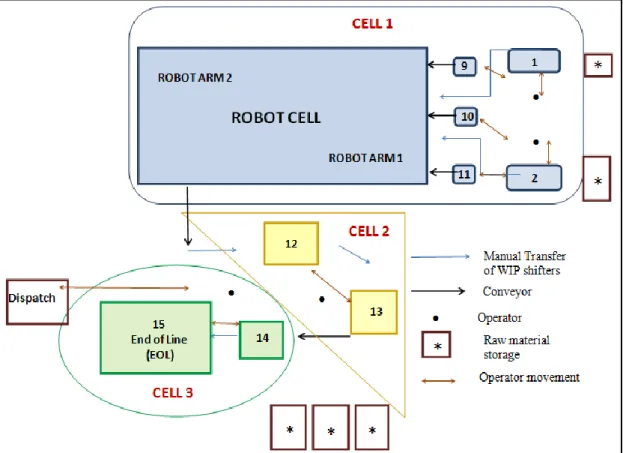
4.1 Description of layout
As seen in the layout Figure 4.1, the assembly line EUCD 1 is divided into 3 cells. The first cell is named as Body shell Assembly, second cell is called as Electronic
Assembly and the third cell is called as Final test. The details such as number of
operators, raw material storage, material transfer, operator movement, station details and throughput times are shown in Figure 4.1 and Table4.1. The description of the 3 cells is described in the upcoming sections. Each section explains a detailed description of work process, impressions from our
observations supported by quantitative data and ending with concluding statement about the overall view of the cell.
30 Table 4.1 Details of EUCD 1
Cell
No. Station No. Description of Stations time(Seconds) Throughput
1 1 Manual pre-assembly 35
2 Manual pre-assembly 25
9 Manual infeed of material 10
10 Manual infeed of material 10 11 Manual infeed of material 10 Robot cell Automated Assembly of raw
shifter 65
2 12 Manual electronic assembly 30 13 Semi-automatic knob and panel
assembly 25
3 14 Manual cable assembly and
testing 40
15 End of line (EOL) automatic
final testing 70
The table 4.1 above shows the three areas and their substations. Throughput time for each individual station is also provided. These are shown graphically in the following Figure 4.2
31 Figure 4.2 Activity chart
4.1.1 Cell 1
This cell had the objective to assemble the main body shell which formed the foundation of the gear shifter. Around this component other parts were
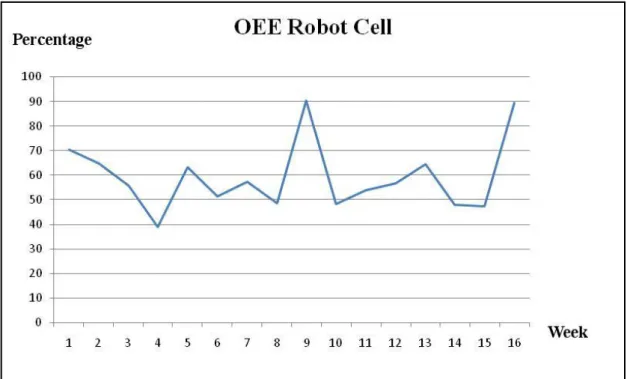
assembled. This core component was assembled in the robot cell which received sub-assemblies of other components from stations 1, 2, and in feed material from stations 9, 10 and 11. Station 2 carried out these tasks of assembling the basic components of the main body shell and placing the semi-finished assembly on the conveyor for further processes. Station 1 supplied another semi-finished assembly of release rod. Individual work stations were designed ergonomically but had restrictions due to space and material storage of raw materials. Therefore operators faced some uncomfortable movement activities at station 1 such as picking up body shell parts due to inconvenient material storage in the pallets. Moreover cell 1 was designed for 2 operators where one operator worked between stations 1 and 9 and another operator worked between 2, 10 and 11. All the work stations were designed according to principles of 5S where standardization was practiced at a great extent. All the activities were performed by standard operating procedures. In case when there was a lack of operators, the stations were managed by single operator, but this resulted mostly in batch production due to buffers instead of desired one piece flow.The station with frequent breakdown causing variation in production was the robot cell consisting of two robot arms. We therefore conducted an OEE for the same which is displayed in the Figure 4.3 below.
32 Figure 4.3 OEE Robot cell
As seen in Figure 4.3 there is a high variation in the OEE values with an average taken for 16 weeks as 55.81%. This is an important reason affecting productivity figures. Along with the OEE we can observe the following Figure 4.4 of machine downtime during 17weeks.
Figure 4.4 Robot cell downtime
Thus we observed in Figure 4.4 that the robot cellis rather complex in nature and were a major bottleneck which needs to be focused on. Further other stations in cell 2 and 3 were dependent on the robot cell. Moreover the other stations consist
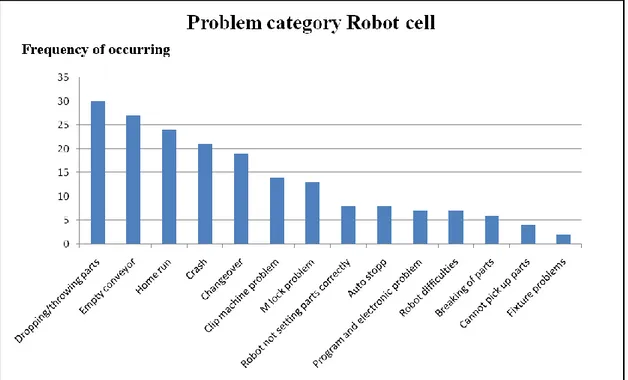
33 of more manual activities which can be improved. Considering these reasons, the primary concern should be robot cell. The total downtime observed during the 17 weeks comes out to be 110.5 hours and the average downtime per week comes out as 1.3 hours. We took a closer look at the weeks with higher downtime (2, 4 and 8) and found common category of problems displayed in Figure 4.5 below.
Figure 4.5 Categories of problems in Robot cell
4.1.2 Cell 2
The main body shell assembled in the cell 1 entered this electronic assembly cell. The operator took the main body shell and assembled electronic parts such as solenoid, PCB box and detection pin. This operation was followed by knob and panel assembly after which the assembled shifter was finally placed on a conveyor for the final cell. The operators followed a standard way of working with the assembly process. There was one operator working between stations 12 and 13. We observed during the time study that these stations followed a balanced work flow with least disruptions in the assembly process. The productivity was mostly affected due to lack of resources and the operators found it difficult to balance these stations since they had most of the manual operations in this cell. The conveyor after station 13 had a buffer capacity of 6-7 units which was suitable for maintaining low a WIP. Thus we saw that the stations were designed in such a way that very low WIP was allowed so that problems could be brought to surface.
4.1.3 Cell 3
This cell included 2 stations for final inspection and testing. Station 14 activities included assembling of final electronic elements, tightening and connection of wires and springs. This was followed by a manual test by the operator to check the
34 smoothness of manual operating movements of the shifter. After the manual test was completed, the finished gear shifter was put in End of line (EOL) station which performed a thorough check of working of the shifter by applying specific standard pressures and forces while performing all the visual checks. One
operator was responsible for managing the work at both these stations. The End of the line governed the takt time of the entire assembly process since it had the highest cycle time than all the other stations since there was always a waiting time of around 50-60 seconds observed at this station. This was due to the design constraints of the machine. The machine consisted of 2 compartments with 2 fixtures. The cycle time of the testing process was approximately 70 seconds. When one shifter was undergoing the test, there was a waiting time of
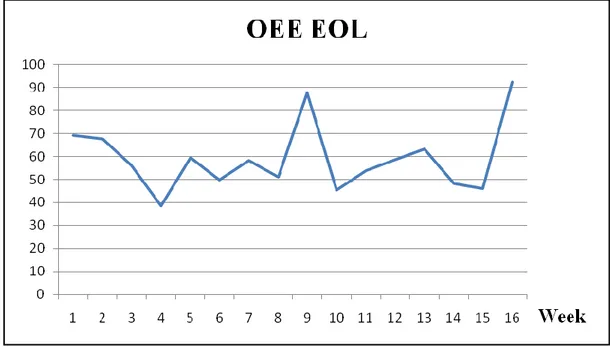
approximately the same for the next shifter. This was due to the previous station 14 having a lower cycle time of about 40 seconds. Thus, around 30 seconds of waiting time was observed. This waiting time can be reduced by increasing the cycle time of the EOL. However there are technical restrictions on EOL, since the speed of the robot arm cannot be increased beyond a certain limit to prevent damages on the shifter. The cycle time of EOL therefore governed the takt of all the cells and was also the same as required takt time. After the EOL, goods were packed and made ready for dispatch. Along with being the station with highest cycle time, there were many technical failures of the machine which can be observed from the OEE shown in Figure 4.6. Along with OEE, the downtimes during 17 weeks for EOL are shown in the following Figure 4.7.
Figure 4.6 OEE End of line
The OEE EOL is very similar to OEE robot cell with very similar number of downtimes observed. The average value of OEE is 55.6 % based on data collected during 16 weeks. The downtime data can be seen in the following Figure 4.7.
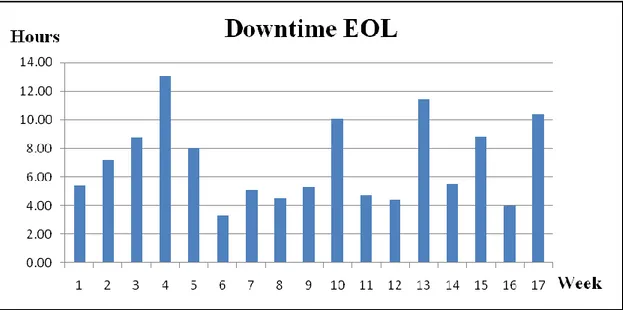
35 Figure 4.7 EOL downtime
As seen from the graph the downtime also varied between 3 to 13 hours and the total time during the 13 weeks comes out to be 90.55 hours while the average downtime per week is 1.4 hours. We took a closer look at the weeks having the highest downtimes (4, 10,13 and 17) to understand the basic reasons for the same. The problems are categorized and displayed in Figure 4.8.
36
4.2 Analysis of System Performance (2:nd Analysis)
In this following chapter, we have analyzed the entire EUCD 1 system as a whole and the analysisfollows the Soft systems methodology (SSM).
4.2.1 Identifying system processes
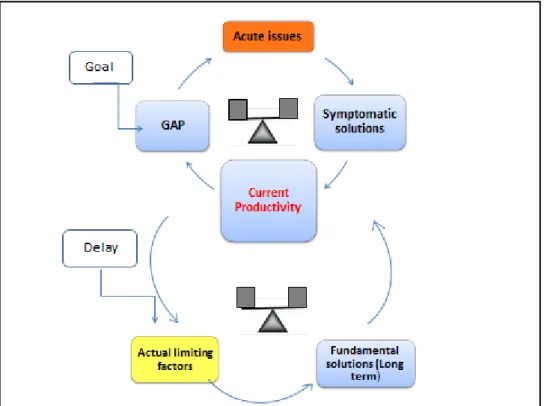
In order to understand the current situation at the company we identified the nature of working and we derivedthe model seen in Figure 4.9. The model is inspired by system thinking processes (Senge, 1999).Systems generally operate by means of 2 processes,regenerative and balancing processes as described in section 2.6. We observed that the EUCD 1 as a system was operating by means of
abalancing process. The parameter which was required to be balanced was productivity. The productivity parameter in this case was defined as the ratio of the number of shiftersmanufactured which passed from EOL to the required target. If there was rework or scrap goods they were not included in the
productivitymeasurement. In this system, a number of external factors influenced the balancing process of maintaining consistent productivity. The nature of working of the system is described in the following Figure 4.9
Figure 4.9 Balancing process of productivity parameter
As seen in the Figure 4.9the productivity at EUCD 1 was of major concern and there was always a perceived gap betweenthe desired goals and actual productivity. The company followed a strategy of resolving everyday production problems e.g. the acute issues at the line such as technical breakdowns, imbalance of line and quality issues with the use of temporary countermeasures. But these were symptomatic solutions whose effects wore away within a short time period and
37 often reappeared in future. Therefore the perceived gap was never diminished. Thus it is required to implement a more proactive approach to address these issues instead of symptomatic solutions. The proactive approach had its
limitations due to certain limiting factors or constraints for e.g. resources, time etc. The proactive approach entailed a deeper understanding of root causes but due to the constraints this never took place making it difficult to implement the
fundamental solutions. Therefore the company found the path of least effort and got caught in a vicious circle of symptomatic solutions. To understand the system better we developed a practical approach described in the following Figure 4.10.
4.2.2 Building a rich picture
After understanding the system processes at the line, we tried to elaborate more on the acute issues and their root causes. For the purpose of deeper understanding of the system, we differentiated the working of the system into current and
required states.
a) Current state
The performance of the line was measured based on measurement of
productionefficiency and was displayed on the activity boards in the form of day-by the hour- production. In our analysis we have calculated this performance efficiency based on weekly intervals and it is shown in Figure 4.10. The data is collected from the shift records provided by the company.
38 As seen from the above graph, the efficiency varies in the range from around lowest of 48% to highest of 93%. The variation was found high in nature and not pertaining to any specific pattern. This figure gives an overall picture but has limited use so as to understand which specific area needs to be improved. It should be further assisted with the help of other performance measurement criteria. In order to fully understand the high variation we analyzed by comparing production efficiency and downtimes of robot cell and EOL. The need of another performance parameter is justified if we observe the figure shown below. The Figure 4.11shows a comparative graph of downtime percentages of Robot cell and EOL with the production efficiency. We chose downtime parameter since it had highest contribution from different factors that constitute OEE i.e. availability, performance efficiency and FTT
Figure 4.11 Comparative graph between Downtime percentages Robot cell & EOL with production efficiency.
For the weeks highlighted as shown in the figure above (week number 1, 2,5,9,13,16 and17) there was a considerable mismatch between production
efficiency and downtime. If we take a closer look at week 5, it seems very strange since the production efficiency is very high as compared to the combined
downtimes. According to our opinion, this was due to the fact that the efficiency can be increased by use of inventory products during the breakdown of robot cell. Buffers were created when there was a breakdown of either EOL or robot cell
39 which led to batch production and therefore efficiency was increased for a certain amount of time. Thus efficiency parameter does not provide a clear picture of the performance of the system. It is therefore required to check the finished and unfinished product inventory levels. For the remaining weeks the production efficiency matched with the downtime percentages as it was considerably low when downtimes were high. As seen above, weeks 1, 5, 9 and 15 suffered from low productivity where the downtime was high followed by a low OEE. During these weeks we observed continualbreakdowns of both robot cell and EOL along with a low number of operators which affected the rate of efficiency. One major issue during these weeks was that it was hard getting technicians when machinery breakdowns occurred, this resulted in standstill and the operators themselves applied the usual countermeasures such as rebooting the system (EOL). Going deeper in the weeks with high productivity with low downtime and high OEE we saw that the common problems occurred toa minor extent. This made it easier to have a continuous flow with a high level of productivity. There was no pattern in the timings for occurrence of the problems at the line but we identified the most frequentlyobserved problems as shown in Figures 4.5 and 4.8. In order for us to fully understand the current state of the system, we developed the following Figure 4.12
40 Figure 4.12 Reality picture of EUCD 1(Current state of the system)
The organization followed a methodology of solving the productivity problems by the means of temporary solutions. Next to the EUCD 1 line, a board of open points was displayed where they solved the everyday production problems on a temporary basis. During the meetings at the board they tried to close acute issues. The solutions proposed were countermeasures for the apparent problem with no focus on the root cause of the problem. Along with this, there was a follow up to check repetition of these points in the future. In order for us to get an in depth picture we began with categorizing the observed issues into 3 main areas of concern which are explained in upcoming sections.
41
4.2.3 Imbalance of line
The imbalance of line was caused by shortage of labor at the assembly line due to absenteeism. When the line operated with limited number of workers the planned “one-piece flow” was disrupted. This resulted in batch production between Body
shell assembly and Electronic station. Further there was an unbalance of workload due
to additional non-value adding activities required to be carried out by operators. Moreover, as stated by operator “Extra work such as getting new batch, updating activity boards etc. is our responsibility but disrupts the production and can also lead to a stoppage of production”. There were some non-value adding activities for e.g. packaging and material handling which were included in the work tasks of the operators. This came out to be in the range of 10-14 minutes in one hour. This time was directly lost from value adding production time. The material was stored in the pallets close to the work station to benefit the assembly process. However the pallets needed to be filled with new material or replaced. The frequency of moving the pallets is described in the following Table 4.2.
Table 4.2 Non-value added work tasks
Sr.
No. Activity (minutes) Time Frequency
1 Fetching trolley for big pallets and
putting them in place 5 Once every 2 hours 2 Getting new pallets (small) for raw
material and putting them in place 4 Once every hour 3 Keeping empty pallets on shelves 4 Once every hour 4 Dispatch of finished shifters 2 Once every hour 5 Discarding unwanted materials (plastics,
cardboard etc.) 2 Once every 2 hours
Besides these, other required non-value added activities included tasks such as updating the activity boards, filling the shift records and general daily maintenance activities. These were however carried out in the last 15 minutes before shift change.
4.2.4 Technical breakdowns
When breakdowns occurred operators carried out the necessary problem solving within their scope. If it cannot be solved, maintenance personnel were called upon. According to the production technician and by our observations “The production is disrupted by continualbreakdowns of the automation and EOL”. We have observed that the technical breakdowns were the major cause for disruption in the production line. Further we observed that the production efficiency doesn’t reflect the reality of the line as seen in Figure 4.112 since the downtimes for EOL and Robot cell wereconsiderable. OEE and downtime data were not being presented visually which made it difficult to geta clear picture of production status. According to the production manager:“The activity board