i
Cultural Influence on Customer Expectation to
Swedish Banking Service
Study of Swedish Banking Industry
Master Thesis: International Marketing
Spring 2009 School of Sustainable
Development of Society and Technology
Chenyun Qiu: 840514 action04@hotmail.com Lu Zhou: 870508
beckham87526@hotmail.com
Supervisor: Tobias Eltebrandt Examinator: Tobias Eltebrand
Abstract: This thesis is a part of a larger collaboration between students during the
spring semester of 2009. The aim was to work together in order to collect more data and allow deeper analysis in the specific area chosen by each student-group. The goal was to come up with advice for banks on how to target immigrants in Sweden. During this process a common theoretical framework was decided on and a questionnaire was developed. The questionnaire was written in English and later translated to several other languages in order to reach some of the target groups that were not fluent in English.
The chosen structure of each paper was to write it more like an article than a “traditional” master thesis.
Date: May 29th, 2009
Program: International Marketing Master’s Program
Authors: Chenyun Qiu,cqu08001@stu.mdh.se
Lu Zhou, lzu08001@stu.mdh.se
Tutor: Tobias Eltebrandt
Title: Cultural Influence on Customer expectation to Swedish Banking Service
Introduction:With the acceleration of globalization in business, understanding and accommodating consumer behaviors in cross-cultural contexts have become musts for the service industry. Customers with different cultural backgrounds may have varied expectations and decision when they are choosing a bank or a financial service. The research is based on a group project contribution. With the help of group members from different countries, lots of information has been collected. This paper mainly focus on the cultural differentiation among Chinese, Thai and Swedish groups as well as the impact on the customer expectations to Swedish banking service.
Problem statement: How important is the customers’ ethnic background, culture and
ii
Purpose: To what extent that Culture elements influence the Chinese, Thai and
Swedish customer’s expectation and opinions about the local banking service?
Method: Both exploratory and descriptive research, second hand information.
Conclusion: According to the data analysis, we should say that there is not strong
influence of culture on Asian customers’ expectation to the Swedish local banking service. However, although belong to the same cultural group, Chinese and Thai have a lots of differences when they come across banking service.
Key words: Culture elements, service quality, customer expectation, level of
Table of Contents
I. INTRODUCTION ... 1
1.1RESEARCH BACKGROUND ... 1
1.2PROBLEM DEFINITION ... 2
1.3PURPOSES AND RESEARCH QUESTIONS ... 2
1.4 DISPOSITION ... 2
Ⅱ Ⅱ Ⅱ Ⅱ. RESEARCH METHODOLOGY ... 4
2.1SELECTION OF THE TOPIC... 4
2.1.1INTEREST AND RELEVANCE ... 4
2.1.2BREADTH OF RESEARCH QUESTION ... 5
2.2THE CHOSEN THEORIES ... 5
2.2.1CULTURE VALUES AND INFLUENCES IN CUSTOMERS’ EVALUATION ... 6
2.2.2SERVICE QUALITY ... 6 2.3RESEARCH METHOD ... 7 2.3.1SAMPLE SIZE ... 7 2.3.2DATA TRANSFER ... 8 2.3.3DATA ANALYSIS ... 8 2.4DELIMITATION ... 9 III. FRAMEWORK ... 10
3.1UNIVERSAL CULTURAL VALUES AND INFLUENCES IN SERVICE EXPECTATIONS ... 10
3.2CULTURE ELEMENTS ... 11
3.3SERVICE QUALITY DIMENSIONS IN BANKING INDUSTRY ... 12
3.3.1THE DEFINITION OF SERVICE QUALITY ... 12
3.3.2THE DIMENSION OF SERVICE QUALITY... 14
IV. FINDINGS & ANALYSIS... 15
4.1CHARACTERISTICS OF THE RESPONDENTS ... 15
4.1.1GENDER ... 15
4.1.2NATIONALITY ... 16
4.1.3AGE GROUP ... 18
4.2FACTOR ANALYSIS ... 21
4.2.1FIVE DIMENSIONS OF SERVICE QUALITY ... 22
4.2.1.1TANGIBLES ... 23
4.2.1.2RELIABILITY ... 24
iv 4.2.1.4ASSURANCE ... 26 4.2.1.5EMPATHY ... 26 4.2.2OTHER FACTORS ... 27 4.2.2.1AGE ... 27 4.2.2.2GENDER ... 28
4.2.2.3HIGHEST EDUCATION LEVEL ... 29
4.3CULTURE IMPACT ... 30
4.3.1NATIONALITY-SATISFACTION ... 30
4.3.2CULTURE INFLUENCE ... 32
4.3.3LANGUAGE INFLUENCE ... 36
4.3.4LEVEL OF INVOLVEMENT IN OWN CULTURAL GROUP ... 39
4.3.5 LEVEL OF ACCULTURATION ... 42
V. CONCLUSIONS ... 44
List of tables
Table 1 : Nationality & Gender Crosstabulation ... 1616
Table 2 : What's your nationality ... 1717
Table 3: Nationality & highest level of education Crosstabulation………..20
Table 4 : Cohen guidelines of Pearson coefficient ... 2323
Table 5 Correlation between tangible and SQ ... 2424
Table 6 Correlation between dependability and SQ ... 2425
Table 7 Correlation between dependability and SQ ... 2525
Table 8 : Correlation between assurance and SQ ... 2626
Table 9 : Correlation between empathy and SQ ... 2727
Table 10 : Correlation between age and general satisfaction level ... 2828
Table 1 : Correlation between gender and general satisfaction level ... . 29
Table 12 : Correlation between highest education level and general satisfaction level………...30
30 Table 13 : Nationality- Level of Satisfaction ... 3131
Table 14 : ANOVA test in culture influence ... 3434
Table 15 : Correlation test in education influence ... 41
Table 16 : Correlations (1) ... 4242
vi List of figures
Figure 1 : Culture Elements (p 83, Cateora, P. and Ghauri, P., 2005) ... 12
Figure 2 : Total perceived quality(p77, Grönroos,2007) ... 13
Figure 3: The pie chart of gender ... 15
Figure 4: Bar chart of age group ... 18
Figure 5: Distribution of highest level of education ... 19
Figure 6: Correlation between service quality and general satisfaction level ... 21
Figure 7: culture and consumer behavior (1) ... 32
Figure 8: culture and consumer behavior (2) ... 33
Figure 9: Means Plots of age group (1) ... 35
Figure 10: Means Plots of age groups (2) ... 35
Figure 11: Means Plots of age groups (3) ... 36
Figure 12: Language influence (1) ... 37
Figure 13: Language influence (2) ... 38
Figure 14: Language influence (3) ... 38
Figure 15: Language influence (4) ... 39
I. Introduction
In the introduction part, the authors present the background information of the
research, the problem statement and purpose, and then specify the target group of this thesis. Lastly, delimitations are discussed.
1.1 Research background
With the acceleration of globalization in business, understanding and accommodating consumer behavior in cross-cultural contexts have become musts for the service industry, not only for companies that have extended or planned to go overseas, but also for any company operating in its homeland facing consumers from different cultures. A consumer’s decision-making process is affected by the prescriptive characteristic of culture, such as class, education, age and psychosocial traits. An employee can speak their own language can make customers very satisfied. For the service provider, it is very important for them to have knowledge of the needs and wants of potential buyers, how they arise, and how and where they are likely to be satisfied. These can all be dedicated by culture.
As Chinese students, we notice that there are more and more Chinese come to study or work and live in Sweden. Until the year of 2006, there are more 30000 Chinese residences in Sweden1. Among them, 6966 persons are residence of family ties2, 690 are from labor market 3and 7118 are students4. Dealing with all kinds of financial problems is quite common and necessary for them. To understand the differences in values across cultures, will be of immense importance as financial service providers develop and promote service offerings.
2 1.2 Problem definition
This chapter will mainly compare the differentiations among Chinese, Thai and Swedish customers expectations when interacting with local financial service providers. Utilizing the cultural values identified by Hofstede (1991), the
demographic analysis, culture elements and service quality theories to develop both questionnaire and interview conducted in Chinese, Thai as well as the local Swedish market in Sweden and generate propositions regarding the influence of consumers’ cultural backgrounds on consumer expectations. The authors aim to give an evaluation of the total influence of culture elements to the banking service and also find out specific factors which matters most. Managerial implications, limitations, and future research directions are also presented.
1.3 Purposes and Research Questions
The purpose of this paper aims to investigate the Chinese and Thai cultural factors in order to examine the differences of Asian consumer behavior of financial service against the Swedish background. The following research question is formulated: To what extent that Culture elements influence that Chinese, Thai and Swedish customer’s expectation and opinions about the local banking service?
1.4 Disposition
This chapter can be divided into 6 parts. First we will start with the introduction part which is the general statement about the purpose of this research and the questions the authors need to figure out.
The following section methodology part will introduce the method adopted to obtain the sample, data and measurement. Questionnaire will be the most important tools to
collect the primary data and the database of the library of Mälardalen University will be one of the important channels to gain the secondary data.
Then the authors will build the framework followed by the key words: culture, consumer behavior knowledge, and also the quality of service.
Section four explains the analysis of the data with the help of SPSS software. The authors would like to figure out: to what extent, culture can affect different cultural background customers’ consumer behavior when they choose a Swedish financial service provider? And among all of the factors which of them are the most important ones? The analysis is most based on the results of the survey. Since authors do not know how much culture factors will influent customers’ decisions or whether there is any significant different between these three culture groups, they design the analysis into several steps and each step is based on the results from last one. The paper is mainly focus on the facts turned out from the questionnaire and the objective of authors is to find out more details of cultural impacts and culture differentiation on banking service.
The final section, a conclusion of the study results will be presented as well as some suggestions for the Swedish bank manager.
4 Ⅱ
Ⅱ Ⅱ
Ⅱ. Research methodology
In this section the methodology of this research will be presented. After reading this section the reader will have an understanding of the come up of this topic, the theories and research method form the basement of this report as well as its limitations.
2.1 Selection of the topic
In this section, the reason of why choose this topic and what the purpose of this research will be generally introduced.
2.1.1 Interest and relevance
The topic area of our master thesis work should be the one that we placed our interest upon and related to our knowledge background. As both Chinese students, we
remembered at the first few days coming in Sweden, we all came across the bankcard and money transfer problems. A couple of weeks after, during a service quality class discussion, it was quite interesting that many Chinese students gave a positive evaluation to a employee who can speak a little Chinese in Swedbank in their paper. This indicates cultural issues in the financial service which may not be noticed much before. Since people with different culture background they may preserve a quite different opinion about the service quality of Swedish financial service providers. This is the primary impulse we came up this topic.
2.1.2 Breadth of research question
The research questions of this paper are the followings: how the Chinese, Thai and Swedish customers evaluate the service quality of Swedish financial service providers? What other factors can affect their opinion? Does culture really matter? After our analysis, we can draw the following conclusions:
In the beginning we only want to focus on the Chinese people who living, working or studying in Sweden. In addition, there are more and more Chinese background people came to Sweden which might be a good opportunity to financial service providers. However, after we start to gather the data, we found out that there are also a lot of Thai people in Sweden. This also could be our relevant target group. Because both Thai and China are Asian country, they belong to the same culture circle; a lot of people may hold the similar opinion against the Swedish financial service. Then we decide to include Thai people in our analysis. Moreover, we can get a large sample size, increase the validity and representative of our work. In addition, Swedish respondents are also in our analysis so that we can compare the Chinese, Thai ‘s opinion with the Swedish.
After all of these thinking, we determined the topic of this work. We would like to know how the Chinese, Thai and Swedish customers evaluate the service quality of Swedish financial service providers. To figure out do they have any differences, how big of these differences?
2.2 The chosen theories
In this work, the mainly theories we chose are culture elements and their effect on customer’s evaluation towards Swedish financial service providers as well as service quality.
6
2.2.1 Culture values and influences in customers’ evaluation
To understand how consumers behave across cultures, five universal values across cultures have been delineated (Hofstede, 1991). These universal values are well documented, as they are based on a study of 72,215 employees working in 66 different national subsidiaries of the IBM Corporation. The universal values, which collectively distinguish members of different cultures, include power distance, uncertainly avoidance, individualism-collectivism, masculinity-femininity, and Confucian dynamic or long-term orientation. Values of Hofstede’s cultural dimensions on China and Sweden provide a standard study system to the cultural knowledge and information we collected and give a judgment to the degree of success or failure of the providing financial service when interact with culture elements5.
The model of Elements of culture provides a factual knowledge when we made our questionnaire. In the end of analysis, we are expecting a ranking list of these elements working on the financial service.
2.2.2 Service quality
Since our work is to get a general idea about how the customers with Chinese, Thai and Swedish backgrounds evaluate the service of Swedish financial service providers. Therefore, at the beginning of this work, we need to make sure how important the service quality attributes to the totally service satisfied level. A lot of work has been done in this area before, like Parasuraman, Zeithaml and Berry (1985) and Bitner, Booms and Mohr (1994). Both of their work, they gave us a generally definition of service quality and the important of it. In our work, we will choose Grönroos’ idea about service quality.
In order to understand the customer better, the service providers must know the principles which customers measure the quality of their services. Which aspect of their service the customers pay more attention to and which aspect they do not care
too much. Then the marketers know exactly how to improve their service thus attract more and more customers. In our work, we will mainly adopt the five dimensions of service quality this measure system to answer this question. We will adopted Looy’s (2003) work, he based on the following five dimensions to assess the service quality of financial service providers which are tangibles, reliability, responsiveness,
assurance and empathy.
2.3 Research method
In our research we use both primary data and secondary data. The primary data for this work was collected by the authors using a questionnaire which can be found in the appendix. The Secondary data that have been used in this thesis is mainly acquired through the databases of Mälardalen University, especially the ABI/Inform and ELin.
2.3.1 Sample size
When conducting research the size of the sample has to be identified. The sample size depends on which margin of error, which is a measurement of uncertainty, is
acceptable for the particular project. (Fisher, C., 2007, p. 189) According to Riffe (2005), we also know the importance of having a large sample size in order to be as correct as possible and thus, get a result as close to the real population as possible. However, considering the limitations of time and relevant materials, we adopted a survey lasted two weeks and received 816 answers. Since some of them are irrelevant with our research questions, we just utilize 414 samples with Chinese, Thai and Swedish culture background and who at least deal with one Swedish financial service provider.
8 2.3.2 Data transfer
After collect ion of all the data, we transferred them into a standardized SPSS data sheet. The sheet works as a tool to transform the information and to make it accessible for SPSS to analysis them. The sheet contains two sections: data view and variable view. First, we need to describe our variables in the second sheet. It consists of a number of dimensions: name, type, width, decimals, label, values, missing, columns, align and measure.
For example the variable: “the generally opinion of Swedish financial service provider” we will usually measure it in a five point scale ranged from 1 strongly disagree to 5 strongly agree. In this way the SPSS software can recognize them, then analysis them.
In our sample, we defined variables nationality, gender and different ways to get information from your bank as nominal variables. Their representative number are only for identification and can’t be ranked from smallest to largest. The age, living time in Sweden and some other variables belong to scale variables. The value of these variables can be easily distinguished. The others are ordinal variables, including what kind of services you are currently using in your bank and which factors you consider as important when you choose your bank. Their number just means some kind of ordinal relationship.
2.3.3 Data analysis
After gathering the data, the computer based statistics program SPSS 16.0 for windows was used to analyze the data. Correlations and ANOVE test are applied to study our research questions.
Correlations are used to determine if there is a relationship between two variables. It shows the strength and direction of the relationship. Pearson’s Correlation Coefficient
has to be between -1 and +1. (Norusis, M., 2003, pp197-216). In our work, we will adopted the correlations test to analysis the relationship between the service quality and service, also the attribution of each the five dimensions to service quality ANOVE test is mainly use to compare three or more than three variables.
2.4 Delimitation
We have to admit that this research have its own limitations as everyone. Firstly, due to the time limitation and limited capabilities to analyze every aspect of the problem, we focus on the culture aspects even we know that there are many factors affect customer’s opinion. And also, we believe that the culture aspect is one of the most important issues when service provider deal with the customers from different culture background. For the same reason, when we deal with the measurement of the quality of financial service, which specified to the five dimensions. However, there are a lot of questions can be found in our questionnaire regarding to these dimensions, we only adopted one of them for each dimension. Although the choice of our questionnaire is based on the collected information of the former interview, there still may miss some elements. However, with the secondary data’s help, hopefully we covered the most important and major problems in the case.
Another crucial aspect which had to be considered when writing this thesis was that the size of the data is kind of small and most of our respondents are students whom may not be the original targeted group of the financial service providers. This might affect the representative and the validity of our work. Besides, we want to clarify that we were not writing this thesis in order to prove that which financial service is good or which one is not. We were writing this thesis to gain some actual facts about the level of culture impact on customers’ expectations to banking service and find out the differentiation among the target groups.
10 III. Framework
In this chapter, some supporting theories are introduced. Since the research is more based on the actual data collected from the survey, the theories are used as a guide as well as a hypothesis to test during the analysis section.
3.1 Universal Cultural Values and Influences in Service Expectations
According to Hofstede, culture is always a collective phenomenon, because it is at least partially shared with people who live or lived within the same environment, which is where members of one group or category of people from another. (Ghauri & Cateora, 2006)
From the initial results, and later additions, Hofstede developed a model that identifies four primary Dimensions to assist in differentiating cultures: Power Distance - PDI, Individualism - IDV, Masculinity - MAS, and Uncertainty Avoidance - UAI. Geert Hofstede added a fifth Dimension after conducting an additional international study with a survey instrument developed with Chinese employees and managers.
* Power distance involves the way the less powerful members of institutions and organizations within a country expect and accept that power is distributed unequally. Part of power distance involves human inequality in areas such as prestige, wealth, power, and law. People from cultures high in power distance are comfortable with power hierarchy, discrimination, and tolerance of inequalities.
* Uncertainty avoidance is the extent to which the members of a culture feel threatened by uncertain or unknown situations. With high uncertainly avoidance, people like clear rules and explicit situations; with low uncertainly avoidance, people can accept uncertainly without discomfort and tolerate inexplicit rules.
* Individualism exists in societies in which the ties between individuals are loose: everyone is expected to look after himself or herself and his or her immediate family. Collectivism, the opposite, exists in societies in which people from birth onwards are integrated into strong, cohesive in-groups that offer lifetime protection in exchange for loyally. This subdimension can be summed up in three words: "I versus we."
* Masculinity and femininity are the dominant sex role patterns in the vast majority of both traditional and modern societies. Masculine societies value assertiveness,
performance, ambition, and independence, whereas feminine societies value nurturing, quality of life, service, and interdependence.
* The Confucian dynamic or long-term versus short-term orientation dimension refers to the way people look at the future. Long-term orientation emphasizes perseverance, ordering relationships by status, thrift, and a sense of shame. On the other hand, short-term orientation focuses on personal steadiness and stability, saving face, respect for tradition, and reciprocation of greetings, favors, and gifts.
These cultural values present considerable influence on consumers' formation of expectations about service encounters, as well as on service providers' assumptions of what consumers prefer.
3.2 Culture elements
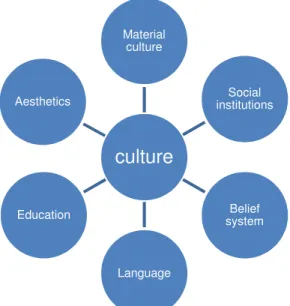
Culture includes every part of life. The scope of the term culture to the anthropologist is illustrated by the elements following:
12
Figure 1 : Culture Elements (p 83, Cateora, P. and Ghauri, P., 2005) This model is used to make a complete questionnaire to ensure that each fact of a culture is included. Also, this provides a total picture to understand the culture synergistic effects.
With the collected data from survey, the related culture elements will be analyzed and be compared to examine the different level of culture influence on customer
expectation.
3.3 Service quality dimensions in banking industry
3.3.1 The definition of service quality
There are many researchers who have defined service quality in different ways. For examples, Bitner, Booms and Mohr (1994, p. 97) define service quality as ‘the consumer’s overall impression of the relative inferiority / superiority of the
organisation and its services’. While other researchers (e.g. Cronin and Taylor, 1994; Taylor and Cronin, 1994) view service quality as a form of attitude representing a long-run overall evaluation, Parasuraman, Zeithaml and Berry (1985, p. 48) defined service quality as ‘a function of the differences between expectation and performance
culture
Material culture Social institutions Belief system Language Education Aestheticsalong the quality dimensions’.
In our report, we will adopted Grönroos’ definition about the service
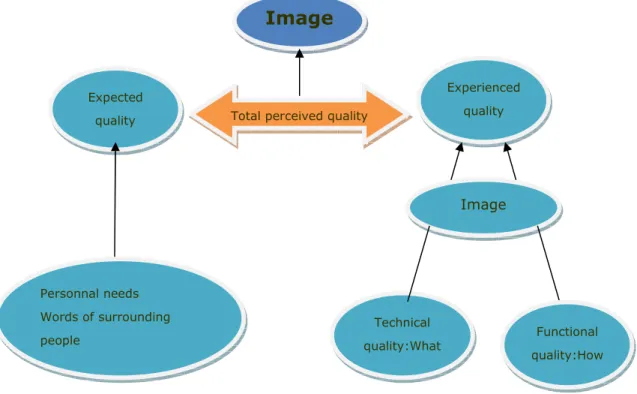
quality.According to Grönroos (p.75-77, 2007), the total perceived quality of service, which measures how well experiences of the service process and its outcome meet expectations, is determined by the gap between the customer’s expected and they actually experienced. Just as the following figure shows:
Figure 2 : Total perceived quality (p77, Grönroos,2007)
The expected quality influenced by a number of factors. Some are directly under the control of the firm such as marketing communication, promotion campaigns. Some are indirectly controlled by the firm including the image of the company, word of month, customer’s needs and values. The experienced quality is what the customer receives and how the customer receives it during the service process combine with the company’s image. Image Expected quality Experienced quality Total perceived quality
Personnal needs Words of surrounding people Image Technical quality:What Functional quality:How
14 3.3.2 The dimension of service quality
In service context, quality may be the foundation of the competitive edge, but which quality dimension (what or how) is the vital part of excellent total quality? If this question is not answered correctly, the wrong actions may be taken, and the company would lose its chance to achieve a stronger competitive position. Therefore, here we need to find a good and effective way to measurement the service quality.
This paper will base on Looy’s idea of the five dimensions of service quality.
According to Looy et al (2003:132-134) customers are not one-dimensional in judgment, because a lot of other factors influence service quality, generally we can summarised these factors into five aspects as following:
*Tangible is the material that used to give tangibility to service. *Reliability provided services dependably and accurately.
*Responsiveness this is the willingness of the service supplier to assist the customer and provide prompt service.
*Assurance is the knowledge-ability of service providers, their ability to arouse trust and confidence among customers.
*Empathy the employees care about the customers and give them individualized attention.
IV. Findings & Analysis
The research results and data analysis is introduced together in this chapter since it can be more understandable for the readers to look at the figures and the analysis at the same time.
4.1 Characteristics of the respondents
In the following part, the characteristics of the respondents will be illustrated.
4.1.1 Gender
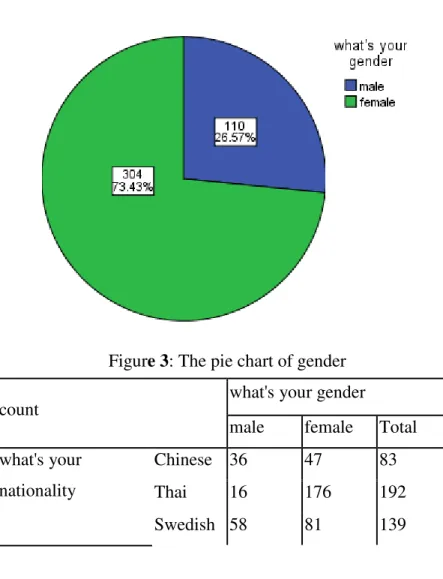
Figure 3: The pie chart of gender count
what's your gender male female Total what's your
nationality
Chinese 36 47 83
Thai 16 176 192
16
count what's your gender
Total 110 304 414
Table 2 : Nationality & Gender Crosstabulation Nationality & Gender Crosstabulation
From figure 1, we find out that most of our respondents are female, almost take up 3/4 area of the whole pie. The other quarter represent males. The table 1 gives us more details about the exactly cases of different gender in Chinese, Thai and Swedish. From this crosstabulation table, we can see clearly that the total size of Chinese
respondents is 83, which 36 of them are male, 47 are female. This size is kind of small thus is one of our big delimitations we talked about above. The Thai respondents, 176 of 192 the total case are female, the male answers just 16. This also could be one of the factors affect the validity and representative of our work, because nearly 92% of this nationality group are female. Thai respondent group is also the most unevenly distribute group between different genders. About the Swedish respondents, 58 are male, 81 are female, the total size is 139.
From the table 1, we also know that every group the female respondents are larger than the male group, this would be one interesting part. Therefore, in our analysis part, we would like to see the relationship between the different gender and the evaluation level. How much the gender factor matters to the attitude of customer’s opinion about financial service quality.
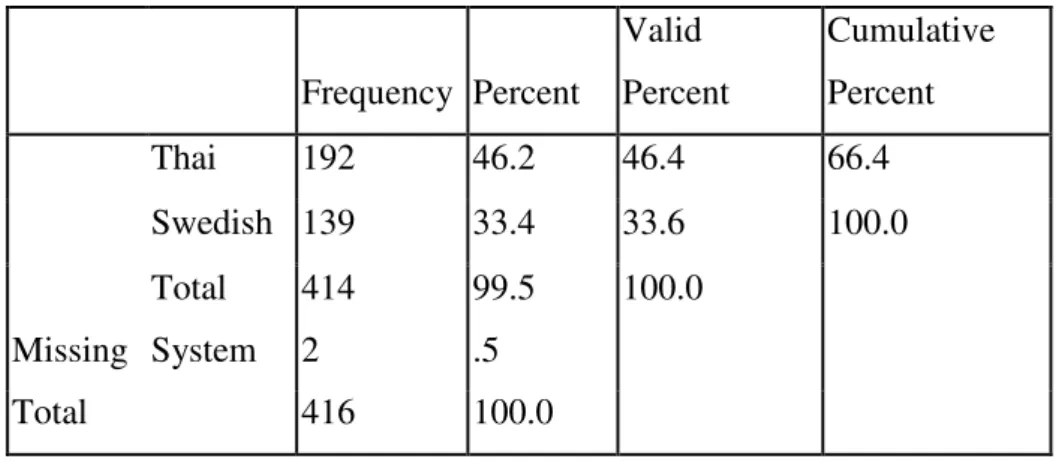
4.1.2 Nationality Frequency Percent Valid Percent Cumulative Percent Valid Chinese 83 20.0 20.0 20.0
Frequency Percent Valid Percent Cumulative Percent Thai 192 46.2 46.4 66.4 Swedish 139 33.4 33.6 100.0 Total 414 99.5 100.0 Missing System 2 .5 Total 416 100.0
Table 3 : What's your nationality
The table 2 displays the nationality of our respondents. It shows that there are 414 valid answers, most of them are from Thailand (46.2%) followed by Sweden (33.4%) and with 83 persons China represent the last 20 %.
Moreover, we know that all of the Chinese respondents are valid, however, the Swedish and Thai groups, all of them missing 0.2% valid percent. From the
cumulative percent, the numbers shows that the Chinese and Thai together out weight 66.4%, which is our target group, we defined these two groups together as Asian customers, since both of them the total size are small, it is better to combine them together for the research.
18 4.1.3 Age group
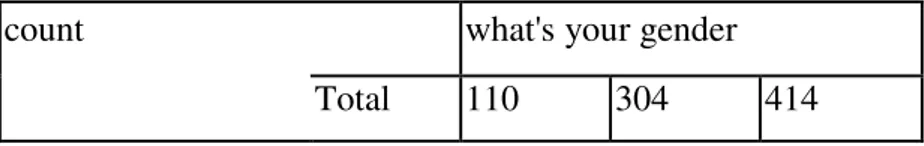
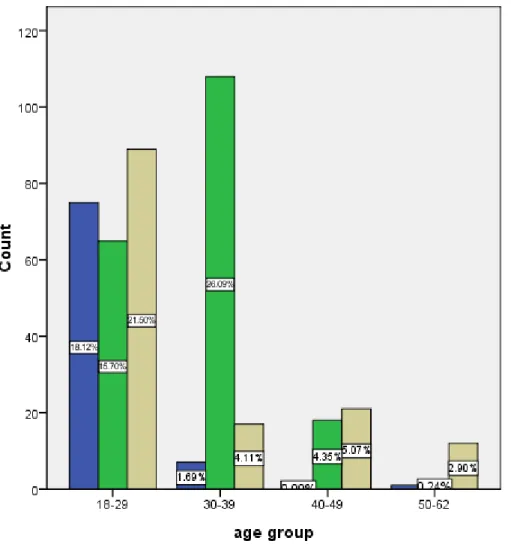
Figure 4: Bar chart of age group
This figure shows the different age groups of our participants. From the figure 2 the bar chart, we can see that for the Thai respondents, 26.09 of them are located in the 30-39 this age group, then 15.0% in the 18-29 this age group and 4.35% of them between 40-49, only one Thai answer between 50-62.
About Chinese responses, the largest age group is 18-29, which is 18.12% of all of the Chinese respondents. Then following 1.69% 30-39 this age group, no respondents positioned in 40-49 this age group and only one in the 50-62 group. The distribution of Chinese respondents looks like this could be the reason we mentioned before, since
that most of our data collected from the students studied here, we can’t find an effective way to contact the other social Chinese group in Sweden within the time permit.
However, when we collect the data from Swedish respondents, we can easy found answers of each age group. In this case, our Swedish repliers, 21.50% of them in 18-29 this age group, 4.11% in 30-39 age group, 5.07% belongs to 40-49 this one and 2.90% located in 50-62 this group.
From this figure we also can see that: in the case were people belong to the age group of 18-29, there is the nationality most evenly distributed amongst the percipients. Therefore, for our following analysis, if we want to compare some certain age group, this group could be a good choice.
20
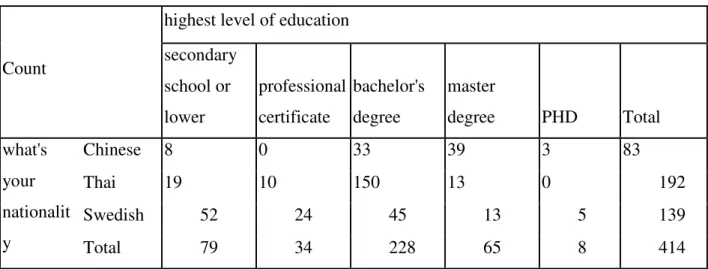
Figure 5: Distribution of highest level of education
Count
highest level of education secondary school or lower professional certificate bachelor's degree master degree PHD Total what's your nationalit y Chinese 8 0 33 39 3 83 Thai 19 10 150 13 0 192 Swedish 52 24 45 13 5 139 Total 79 34 228 65 8 414
Table 4 : Nationality & highest level of education Crosstabulation The figure below illustrates the educational distribution according to different nationality. It shows that: for Swedish respondents, most of their education level is secondary school or lower, the second popular diploma is bachelor’s degree then the professional certificate, only few of them less than 5 are PHD. The significant
differences between education background are shown in Thai respondents, almost 150 (78%) of them have bachelor’s degree but nobody is PHD. Most of Chinese answers distribute between bachelor’s degree and master degree.
Besides, we can get more details from the following table 3. The bachelor and master degrees of Chinese respondents are 41, almost half of the total size. And 150 of 192 Thai answers have bachelor degree, but none of them are PHD. For Swedish repliers, the repliers hold professional certificates are the largest among these three
nationalities, this might because in Sweden people pay more attention to practice ability not just the education background compare to some Asian country.
We found that in our case, the difference of education background also significant, especially among Thai answers, thus we would like to study whether this dimensions is important or not contribute to the total evaluation of customers’ attitude towards the Swedish financial service providers. And if yes, how much.
4.2 Factor analysis
In this part we will try to find out the factors contribute to Chinese, Thai and Swedish customers’ evaluation of Swedish financial service providers. We will focus on the five dimensions of service quality: tangibles, reliability, responsiveness, assurance and empathy. In other word, we want to know that whether the service quality is an important factor for Swedish financial service provider. If yes, then among its five dimensions which one of them the customers valued the most important and which one valued less important. In order to answer these questions, question 13 and 25 of the questionnaire will be adopted.
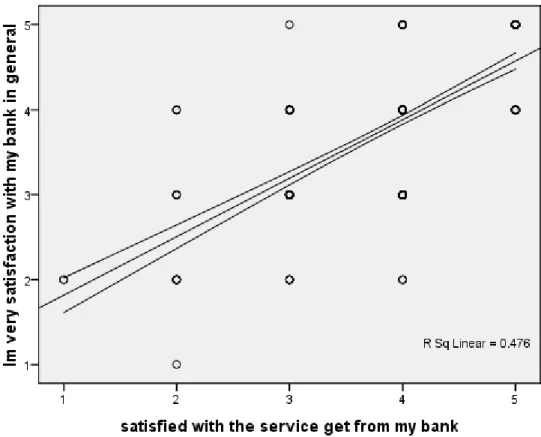
First of all, we need to make a correlation test to see that whether service quality is important for Swedish financial service providers. The subsequent figure will give us the answer.
22
We get this figure from SPSS. First, we make a correlation analysis between total satisfied level of the Swedish bank service and the satisfaction level about service quality. Then we get a figure without the representive linear of figure 4. The thickness of the dots represent how many respondents fall in the same category. After that, the SPSS software have one fiction is choose the most suitable linear, after a few test, we get this most suitable linear. We can see that representive level of this line is 47.6%, it means the quality of the banks’ service is very important for them to get a high
evaluation from their customers. Therefore, we can do the following analysis.
4.2.1 Five dimensions of service quality
In our questionnaire, they have a lot of question regarding to this dimension of service quality which you can find in question 12. As we mentioned before, in our work we just choose one question for each dimension to do our research, there have some reasons. First, because of the time and work distribution limited, we can’t analysis to analysis all of the questions; second, after some validity tests, we found that for some question, the validity level is not very high, it could be the respondents misunderstand the questions, or the missing system. Therefore, based on the validity test result, in order to increase the validity level of our research, we choose the following questions to make our analysis.
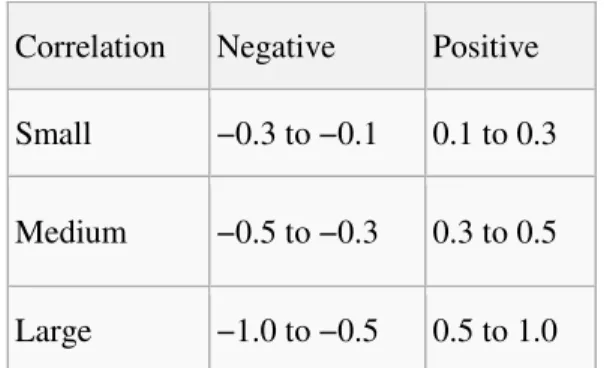
According to Cohen (1988), he offered guidelines for the interpretation of Pearson coefficient.
Table 5 : Cohen guidelines of Pearson coefficient
However, this criteria should not be observed too strictly because the interpretation of a correlation coefficient depends on the context and purposes as well as the size of the sample. In some situation a correlation of 0.9 may be very low but in other situation may be regarded as very high.
4.2.1.1 Tangibles
Tangible is the material that used to give tangibility to service. For this dimension we will use the ordinal variable named material which means how well do you think the visually appealing material associated with the service of the bank you are mainly using.
visually appealing material with service
satisfied with the service get from my bank
visually appealing material with service
Pearson Correlation
1.000 .198**
Sig. (2-tailed) .000
N 412.000 412
satisfied with the service get from my bank
Pearson Correlation
.198** 1.000 Sig. (2-tailed) .000
N 412 414.000
**. Correlation is significant at the 0.01 level (2-tailed).
Small −0.3 to −0.1 0.1 to 0.3
Medium −0.5 to −0.3 0.3 to 0.5
24
Table 6: Correlation between tangible and SQ
The Pearson Correlation coefficient of this relationship is 0.198. According to
Cohen’s explanation the two variables have a weak positive correlation between each other under the level of 0.01.
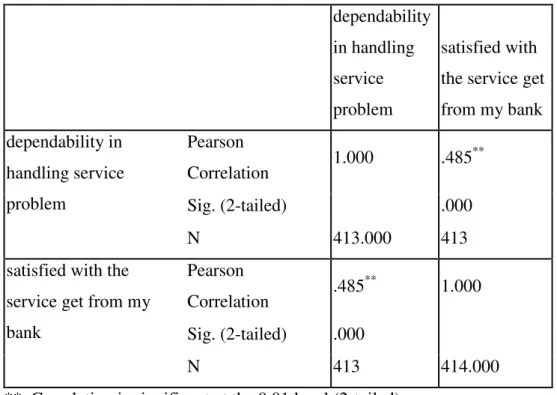
4.2.1.2 Reliability
Reliability provided services dependably and accurately. Here we will use
dependability this variable to figure out its contribution to general service quality.
dependability in handling service problem
satisfied with the service get from my bank dependability in handling service problem Pearson Correlation 1.000 .485 ** Sig. (2-tailed) .000 N 413.000 413
satisfied with the service get from my bank Pearson Correlation .485 ** 1.000 Sig. (2-tailed) .000 N 413 414.000
**. Correlation is significant at the 0.01 level (2-tailed).
Table 7: Correlation between dependability and SQ
The Pearson Correlation coefficient for this relationship is 0.485. This number shows that these two variables have strongly positive connection. Even the coefficient is 0.485, which smaller than Cohen’s 0.5, but considering that the total sample size of
our work is just 413 which quite small, therefore, here we can say that the relationship between these two variables are strong.
4.2.1.3 Responsiveness
Responsiveness this is the willingness of the service supplier to assist the customer and provide prompt service. In order to analysis this dimension, the ordinal variable willingness will be used.
willingness to help
customers
satisfied with the service get from my bank willingness to help customers Pearson Correlation 1.000 .440 ** Sig. (2-tailed) .000 N 413.000 413
satisfied with the service get from my bank Pearson Correlation .440 ** 1.000 Sig. (2-tailed) .000 N 413 414.000
**. Correlation is significant at the 0.01 level (2-tailed).
Table 8: Correlation between dependability and SQ
For this relationship, the Pearson Correlation coefficient is 0.440. As the same reason we stated above, because of the sample size, here we can say that this number also quite high in our case, which means that the bond between these two variables are very strongly.
26 4.2.1.4 Assurance
Assurance is the knowledge-ability of service providers, their ability to arouse trust and confidence among customers. Here we choose the ordinal variable safety to study the importance of this dimension for service quality.
making customers feel safe
satisfied with the service get from my bank making customers feel
safe Pearson Correlation 1.000 .404 ** Sig. (2-tailed) .000 N 414.000 414
satisfied with the service get from my bank Pearson Correlation .404 ** 1.000 Sig. (2-tailed) .000 N 414 414.000
**. Correlation is significant at the 0.01 level (2-tailed).
Table 9 : Correlation between assurance and SQ
The Pearson coefficient of this correlation is 0.404 nearly belongs to the medium level. It demonstrates that the assurance this dimension is medium important for the general service quality.
4.2.1.5 Empathy
Empathy the employees care about the customers and give them individualized attention. Here the ordinal variable named attention will be adopted to investigation the link between this dimension and service quality.
individual attention to customers
satisfied with the service get from my bank individual attention to customers Pearson Correlation 1.000 .342 ** Sig. (2-tailed) .000 N 414.000 414
satisfied with the service get from my bank Pearson Correlation .342 ** 1.000 Sig. (2-tailed) .000 N 414 414.000
**. Correlation is significant at the 0.01 level (2-tailed).
Table 10 : Correlation between empathy and SQ
From this table we see that the Pearson correlation coefficient is 0.342. According to Cohen’s guidelines is also belongs to the medium connect level, thus for this
relationship we also can say that these two variables are medium positive connect to each other.
4.2.2 Other factors
Of course, they are lots of factors affect customer’s opinion besides the quality. We will also test age, gender and highest education level these variables to examination whether they have relationship with general valuation of Swedish financial service providers. The question 2 , question 4 and question 8 will be utilized.
28
When were you born
satisfied with the service get from my bank When were you born Pearson
Correlation 1.000 .082
Sig. (2-tailed) .094
N 414.000 414
satisfied with the service get from my bank
Pearson
Correlation .082 1.000
Sig. (2-tailed) .094
N 414 414.000
Table 11 : Correlation between age and general satisfaction level
As we mentioned in the Characteristics of the respondents part, since the distribute of the age group have significant different, we would like to see whether this factor is important or not for customers’ evaluation about Swedish financial service providers. This analysis also can cover one delimitation of our work. Because most of Chinese respondents are students located in the 18-29 this age group, before we start our analysis, we are a little worried about that this may be affect the validity and representative of our work.
Here the Pearson correlation coefficient is 0.082. It shows these two variables have not very much strong positive connection. Which means the age is not that important for our analysis. Thus, it doesn’t matter that much as we think.
4.2.2.2 Gender
what's your gender
satisfied with the service get from my bank
what's your gender
satisfied with the service get from my bank what's your gender Pearson
Correlation 1.000 .092
Sig. (2-tailed) .063
N 414.000 414
satisfied with the service get from my bank
Pearson
Correlation .092 1.000
Sig. (2-tailed) .063
N 414 414.000
Table 12 : Correlation between gender and general satisfaction level
As the same reason mentioned before, most of our samples are female and also test further of the validity and representative of our analysis, therefore we want to analysis the gender this factor. The Pearson Correlation coefficient of here is 0.092, the link between these two also quite weak.
4.2.2.3 Highest education level
highest level of education
satisfied with the service get from my bank highest level of education Pearson Correlation 1.000 -.106 * Sig. (2-tailed) .032 N 414.000 414
30
highest level of education
satisfied with the service get from my bank satisfied with the
service get from my bank Pearson Correlation -.106 * 1.000 Sig. (2-tailed) .032 N 414 414.000
*. Correlation is significant at the 0.05 level (2-tailed).
Table 13 : Correlation between highest education level and general satisfaction level
This is very interesting. The Pearson Correlation coefficient of this relationship is -0.106, the relationship between these two variables is negative. This means that the opinion about Swedish financial service provider is low from customers with high education level, although this kind of bond is not very strong.
4.3 Culture Impact
This section, varied of cultural and demographic elements are tested about the influence on customer expectation to banking service.
4.3.1 Nationality-Satisfaction
Since we have already known that the respondents of banking service occupied an important part of the total evaluation of bank, we would like to compare some frequencies of the level satisfaction to service among these three countries first. In order to answer this, Frequency tests are introduced. The relevant question is Question 25.2.
I’m very satisfied with bank and the service
what's your nationality Frequency Percent Valid Percent
Cumulative Percent
Chinese Valid strongly disagree 1 1.2 1.2 1.2 disagree 6 7.2 7.2 8.4 neutral 31 37.3 37.3 45.8 agree 40 48.2 48.2 94.0 strongly agree 5 6.0 6.0 100.0 Total 83 100.0 100.0
Thai Valid neutral 51 26.6 26.6 26.6
agree 135 70.3 70.3 96.9
strongly agree 6 3.1 3.1 100.0
Total 192 100.0 100.0
Swedish Valid disagree 13 9.4 9.4 9.4
neutral 27 19.4 19.4 28.8
agree 54 38.8 38.8 67.6
strongly agree 45 32.4 32.4 100.0
Total 139 100.0 100.0
Table 14 : Nationality- Level of Satisfaction
In the table, we can see more clearly about the number of cases and percentage of each answer from Chinese, Thai and Swedish. The result shows that there are 48.2% of Chinese, 70.3% of Thai and 38.8% of Swedish agree they are satisfied with the service and they all occupied the highest rate of the each cultural group. However, we can still see some differences. Thai people seems to be more satisfied with local banking service with no rate of disagree and highest rate of agree, 70.3% far higher than the Chinese and Swedish. Although most of the answers from Chinese are between neutral and agree, there are also 8.4 percentage goes to low level of
satisfaction. When we compare with the higher level of satisfaction which means the percentage of agree and strongly agree scale, Chinese are the lowest with 54.2% while Swedish and Thai are 71.2 % and 73.4. The total evaluation of the service satisfaction of Chinese is lower than the two countries’.
32 4.3.2 Culture influence
To understand further about the culture influence in customer behaviour and expectations, Question 25.5 is chosen for analysis.
From the charts below, we can see a significant difference between Asian group and European group. Culture factors are more valued by Chinese and Thai while is less important for Swedish when they are dealing with bank service. In addition, it shows that there are more Thai people than Chinese are attracted by culture factors in banking service.
Figure 8: culture and consumer behaviour (2) One-way ANOVA test
To compare the difference of relationship between culture groups and culture influence to them, ANOVA test was performed.
However, since the data of Thai is not stable enough, the sig is less than 0.05 level. We can only compare the answers of Chinese and Swedish.
The sig. of Chinese from the first is 0.449>0.05 and Swedish 0.255>0.05, so we check the figure of the ANOVA table which shows 0.145>0.05, 0.755>0.05. This indicates that there is no significant difference from one another.
34
would you change your bank if other bank interest in your culture what's your nationality Levene Statistic df1 df2 Sig. chinese .893 3 79 .449 Thai 8.768 3 188 .000 Swedish 1.449 4 80 .225 ANOVA
would you change your bank if other bank interest in your culture
what's your nationality
Sum of
Squares df Mean Square F Sig.
chinese Between Groups 6.412 3 2.137 1.848 .145
Within Groups 91.395 79 1.157
Total 97.807 82
Thai Between Groups 1.734 3 .578 1.569 .198
Within Groups 69.266 188 .368 Total 71.000 191 Swed ish Between Groups 2.913 4 .728 .473 .755 Within Groups 123.134 80 1.539 Total 126.047 84
Table 15 : ANOVA test in culture influence ANOVA test in culture influence
Since we do not find much significant difference between these three groups, we would like to look forward some details.
Figure 9: Means Plots of age group (1)
36
Figure 11: Means Plots of age groups (3)
According to the plots above, young people aged 20-29 from Chinese and Thai groups shows similar attention to culture factors provided by bank. However, when it goes to senior generation, Chinese’s interests drop down while Thai increases. When we compared the same young people group with Swedish, they turn out to be less interest with very low mean of 2.
4.3.3 Language influence
To test language influence of language on banking service, Questions 25.3.4 are used.
The following figure shows the percentage of interests to language service provided from bank of Chinese and Thai
There are around 80.72% of Chinese show interest in language information service, and 73.49% of Chinese would like to talk to employees who can speak Chinese.
Most of answers from Thai are focus on neutral. It seems language elements are not so attractive to Thai people. However, they also have much smaller cases of disagree than Chinese.
38
Figure 13: Language influence (2)
Figure 15: Language influence (4)
4.3.4 Level of involvement in own cultural group
In order to test the relationship between cultural involvements and banking service expectation, we use Question 24 and Question 25.5 for analysis.
From figure 16, the result indicates most of Asian people identified themselves with stronger cultural involvement than Swedish. However, this does not mean they will give more credits to banking service on cultural elements. Take Chinese for example; people are not interested in the cultural factors in banking shows the same degree of cultural involvement with those strongly attracts by the culture. There is no direct relationship with these two elements here.
40
Figure 16: level of involvement
In order to find out more potential relationship, we would like to look at specific cultural elements. The following correlation test is
introduced to test the education and language influence.
Correlations ( education) Nationality highest level of education would you change your bank if other banks show interest in your culture Chinese highest level of
education
Pearson Correlation
Table 16 : Correlation test in education influence
For Chinese and Swedish, the results show that the higher level of education is, people are less interest in the cultural factors in banking service and the this element does not have much influence on Thai people.
Sig. (2-tailed) .966
N 83 83
would you will change your bank if other bank interest in your culture
Pearson Correlation
-.005 1
Sig. (2-tailed) .966
N 83 83
Thai highest level of education Pearson Correlation 1 .014 Sig. (2-tailed) .849 N 192 192
would you will change your bank if other bank interest in your culture
Pearson Correlation
.014 1
Sig. (2-tailed) .849
N 192 192
Swedish highest level of education Pearson Correlation 1 -.080 Sig. (2-tailed) .467 N 139 85
would you will change your bank if other bank interest in your culture
Pearson Correlation
-.080 1
Sig. (2-tailed) .467
42 4.3.5 Level of acculturation
We also like to know what factors may have an impact on the acculturation of Asian group.
We choose time of living, education level and age period to test.
how long living in Sweden I’m very involved in my cultural group how long living in
Sweden
Pearson Correlation 1 -.387**
Sig. (2-tailed) .000
Sum of Squares and Cross-products
91126.370 -2093.043
Covariance 220.645 -5.068
N 414 414
I’m very involved in the my group
Pearson Correlation -.387** 1 Sig. (2-tailed) .000
Sum of Squares and Cross-products
-2093.043 321.652
Covariance -5.068 .779
N 414 414
**. Correlation is significant at the 0.01 level (2-tailed).
Table 17 : Correlations (1)
The result indicates that the longer people with Asian cultural background lived in Sweden, the less they get involved in their own cultural group. In another word, time of living have a certain impact on acculturation.
highest level of education I’m very involved in my cultural group highest level of education Pearson Correlation 1 .054 Sig. (2-tailed) .273 N 414 414
I’m very involved in the my group Pearson Correlation .054 1 Sig. (2-tailed) .273 N 414 414 Table 18 : Correlations (2)
The results show that level of education and age do not have strong influence on the acculturation.
44 V. Conclusions
Concluding this research it is important to underline that a generalization of the results is not possible due to the answer frequency. However we hope that the paper could provide our readers a different understanding about the culture influence and differentiation in marketing service.
The aim of the research was to answer the following question:
To what extend that cultural factors influent on the Asian customer behaviour and expectation to Swedish banking service?
Based on our research, we recognize that the quality of the banks’ service is very important for Swedish financial service providers to get a high evaluation from their customers came from China, Thai and Sweden.
According to the Pearson correlation coefficient, we can rank the five dimensions of service quality from the most important to less important as the following order: reliability, responsiveness, assurance, empathy and tangibles. Their coefficients are 0.485, 0.440, 0.404, 0.342 and 0.198, respectively which means that the customers they valued reliability of the service quality as the most important dimension. Then the responsiveness, assurance and empathy, but the differences between these four aspects are not very noticeable.
Besides the service quality, we also knows that age and gender these two factors will not have a significant impact on customers’ attitude towards their financial service provider. However, the highest education level has a negative effect on customers’ judgments about their financial service providers.
According to the data analysis, we should say that there is not strong influence of culture on Asian customer’ expectation to the local banking service. There are several reasons to support our conclusion.
According our research, we choose e nationality, age, education level, language to test customers’ satisfaction as well as interests of culture to banking service. The results did not show strong connection to their final evaluation.
Secondly, the level of cultural involvement does not indicate an indirect impact on customers’ opinion about bank service. We thought language might be a big factor to influent people’s choice of bank, however, our Asian target group showed a neutral attention to this elements.
Thirdly, When we compared with Chinese, Thai, Swedish’ opinion about local banking service, there are not significant differences.
Although we cannot evaluate the extension of culture influence, we still gain some knowledge about the differences among the three target groups.
Even Chinese and Thai belong to the same Culture system; there are still some obvious differences between each other. Compared to Thai people’s answer, Chinese have much varied ideas about the banking service and the cultural factors they may provide. In another word, it could be more difficult for the bank managers to generate Chinese customers’ opinions since they turn out to be more individualism. Different Chinese may have very different idea about the same service. Although both Thai and Chinese groups are at the same level of expectation of banking service, Chinese seems to be more difficult to be satisfied and they show more interests on the language service than Thai. Chinese customers’ expectation is also influent by the level of education which is not so significant on Thai.
46
According to our despondence distribution, there a lot of young people aged from 20-40. They usually have very similar answers which make our questionnaire did not show much variety and generalisability. That could be another reason that we did not find out much significant differences among the three groups. However, we can still compare this particular age group’s answers and can be able to provide some
VI. Recommendations
According the survey results, the quality of banking service is high valued by Chinese, Thai and Swedish customers, however, each group have different expectations. In general, as we already notice that the service quality is very important for Swedish financial service providers to improve their total service satidfaction among their customers with Chinese, Thai and Swedish background. Further more, between the five dimensions of service qualiyt, our target group their valued reliability as the most important part, then the responsiveness, assurance, empathy and tangibles. Therefore, the service providers they should pay more attention to the reliability among their customers. Like make their customers believe that they can solve their problem effective and safe, install the confidence to their customers and so on.
However, Chinese customers show great difference from person to person. It is harder to general their interest and expectations on one service than Thai customers. In other word, for bank marketers, it could be very difficult to satisfy this group of people by simple policy or strategy. Among the culture elements we test in the paper, the level of education, language turn to play important role in the evaluation of Chinese customers to the banking service. Compared to the Chinese speaking employees’ service, providing information in Chinese language is more important since Chinese are more prefer to read and study documents than ask employees directly. In addition, Chinese people appreciate the feeling of trust; therefore, if bank manger can built such close relationship, a Chinese customer can be very loyalty.
Compared to Chinese, Thai customers generally hold identical view. They show more interest in cultural factors in the banking service. It can be a good idea for the
marketers to remember some Thai festivals and personally data to keep more Thai banking service. However, Thai customers show less loyalty than Chinese. If other
48
bank can provide more useful service, they can be more easily to swift their bank. Besides, language service will not so attractive to this group of consumers.
For future research, if somebody also interest in this topic, we hope that they can collect more data, because a large sample is very helpful to increase the validity and representative of the study. Besides this, we hope the data can distribute more evenly, such as collect more data from the working people not only the students and the propotion between male and female.
Reference lists:
1. Bitner, M. J., Booms, B. H., and Mohr, L. A. (1994). Critical Service Encounters: The Employee Viewpoint. Journal of Marketing, 58(4), 95–106.
2. Cateora, P. and Ghauri, P.(2005) International Marketing. Mcgraw-Hill, UK, 2005
3. Christian Grönroos, (2007) Service management and marketing: a customer relationship management approach. England: John Wiley and sons limited. 2nd edition.
4. Cohen, J. (1988). Statistical power analysis for the behavioural sciences (2nd ed.)
5. Cronin, J. J., and Taylor, S. A. (1994). SERVPERF versus SERVQUAL:
reconciling performance based and perceptions-minus-expectations measurement of service quality. Journal of Marketing, 58(1), 125–131.
6. Fisher, C., (2007). Researching and writing a dissertation: a guidebook for business students. England: Prentice Hall. 2nd edition.
7. Marija, J., (2008). SPSS 16.0 Guide to Data Analysis. New Jersey: Prentice Hall
8. Norusis, M., 2003. SPSS 12.0 Statistical Procedures Companion. New Jersey: Prentice Hall
9. Parasuraman, A., Zeithaml, V. A., and Berry, L. L. (1985). A Conceptual Model of Service Quality and Its Implications for Future Research. Journal of Marketing, 49, 41–50.
50
10. Riffe, D., (2005). Analyzing Media Messages : Using Quantitative Content Analysis in Research. Publisher: Lawrence Erlbaum Associates.
11. Valarie A. Zeithaml, Mary Jo Bitner, Dwanyne D.Gremler, (2006). Services marketing; integrating customer focus across the firm. Singapore: Mc-Graw hill. 4th edition.