Is financial health
a determinant of
sport success?
MASTER THESIS WITHIN: Business Administration NUMBER OF CREDITS: 30 ECTS
PROGRAMME OF STUDY: Civilekonom
AUTHOR: Marcus Hammarström & Albin Malmqvist JÖNKÖPING May 2019
A study which examines how the financial health of
professional ice hockey clubs in Sweden explains
the sport success in the Swedish Hockey League
(SHL).
i
Master Thesis in Business Administration
Title: Is financial health a determinant of sport success? Authors: Marcus Hammarström & Albin Malmqvist Tutor: Argyris ArgyrouDate: 2019-05-20
Key terms: Benchmarking, Financial benchmarking, Financial health, Ice hockey, Sport success, Grey Relational Analysis, Logistic Regression model.
Abstract
The purpose of this study is to find the relationship between financial health in an ice hockey club and its sport success. The study answers the research question: How can financial health of Swedish ice hockey clubs be able to explain the sport success in the Swedish Hockey League? Based on the research question, the study uses the theory Benchmarking and a more specific benchmarking terminology called Financial benchmarking. The study selects eight financial variables in order to benchmark the ice hockey clubs in the Swedish Hockey League (SHL). A particular methodology within financial benchmarking, called Grey Relational Analysis (GRA), is used in order to determine the financial health of the clubs in relation to each other and therefore be able to rank the clubs based on each individual variable. The same financial variables, with the addition of four non-financial variables and exclusion of two financial variables, are used in a selected Logistic Regression model to explain how the variables contribute to the sport success of the clubs. The main conclusions which can be drawn from the study are as follows: The variables Net sales and Net profit are the two only variables which are statistically significant and are able to contribute to sport success. Secondly, the club HV71 is overall the club with the most optimal financial health in SHL, among the 12 clubs investigated. Lastly, accounting trends within this industry affects the financial outcome and further how it explained sport success. Trends such as a minimal or no amount of long-term liabilities is common among the clubs, where instead the total amount of liabilities mainly consists of current liabilities. It can be further concluded that profitability, revenue and equity are financial corner stones in a hockey club which participates in SHL.
ii
Acknowledgements
We wish to thank our tutor, Argyris Argyrou, for his insight and guidance throughout the writing process. He has helped us with valuable feedback and expertise in accounting and thesis writing which made it possible for us to fulfill the purpose of this thesis. We also wish to acknowledge our fellow partners who during the seminars contributed with interesting thoughts and feedback in our research project to further develop it.
In addition, we would like to thank our families and friends. We are grateful for their encouragement, positivity and support throughout the process of writing this thesis.
____________________ ____________________ Marcus Hammarström Albin Malmqvist
Jönköping International Business School May 2019
iii
Table of Contents
1
Introduction ... 1
1.1 Background ... 1
1.2 The terminology of this study ... 3
1.3 Problem statement ... 4
1.4 Purpose ... 5
1.5 Disposition of the thesis ... 5
2
Frame of references ... 7
2.1 Benchmarking ... 7
2.1.1 Financial benchmarking ... 8
2.1.2 Criticisms of benchmarking ... 9
2.2 Financial analysis in sport businesses ... 10
2.3 Grey Relational Analysis ... 11
2.3.1 Criticism of Grey Relational Analysis ... 12
2.4 Final remarks ... 13
3
Methodology ... 15
3.1 Data collection ... 15
3.1.1 Sample selection ... 15
3.1.2 A description of the data collection process ... 16
3.1.3 Financial variables selection ... 17
3.1.4 Non-financial variables selection ... 18
3.2 Grey Relational Analysis ... 20
3.3 Logistic Regression model ... 21
4
Results ... 23
4.1 Logistic Regression model ... 23
4.2 Grey Relational Analysis ... 25
4.2.1 Initial step ... 25
4.2.2 Normalisation step ... 26
4.2.3 Deviation sequence ... 27
4.2.4 Grey Relational Coefficient ... 28
4.2.5 Financial rankings ... 29
5
Analysis ... 31
5.1 Logistic Regression model ... 31
5.1.1 Underlying factors to Net sales and Net profit ... 31
5.1.2 Non-financial aspects ... 34
5.2 Grey Relational Analysis ... 36
5.2.1 Profitability and revenue ... 36
5.2.2 Assets, liabilities and equity ... 38
5.3 Overall analysis and limitations... 41
6
Conclusion ... 43
iv
7.1 Societal and ethical concerns ... 45
7.2 Future research ... 47
8
References ... 48
9
Appendices ... 52
Tables
Table 1 The financial variables selected for the study……….18Table 2 The non-financial variables selected for the study………. 19
Table 3 The variables selected for the Logistic Regression model…………. 22
Table 4 Logistic Regression model………. 24
Table 5 Financial variables for all clubs……….. 26
Table 6 Normalisation step……….. 27
Table 7 Deviation sequence………. 28
Table 8 Grey Relational Coefficient……… 29
Table 9 Rankings for each club and variable………... 30
Appendices
Appendix 1 Data collection……….521
1
Introduction
The first chapter provides an introduction to the study. To begin with, background information is provided, which is followed by a section of the terminology in the study. Further, the problem statement is described and lastly the purpose of the study is explained, which contains the research question and hypothesis development.
This study examines how the financial health in professional ice hockey clubs in the Swedish Hockey League explains sport success. The study determines whether a certain level of financial health can contribute to the sport success in a certain club and season. The data consists of 12 selected hockey clubs over a period of the recent 10 seasons. Specific financial variables are used in the Grey Relational Analysis, to determine the financial health of each hockey club. A Logistic Regression Model is used in order to explain how the variables, financial and non-financial, can be able to contribute to the sport success in this league.
1.1
Background
Ice hockey is not only a sport, it is also an industry and business that aim to maximize profits. The total amount of revenue from each of the clubs playing in the Swedish Hockey League last season were estimated to over 1 billion SEK, and the total amount of spectators during the season 2017-2018 reached 2 355 981 (SHL AB, 2018). The total capital employed in the clubs are several millions SEK and is equivalent to medium sized limited liabilities. The Swedish Hockey League, shortened SHL, is the top hockey league in Sweden. It consists of fourteen teams which play 52 rounds in the ground play. The six first placed teams after the ground play, qualifies to the playoff for the championship and team seven to ten play for the last two places in the playoff. Team ranked eleven and twelve must play about their remaining participance in SHL against the two top clubs from the second highest league, “Hockeyallsvenskan” (SHL AB, 2018).
Ensuring that the clubs on this professional level have a stable financial status, the Swedish Hockey Association has set up minimum limits on the stockholder’s equity
2
(Svenska Ishockeyförbundet, 2017). Before the season 2018/2019 the teams qualified to play in SHL must show a stockholder’s equity at minimum 4 million SEK, otherwise a team will be relegated to lower leagues. This limit will increase successively over the upcoming seasons. The reason why the Swedish Hockey Association has set up this limit is to ensure that the clubs playing in the league are financially stable and do not face the risk of a possible bankruptcy during a season. (Svenska ishockeyförbundet, 2017). This is because that, sport organisations act more opportunistic than other profit maximisation businesses, because these organisations invest an extensive amount of salaries for the players, with the aim of increase the success in the league. In this case, some clubs make a continuous loss over the years in searching for the sport success.
Ice hockey has developed to be a global business and SHL faces high competition from other European and north America top leagues. These leagues contains larger clubs that are able to remunerate the players with higher salaries compared to most Swedish clubs. It is therefore necessary for all clubs participating on the elite level in Swedish hockey to be able to collaborate with each other to increase the market share against the other leagues. It is in this stage when analysing the market, financial benchmarking becomes useful and a tool to develop its business. The focus is now to connect the financial performance to the sport performance of these clubs to see if there might be a relation between the two.
This study fills a gap in existing literature, that no other current study within this field has tested the ability of financial measurements, with the complement of non-financial aspects, in order to explain the sport success within a hockey league with the usage of a Logistic Regression analysis. The study also takes a fundamental approach in determining the financial conditions over a ten-year period in the Swedish Hockey League by applying the Grey Relational Analysis. The combination between logistic regression model and Grey Relational Analysis makes this study unique and contributing to existing literature in this research field. In addition to this, the study may improve the efficiency in the clubs playing in Swedish Hockey League and help the managers to focus on the right aspects.
3
1.2
The terminology of this study
Financial analysis in combination with financial benchmarking are the basis for this study. The methods are simple to conduct and give valuable information, such as how the conditions in one organisation is today and historical values. Financial analysis consists of different financial variables describing information about liquidity, solvency, profitability and efficiency. The financial analysis gives valuable information about the differences between organisations and therefore determine the financial health in these organisations when the financial variables are compared to each other. (Thiagarajan, 1993). Financial health is as how well and effective the organisation uses its assets to generate money (Bhunia et al., 2011).
In order to compare the financial performance and financial health between the organisations, the study uses the method Benchmarking. Benchmarking is simply the comparison of several business functions with other companies in the same industry to find similarities and differences (Pryor, 1989). Comparing the own business, in this case, one hockey club to other hockey clubs in the same industry gives information how the “best practice” hockey club does well in its operation. This is a very valuable tool to increase the competitive advantage when an organisation has the knowledge of what other organisations do. Benchmarking is a general term and model but have developed to be more specialised throughout the years. The benchmarking tool this paper focuses on is “financial benchmarking”, which compares the financial variables between the organisations in interest (Vasilic 2014).
Grey Relational Analysis has been used in various aspects, within finance, accounting and other purposes, such as multi-performance characteristics in drilling (Tosun, 2006). GRA leads to a final ranking, in this case between 1-12, to determine the organisation which performs most optimal according to the selected financial variables. A step-process is used, with the initial step to structure the variables in a table format. This implies that variables are stated in the columns, in this case clubs, and variables in the rows, in this case financial variables. The entire step-process leads to the calculation of the so-called Grey relational coefficient, which reveals the most optimal alternative and state it with the value equal to 1.000, then the following alternatives gets a value between 0.000 and 1.000. The closer a value of the alternatives gets to 1.000, the more optimal it is
4
considered to be. This is then used as the basis for the ranking of each organisation for every single financial variable as well as an overall ranking, including every rank combined into one. (Wu, 2002).
The study uses a Logistic Regression model, in order to determine if any of the selected independent variables may explain the single dependent binary variable (Peng, Lee & Ingersoll, 2002). The dependent variable is described as “sport success”, which more specifically implies if a club in the sample manages to become champion in a particular season or not. The independent variables are constituted by several selected financial variables, and in addition, several non-financial variables as a complement in order to enhance the analysis.
1.3 Problem statement
An ice hockey game at the professional level consists of several parts which is the base for income for the clubs. There must be players who participate in the game. These players must be organised in the clubs which compete with each other. The teams set up a league that has the responsibility for the design of the games and have the management of the competitions. The last part is the need for stadiums and equipment to be able to conduct an ice hockey game. When these parts are fulfilled, it consumes by spectators and other audience such as broadcasting on TV and radio (Borland, 2006). According to this, other parties than just the players competing in the game become involved in the game. The overall popularity for an ice hockey game in general and SHL in particular is determined by the demand for it (Gouguet, 2006). An ice hockey club at the elite level is seen as a company that seek profit maximisation. This means that a club at this level must consider aspects which affect the demand for the games. According to Simmons (2006), the demand for an ice hockey games depends on simple economic theory, such as price of tickets, the overall national economy and the importance of the game.
This implies that there are various factors, financial as well as other, to be considered among the clubs in SHL. Aspects which perhaps might affect the sport performance of these clubs in different ways, positively or negatively. It is of high importance to
5
investigate whether these financial, as well as non-financial, aspects connected to an ice hockey club participates in SHL can be able to explain the sport outcome of the same club. This particular league is selected as sport industry to represent the Swedish setting.
1.4
Purpose
The research question of the study is as follows:
How can financial health of Swedish hockey clubs be able to explain the sport success in the Swedish Hockey League?
The research question and its purpose is divided into two parts, where the initial part of the question is to analyse the financial health of the clubs based on the benchmarking concept and secondly to use the financial and non-financial measures in relation to the sport outcomes of the clubs to see whether it can be explained by the financial health. Based on the background and previous literature, it is stated that financial health may have an impact on sport success. There is however no current study which has determined this in greater detail. This study aims to fill the gap in the current literature by the usage of certain financial, as well as non-financial variables, to determine whether these might explain the sport success of ice hockey clubs in a Swedish setting. Based on this purpose, the study is based on a null hypothesis at a five percent significance level. The null hypothesis is the following:
H0: Financial health has no impact on sport success
1.5
Disposition of the thesis
Next, a chapter which contains the review of the current literature in the field of research related to the purpose and research question of this study. The existing literature within the field of research is reviewed in order to assess the previous research within this field and therefore to discover gaps in this existing literature. The study continues with a methodology section, which explains the data collection, the selected variables and the
6
different models. This is followed by a presentation of the results. The analysis continues with the purpose to bring new insights to the topic and the research question in the light of existing literature. This is followed by a discussion chapter, with the aim to discuss the research in a wider perspective, more specifically societal and ethical aspects. The study ends with a conclusion, which highlights the important aspects which can be drawn in order to answer the research question of this study and the call for future studies within this field of research.
7
2
Frame of references
The purpose of this chapter is to critically review the current literature in the fields of research related to the purpose and research question of the study. Initially, the research within Benchmarking is reviewed. This is followed by a section within Financial benchmarking. Further, a section which reviews financial analysis in sport organisations. Lastly, the literature within the specific methodology Grey Relational Analysis is reviewed. The entire chapter ends with final remarks which can be drawn.
2.1
Benchmarking
Camp (1989) is one of the researchers that made benchmarking as a management concept popular. He described benchmarking as “the continuous process of measuring products, services, and practices against the toughest competitors or those companies recognised as industry”. The benefits of benchmarking according to Camp (1989) is that it incorporates the best practices from the industry into a single business operation. Camp also explained that benchmarking develops an entire industry because benchmarking identifies for example technological breakthrough from another industry that would not be incorporated in the own industry otherwise. According to Camp benchmarking improves the overall productivity and efficiency in a business operation.
Xerox was the first bigger company to implement benchmarking and made it as a management tool popular 1989 (Dattakumar & Jagadeesh, 2003). Xerox and Camp were however not the first company and researcher to implement benchmarking as a management tool. Brisley (1983) explained benchmarking at a first time 1983, thereafter Guilmetle and Carlene (1984) improved the concept. The research in benchmarking became very popular during the 1980s in the academics but have today reached a maturity level. The popularity in research about benchmarking developed benchmarking to a management fad during the 1990s (Dattakumar & Jagadeesh, 2003).
Benchmarking applies for nearly all businesses because it is an overall theory that does not require single industry aspects (Camp, 1989). Vorhies and Morgan (2005) studied the applicability of benchmarking in marketing capabilities. They examine the business
8
performance from benchmarking on marketing capabilities of top- performing firms. The study concludes that benchmarking can improve the competitive advantage by identifying, building and enhancing marketing capabilities.
Böhlke and Robinson (2009) continued to investigate the applicability of benchmarking in a narrower approach. In its study benchmarking was studied if it could be implemented in elite sport systems. Elite sport systems are the practices to prepare athletes and teams for international sport success (Böhlke and Robinson, 2009). It is the process from the beginning, identifying raw talents and develop these talents to become champions at the elite top level. Böhlke and Robinson (2009) further identified if benchmarking can be a tool to improve elite sport services in a country by study other countries’ elite sport services. The authors concluded that benchmarking can be a tool to improve an elite sport system in the light of learning from other systems and not by simply copying other elite sport systems.
2.1.1 Financial benchmarking
Liu (2019) revealed that financial benchmarking uses the financial data of an organisation and compare it between firms and evaluate the differences and similarities in the industry these firms operate in. With modern use of databases and other technical features it is very easy and effective to implement financial benchmarking (Liu, 2019). Vasilic (2014) was on the same track as Liu (2019) that financial benchmarking is one of the most popular method of benchmarking, because it is simple to conduct and collect the data. Vasilic (2014) studied two rival firms in the confectionary industry and showed how financial benchmarking can be applied between these companies. The study concluded that financial benchmarking helps the firms improve its efficiency, when they receive knowledge how the rival firm performs financially. Financial ratios are not a new measurement when analysing the organisation’s performance, but to compare this to other competing firms has been more popular in recent years (Dattakumar & Jagadeesh, 2003
).
The study by Vogel & Graham (2013) was similar to Liu (2019) but instead used financial benchmarking as a tool in the airport industry. The outcome from this study focused on determine certain clusters within the industry and concluded that based on the clusters,
9
airport location has a major impact on the financial success of the airports. Similar to the focus of the study conducted by Vogel & Graham (2013), Simpson & Kondouli (2000) focused on the use of financial benchmarking in order to compare three organisations operating in different service industries. Simpson & Kondouli (2000) concluded that benchmarking is applicable within the service industry as well. A limitation in the study conducted by Simpson & Kondouli (2000) is the fact that only one organisation cannot be seen as a reliable representation of an entire industry.
2.1.2 Criticisms of benchmarking
Financial benchmarking in particular and benchmarking in general is a tool for decision making, and therefore the information about the comparable firms must give reliable information. Schmidgall and DeFranco (2016) stressed out the fact that historical financial achievements do not explain how the future will be, instead the tool is a forecast for the future.
Benchmarking as a concept has several different definitions depending on the type of research. Some benchmarking research only contain a few steps in the model, and other have more steps in the model. Anand and Kodali (2008) benchmarked the research in this field and find a universal benchmarking process consisting of 12 phases and 54 steps. The study by Anand and Kodali (2008) showed that benchmarking as a general tool is a rigorous analysis that requires lot of resources.
Another criticism benchmarking has faced is that it does not take the business environment into account (Dattakumar & Jagadeesh, 2003). Every organisation is unique with its own cultural and mission how the daily work is operated. This of course affects how it performs in the financial books. It is therefore important to take these differences in mind when implementing benchmarking, that the analysis is based on a same ground. Anderson and McAdam, (2004) described that benchmarking only look backwards on historical data of what the “best-practice” organisation has done to be the market leader. Improving an organisation’s operations can not only be based on historical data or imitate the “best-practice” organisation in the industry. The organization must take a step forward
10
and predict future outcomes. The way that has made an organization profitable today, may not be a successful way in the future.
2.2
Financial analysis in sport businesses
Barajas, Fernández-Jardón & Crolley (2005) studied the relationship between revenues and the performance on the field in the Spanish football league. It was concluded that expected income is in some degree correlated to sport performance on the field. In relation to this, Szymanski and Kuypers (1999) determined the correlation between sport performance and income in the English football league and concludes that it is a very high relationship between these objectives. Szymanski and Kuypers (1999) also concludes that directors in the clubs focus to maximize financial profits in recent years.
There is a range of studies which studied the financial performance in the football industry (Sakinc, Acikalin & Soyguden, 2017; Barajas, Fernández-Jardón & Crolley, 2005; Pinnuck & Potter, 2006; Ecer & Boyukaslan, 2014). However, the majority of the studies focused on the financial performance and not the correlation between financial health and sport performance. Sakinc, Acikalin & Soyguden (2017) studied the relationship between the European football clubs that are listed on any of the European stock exchanges and compare the financial performance to the UEFA’s ranking. Sakinc et al. (2017) concluded that there is a weak correlation between financial performance and sport performance. According to Pinnuck & Potter (2006), what determines successful performance on-field in the Australian Football League is the amount of match attendance and membership increases. To determine the strength of the relationship between the football performance and financial performance was greatly emphasized by the authors. A similar approach which was emphasized by (Barajas, Fernández-Jardón & Crolley, 2005). With this in mind, Ecer & Boyukaslan (2014), additionally came to the conclusion that financial health and sport success is considered positively correlated among various football clubs in Europe.
EY (2018) annually studies the financial health in the fourteen clubs that play in the Swedish Hockey League. The report provides an extensive amount of financial
11
information for the season 2017-2018. It investigates the trends and development of the financial conditions in the clubs. The report shows that there is some correlation in league position and financial health.
Financial statement information can be used as a predictor which shows the opportunity of future annual earnings (Wahlen & Wieland, 2011). In this study Wahlen & Wieland (2011) tested whether financial statement information uses ex ante to predict earnings and therefore which firms are “winners or losers” among analysts’ recommendations It is important to note that ex ante studies may not be fully reliable in the fact that the actual outcome has not been determined and therefore only work as a forecasting tool.
The use of financial ratios is a key element of study within this research field. Apart from Wahlen & Wieland (2011), Young & Zeng (2015) instead showed how firms in the same industry compare each other on the basis of financial statements and analysis of them. Comparability is an important aspect when evaluating performance measures of a firm towards its peers in the industry (Young & Zeng, 2015). Demirakos, Strong & Walker (2004) stated that the choice of methods in terms of valuation and performance evaluation is commonly determined of the industry environment which varies from one industry to another and therefore no single method can be applicable to more than just one or a few industries.
2.3
Grey Relational Analysis
A particular method when comparing organisations in an industry, based on financial ratios, is the Grey Relational Analysis (GRA). This method is part of a wider range of methods in multiple attribute decision making (MADM) problems (Wu, 2002). According to Wu (2002), the advantages of using GRA is that the calculations are simple and easily understandable, and the results are based on original data. There are however other similar methods which can be used instead. One is the so-called TOPSIS method, which instead of GRA is a technique for order preference by similarity instead of differences to find the ideal alternative (Wu, 2002).
12
Grey Relational Analysis is used in various fields of research to find the optimal alternative with several factors affecting the outcome (Ho & Wu, 2006; Kuo, Yang & Huang, 2008; Tosun, 2006). Grey Relational Analysis determines reliable solutions in an effective way when they are benchmarked with outcomes from current methodologies (Kuo, Yang & Huang, 2008). Tosun (2006) used the GRA to test the optimisation of drilling process parameters for the burr height and work piece surface roughness. With parameters such as; cutting speed, feed rate, as well as drill and point angles were considered.
Similar to how the GRA has been used for other research fields, the method constituted a central role for the paper done by Ecer & Boyukaslan (2014). The authors examine financial performance of football clubs in Turkey, primarily by the use of financial ratios and the Grey Relational Analysis. A number of liquidity, liability and profitability ratios determine the most optimal club of four Turkish football clubs, but also to find out which financial indicator measures financial performance to the greatest extent. The paper introduces with a showcase of the sport performance between the clubs, in terms of championships and cups won. There is no connection between the financial health and sport performance (Ecer & Boyukaslan 2014).
In relation to the term financial benchmarking, the study by Ho & Wu (2006) used the Grey Relational Analysis as a methodology to benchmark performance evaluation of banks with the stock market in focus. The authors stated that the method of GRA deals with the issues of sample distribution uncertainty and sample size. A comparison between GRA and Financial Statement Analysis was conducted and concluded that the GRA approach was considered more optimal than financial analysis since it narrowed down the original 59 ratios into 23 (Ho & Wu, 2006).
2.3.1 Criticism of Grey Relational Analysis
Grey Relational Analysis model has encountered some criticisms. Connected to the calculation of the coefficient in the model, Kuo, Yang & Huang (2008) determined a parameter sensitivity problem, where different coefficients determine various outcomes. Related to this fact, Ho & Wu (2006) instead stated the fact that this method of choice
13
might face problems connected to the aggregation of variables. A problem which might occur if the method is not adjusted to other involved issues, except financial variables in the analysis.
There might be a limitation in terms of reliability by using only one of the MADM methods. Therefore (Wu, 2002) suggests that several of these methods are used simultaneously in order to compare the results from all of them and determine a reliable conclusion. Another note is the fact that the GRA method determines one final ranking based on a range of variables. This can be seen as a major limitation because an extensive range of factors cannot be fully comprised into a single rank, with an equal level of influence towards from each individual variable (Huang & Liao, 2003).
2.4
Final remarks
Previous studies show that benchmarking is a common management tool to investigate the best practices of an industry and to implement these practices in the own business (Camp 1989). It improves the efficiency and productivity in a business, but also can develop the overall industry (Vorhies and Morgan, 2005). Benchmarking was however increasingly popular during the 1990s when the research of benchmarking peaked (Dattakumar & Jagadeesh, 2003). Research within this field reveals that benchmarking can be implemented in nearly every type of industry and is therefore considered a widely used theoretical concept (Böhlke and Robinson, 2009). In recent years, this theory has developed to become rather specialised in the sense of the focus on financial benchmarking as a methodology within benchmarking (Liu, 2019). Financial benchmarking is easier to conduct and does not require a lot of resources to be executed in practice (Vasilic, 2014). With this in mind, benchmarking has received criticism towards it, which has to be taken into consideration when applying it in a study.
One particular method within financial benchmarking is the Grey Relational Analysis. It is a method which leads to the outcome to rank organisations in the same industry on the basis of the variables selected (Wu, 2002). GRA is an example of why financial benchmarking is easy to conduct and be able to guide an organisation to compare itself
14
with its competitors (Ecer & Boyukaslan 2014). The Grey Relational Analysis also shows the overall financial health in an industry (Ho & Wu, 2006). Nevertheless, this method of choice has, similar to the entire theory of benchmarking, received criticism.
The financial performance in relation to sport performance have been studied within this field (Pinnuck & Potter, 2006). In the football industry it can be concluded that financial health is positively correlated with sport success (Ecer & Boyukaslan, 2014). With this in mind, a common focus has been on the football industry in various countries. Therefore, a study to instead investigate the ice hockey industry is highly required to be conducted.
15
3
Methodology
This chapter firstly describes and explains the data collection process of the study. It is followed by a description of the sample selection as well as the financial variables and non-financial variables. The two models, Grey Relational Analysis and Logistic Regression Model used for this study are then presented and further explained.
3.1
Data collection
This is a quantitative study which assesses the financial health within the Swedish ice hockey industry to explain sport success in the clubs. The data primarily constitutes of secondary quantitative data based on the clubs’ annual reports. This is done in a 10-year period, between the seasons 2008-2009 to 2017-2018. Why the study uses a 10-year span instead of e.g. a 5-year span is that the results from a more extensive time period often lead to a more reliable data collection overall, which constitutes a stronger basis for reliable results and conclusions further on.
3.1.1 Sample selection
Twelve hockey clubs are selected for this study, namely; AIK, Brynäs IF, Djurgården IF, Frölunda HC, HV71, Leksands IF, Luleå HF, Malmö Redhawks, Modo HK, Skellefteå AIK, Växjö Lakers and Örebro HK. During the sample period, the selected clubs have not only been playing in the Swedish Hockey League. The most optimal would be to include every single club which have been playing in SHL in any season during the sample period. There are several clubs which its financial statements are not available or only have few available financial statements. The study therefore chooses clubs that have been playing in SHL in at least one season during the sample period and have at least six available financial statements. The reason for this is to increase the reliability for the data and not having a high degree of missing data.
One club that would be interesting to include in the data collection, but does not have any available financial statements is Färjestad BK. This club has played in SHL in all seasons during the sample period and has also been very successful in winning the championship several times. The same applies for Linköping HC which also has been playing in SHL
16
during all season in the sample period but has fewer than six available annual reports. The reasons that Färjestad BK and Linköping HC do not have any available annual reports, is that they operate as non-profit associations. Linköping HC however transformed the part which operates the hockey activity to a limited liability in 2016. Since Linköping HC only has two available annual reports they must be excluded from this study.
3.1.2 A description of the data collection process
The data collection is obtained by a research through the official SHL webpage for the entire range of teams. The official webpage for each club is assessed in order to find the provided annual reports. Some clubs do not publish its annual reports on its official webpage, for that reason “allabolag.se” is used to find the remaining annual reports. It is a database consisting of annual reports of all limited liabilities in Sweden. The annual reports that are obtained from “allabolag.se” are from the clubs AIK, Djurgården IF, Leksands IF, Malmö Redhawks, Modo HK, Växjö Lakers and Örebro HK. Since “allabolag.se” only publishes annual reports from limited liabilities, this study must collect annual reports from the clubs that are non-financial associations elsewhere. This is done by relying on that these clubs publish their annual reports on the official webpage. A majority of the clubs in this study operate as a group consisting by several sub-companies. The annual reports for these clubs are consolidated by the entire group. Since the purpose of this study is to assess the financial health of the club and its sport success, the decision is to use the statement which is directly connected to the part that operates the team playing in SHL and not the entire group. It is far more relevant to only use data which not includes other companies that may not be directly related to the hockey operation. The structure of the groups various in high degree between the clubs. Some group consists by a lot of sub- companies and other consists of only one. The most clubs have a sub company that is the team which plays in SHL, and if the club own the stadium there is a sub company that manage the stadium. Mother company for all the groups is usually a non-profit association. It is for that reason the data consists of the financial statement from the company operating the team playing in SHL.
17
An aspect to consider when analysing the annual reports of hockey clubs in SHL, is that they are not following a fiscal year from 1st January to 31st December, which is the most
common period for a company to follow in the business in Sweden. The hockey clubs in this league refer an annual period as a season, which in SHL starts 1st of May and ends
30th of April annually.
In order to give a true and fair view of this particular industry, the data collection is conducted with ethical considerations into account. This implies that the data collection is only data which is publicly available and if further data is required, it is with the consent through direct contact with the entities included in the sample.
3.1.3 Financial variables selection
Analysing the financial health of the selected hockey clubs, certain financial variables are used. Answering the research question in this study, the financial variables are used to determine whether these can explain the sport success of the clubs selected, with complement of non-financial variables explained in the upcoming section.
The financial variables are; Operating profit, Net sales, Net income, Total assets, Total liabilities, Equity, Current assets and finally Current liabilities, which can be seen in Table 1 below. These financial variables are used as a basis for the Grey Relational Analysis as well as the Logistic Regression model. The term “Aim” in Table 1 implies in which direction the optimal value is to seek. Net sales e.g. seeks to have a value which is as high as possible, hence “Maximum”. Whereas another variable, e.g. Current liabilities, seeks a value which is as low as possible, hence the aim is “Minimum”. This additional column is considered valuable information for the entire Grey Relational Analysis.
18 Table 1
The financial variables selected for the study
Operating profit determines the amount of profit the clubs have in the core business, except from taxes and interests. The second variable, Net sales, simply shows the amount of sales generated in the business for each club. Net profit is connected to operating profit, but instead describes the final profit in the organisation. The variables Total assets as well as Current assets determine the amount of assets the club possess, both in terms of a total amount along with a current amount, which focuses on the short-term assets for each annual period. The same implies for Total liabilities and Current liabilities that focus on the amount in total liabilities and in an annual short-term perspective. Finally, the variable Equity, is selected in order to determine the total equity levels among all the clubs.
3.1.4 Non-financial variables selection
The study includes several non-financial variables presented in Table 2 below. These variables are chosen as a complement to the financial variables, to enhance the study. Financial variables are only a product of several underlying factors and applying some of these underlying factors into the study, it enhances the study and makes the analysis more nuanced. It gives the reader a wider understanding of what might explain sport success, other than only financial factors. The study chooses the four non-financial aspects
Variable Aim
Operating profit Maximum
Net sales Maximum
Net profit Maximum
Total assets Maximum
Total liabilities Minimum
Equity Maximum
Current assets Maximum
19
presented in Table 2 below because these are considered highly connected to the sample and further ice hockey industry.
The first variable is Fired coach, which describes as shown in table 2 below, if the team fired its coach during a season or not. It is interesting to see whether it may have an impact on the sport success if a team fires its coach or not. The second variable consider the junior players. All twelve clubs have academies to develop young players, but the number of junior players in the senior team differs among the teams. This variable is supposed to give interesting aspect if the total number of junior players have an impact on the sport success. Junior players in this case implies players of age 20 and below. The study also consists of a variable that take the number of foreign players in the team into consideration. The same as junior players, number of foreign players is supposed to show if it has an impact on the sport success. The fourth and final non-financial variable considers if the team playing in SHL also have a women team or not in the women’s highest league. This will explain if the SHL team becomes positively affected to also have a women team.
Table 2
The non-financial variables selected for the study
Non-financial variable Description Variable
Fired coach If the club has fired the coach during the season Binary variable
Junior players The number of junior players in the senior team Discrete variable Foreign players The number of foreign players in the senior team Discrete variable Women team If the women team plays in the top hockey league in Sweden Binary variable
20
3.2
Grey Relational Analysis
The steps of GRA are described by Wu (2002) and are now presented in this study with modifications to fit the research methodology purpose. Additionally, it is modified in the sense of instead to determine an overall ranking which constitutes the entire outcome, a ranking is determined for each individual financial variable.
- Step 1: Construct the presentation structure
Xi = X1(1) X1(2) . . X1(n)
X2(1) X2(2) . . X2(n)
. . . . .
Xn(1) Xn(2) . . Xn(n) (1)
Where the financial variables are presented in the columns and the hockey clubs in the rows, then these X values are the outcomes of each variable to clearly connect to each club.
Step 2: Normalise the data set. By normalising the data set, the values are more comparable in order to have all values between 0 and 1. Data in this study is treated by one of the two types; larger is more optimal or smaller is more optimal. This refers to what is previously presented under Aim in Table 1 for each of the chosen financial variables. There are two optional equations dependent on if a larger or smaller value is preferred, Eq. (2) and Eq. (3).
For a “higher-is-optimal” transformation, Xi (j) can be transformed to Xi* (j), with
the formula:
Xi* = Xi (j) – minj Xi (j)
maxj Xi (j) – minj Xi (j) (2)
where maxj Xi (j) is the maximum value of entity j and minj Xi (j) is the minimum
value of entity j.
Instead for a “lower-is-optimal” transformation, the formula to transform Xi (j) to
Xi* (j) is:
Xi* = maxj Xi (j) – Xi (j)
21
- Step 3: Compute the distance of Δ0i(j), the absolute value of difference between
X0*and Xi*at the j-th point.
This is calculated by the formula:
Δ0i(j) = |X0*(j) – Xi*(j)| (4)
Where, Δ is equal to the deviation (expressed as delta), which implies the distance between either the minimum or maximum value to the actual value.
- Step 4: Apply the Grey relational coefficient by the use of the equation: 0i (j) = Δ min + Δ max
Δ0i (j) + Δ max (5)
Where, Δ max = maxi maxj Δ0i (j) Δ min = mini minj Δ0i (j) and [0,1]
is distinguished as an identification of the range between 0 and 1. Usually, the value of is taken as 0.5.
3.3
Logistic Regression model
The study uses the Logistic Regression model stated below:
Logit (Y)= ln( )= α+β1X1+β2X2+β3X3+β4X4+β5X5+β6X6+β7X7+β8X8+β9X9+β10X10+e
(6) Each of the variable contained in the model are presented and described in Table 3 below. The financial variables used in the model (X1 – X6 in Table 3) are expressed in
100 000 SEK for each unit. This is a decision based on the fact that after testing the model in SPSS, the value of 100 000 SEK for each unit is considered a choice which leads to a more optimal outcome than if 1 SEK or even 1000 SEK for each unit would have been used. As an additional note, the study decides to exclude the two variables Operating profit and Current assets because they have a high correlation with the other
22
variables in the model and therefore do not contribute to the outcome of the model in any way.
Table 3
The variables selected for the Logistic Regression model
Variable Description
Y Dependent variable
π Probability for a hockey club to become a champion
1-π Probability for a hockey club to not become a champion
α Intercept of Y β Regression coefficients X1 Net sales X2 Net profit X3 Total assets X4 Total liabilities X5 Equity X6 Current liabilities X7 Fired coach X8 Women team X9 Junior players X10 Foreign players
23
4
Results
In this section of the study, the results are presented. Firstly, the results from the Logistic Regression model are described. This is followed by the results from the Grey Relation Analysis. The results are aimed to fully relate to answering the research question of this study.
4.1
Logistic Regression model
The outcome from the logistic regression model is shown in Table 4 below. According to the output, the variable Net sales describes that holding the other variables at a fixed value, for every increase of 100 000 SEK in net sales, the probability that the dependent variable becomes 1 increase by 0,006. This relationship is statistically significant with a p-value of 0.026. The variable Net profit describes that holding the other variables constant, the probability that the dependent variable becomes 1 increase by 0,013 for every 100 000 SEK increase in net income. This is also statistically significant with a p-value of 0.03. The remaining variables are not statistically significant according to the outcome in Table 4. However, it is still interesting to interpret these variables because it gives a hint what explains sport success.
The variables Total assets, Total liabilities, Equity, Current liabilities are variables which do not increase nor decrease the probability that the dependent variable becomes 1 and therefore gives the answer that these variables do not explain sport success whatsoever. Even though the remaining three variables Fired coach, Women team, Foreign players, and Junior players are not statistically significant, these give a hint how they may affect the sport success. Fired coach increases the probability that the dependent variable becomes 1 by 1,349. Having a women team decreases the
probability that the dependent variable becomes 1 by 0,748, the same is for numbers of foreign players which decreases the probability that the dependent variable becomes 1 by 0,150. Number of junior players increases the probability that the dependent variable becomes 1 by 0,006. Again, these variables are not statistically significant and therefore cannot be fully relied on.
24 Table 4
Logistic Regression model
Note: Data from the sample of the twelve clubs that this study is based on. The dependent variable is coded as 1 for the champion in each season and 0 as not being a champion for each season. The dummy variable “Fire Coach” have the value of 1 if the team fired its coach in one season and 0 if they did not. The other dummy variable “Women team” is coded 1 if the club has one women team in the Swedish lady hockey league or 0 if they do not. Cox & Snell’s R2= 0,187. Nagelkerke’s R2= 0,397. N=103
The Hosmer & Lemeshow test describes the goodness of fit for the model, which is the overall significance of the model. This study sets the significance level at 0.05 which tests the support or lack of support for the null hypothesis in a 95 percent confidence interval. It is concluded from the Hosmer & Lemeshow test that the overall model is statistically significant, because large p-values are optimal when explaining the overall goodness of fit. Cox & Snell’s R2 and Nagelkerke’s R2 is similar to the adjusted R2 in an ordinary least
square model, namely how much the variation is explained by the model. However, in a Coefficient β Standard Error (S.E.) Wald Df P-value Exp(B)
Net Sales 0,006 0,003 4,969 1 0,026 1,006 Net Profit 0,013 0,006 4,702 1 0,030 1,013 Total Assets -0,001 0,001 2,599 1 0,107 0,999 Total Liabilities -0,002 0,005 0,276 1 0,599 0,998 Equity 0,000 0,004 0,007 1 0,932 1,000 Current Liabilities 0,000 0,001 0,104 1 0,748 1,000 Fired Coach (1) 1,349 1,395 0,936 1 0,333 3,855 Women Team (1) -0,748 1,018 0,540 1 0,462 0,473 Junior Players 0,006 0,127 0,002 1 0,961 1,006 Foreign Players -0,150 0,148 1,020 1 0,313 0,861 Constant -6,485 3,404 3,629 1 0,057 0,002
Test Chi² Df P-value
Goodness-of-fit test
25
logistic regression a single adjusted R2 cannot be computed. Therefore, the model has two
methods to explain the variation by the model. Cox and Snell’s R2 and Nagelkerke’s R2
can be improved in this study adding one or more variables that will contribute to the study. The study already consists of many variables, improving Cox & Snell’s R2 and
Nagelkerke’s R2 the variables need to be more qualitative. As table 4 shows there are not
so many variables that are statistically significant. Improving the overall model, the independent variables must increase its quality.
Beta is the expected change in the logarithm of odds of being a champion for a one unit increase in the corresponding predictor variable holding the other predictor variables constant at certain value. The beta is the regression coefficient which is the relationship between the independent variables and the dependent variable. It describes how much the dependent variable changes in a one-unit change in the independent variable. Exp (B) is the exponent of the beta and simply is the odds ratio. Negative beta describes that the event is more unlikely to occur, and positive beta describes that the event is more likely to occur.
4.2
Grey Relational Analysis
4.2.1 Initial step
Table 5 shows the average of the financial variables in each hockey club over the sample period. As Table 5 describes, the financial variables varies among the teams in the sample. The values for the profitability variables, more specifically Operating profit and Net profit show a high difference among the clubs, where a majority of the clubs show a negative result. The club with the most optimal value is Skellefteå AIK for Operating profit and Växjö Lakers for Net profit. Closely connected to these variables is Net sales, where instead Frölunda HC has the highest average value, 131 909 TSEK.
In terms of assets, the two variables Total assets and Current assets show that Frölunda HC once again is on top for the first variable of these two. For the second one, HV71 has the highest amount of current assets. In terms of the liability variables, more specifically Total liabilities and Current liabilities, the focus is rather on which team that has the lowest amount than the highest, which is referred to as aim in Table 1. The clubs with the
26
lowest values are now AIK and Örebro HK for the two variables respectively. Lastly, in regard to Equity, HV71 is once again a club with the highest value for this variable.
Table 5
Financial variables outcome (Thousands SEK)
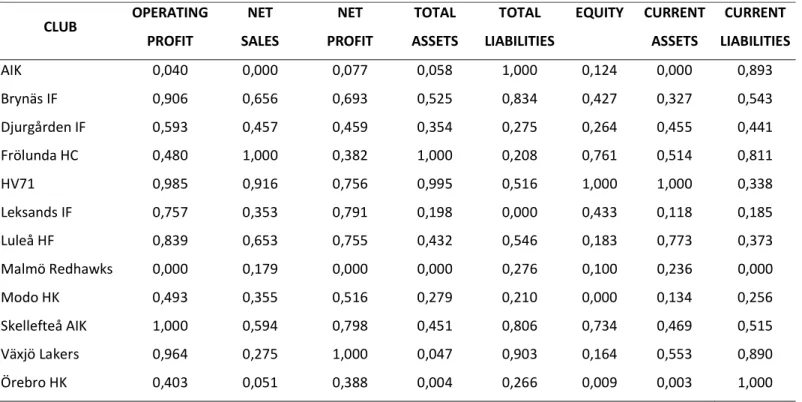
4.2.2 Normalisation step
The GRA process is followed by a normalisation process shown in Table 6 and a deviation sequence shown in Table 7 in order to make the financial variables computable for the Grey relational Coefficient, which is the last step to determine the overall grade and ranking in terms of financial health.
Table 6 shows the normalisation of the variables from Table 5. The normalisation step is used in order to put the extreme positive or negative values into the span between 0 and
CLUB OPERATING PROFIT NET SALES NET PROFIT TOTAL ASSETS TOTAL LIABILITIES EQUITY CURRENT ASSETS CURRENT LIABILITIES AIK -7 365 47 553 -7 226 46 033 17 111 6 201 8 660 14 620 Brynäs IF 324 102 904 315 115 735 19 319 15 999 16 290 19 319 Djurgården IF -2 454 86 120 -2 543 90 215 26 758 10 728 19 278 20 683 Frölunda HC -3 458 131 909 -3 496 186 684 27 641 26 795 20 642 15 723 HV71 1 026 124 822 1 084 185 864 23 546 34 539 31 978 22 068 Leksands IF -998 77 337 1 516 66 843 30 408 16 194 11 423 24 121 Luleå HF -265 102 668 1 069 101 814 23 153 8 098 26 680 21 599 Malmö Redhawks -7 724 62 657 -8 163 37 337 26 734 5 427 14 156 26 605 Modo HK -3 338 77 537 -1 854 78 952 27 617 2 192 11 777 23 163 Skellefteå AIK 1 163 97 627 1 600 104 680 19 696 25 937 19 595 19 696 Växjö Lakers 839 70 746 4 069 44 333 18 399 7 483 21 559 14 659 Örebro HK -4 142 51 859 -3 423 37 888 26 873 2 470 8 738 13 185
27
1. The outcome from Table 6 shows the same output as in Table 5, in a different format. This implies that e.g. for the variable Operating profit, the outcome from Table 5 shows that Skellefteå AIK has the most optimal value of 1 163 TSEK which therefore is equal to 1.000 in Table 6 as a maximum value of all the possible clubs for this particular variable. On the other end, Malmö Redhawks shows the least optimal value of -7 724 TSEK for Operating profit, which in Table 6 is equal to 0.000 and therefore is the minimum value of all the outcomes of the clubs. The same process is continued for every club and variable in the sample.
Table 6 Normalisation step
4.2.3 Deviation sequence
The deviation sequence presents in Table 7 below. This process reveals the distance from the most optimal value to the actual value for each club in the sample. It means that e.g. if Operating profit is used as a showcase once again, Skellefteå AIK shows the value of
CLUB OPERATING PROFIT NET SALES NET PROFIT TOTAL ASSETS TOTAL LIABILITIES EQUITY CURRENT ASSETS CURRENT LIABILITIES AIK 0,040 0,000 0,077 0,058 1,000 0,124 0,000 0,893 Brynäs IF 0,906 0,656 0,693 0,525 0,834 0,427 0,327 0,543 Djurgården IF 0,593 0,457 0,459 0,354 0,275 0,264 0,455 0,441 Frölunda HC 0,480 1,000 0,382 1,000 0,208 0,761 0,514 0,811 HV71 0,985 0,916 0,756 0,995 0,516 1,000 1,000 0,338 Leksands IF 0,757 0,353 0,791 0,198 0,000 0,433 0,118 0,185 Luleå HF 0,839 0,653 0,755 0,432 0,546 0,183 0,773 0,373 Malmö Redhawks 0,000 0,179 0,000 0,000 0,276 0,100 0,236 0,000 Modo HK 0,493 0,355 0,516 0,279 0,210 0,000 0,134 0,256 Skellefteå AIK 1,000 0,594 0,798 0,451 0,806 0,734 0,469 0,515 Växjö Lakers 0,964 0,275 1,000 0,047 0,903 0,164 0,553 0,890 Örebro HK 0,403 0,051 0,388 0,004 0,266 0,009 0,003 1,000
28
0.000 and AIK instead the value of 1.000 in Table 7. Therefore, the distance for Skellefteå AIK to the maximum value of all the outcomes of the clubs is 0 and for AIK it is 1, which is the maximum possible distance. This then goes for all other financial ratios in Table 6 similar to what was stated for Table 6.
Table 7 Deviation sequence
4.2.4 Grey Relational Coefficient
Grey Relational Coefficient is calculated, according to Eq. (5), for each variable between each club and presented in Table 8 below. For each financial variable, one club has the value of 1.000, which means that this club is the most optimal one and based on that, the rest of the clubs will follow with a variable all the way down to the one with the lowest value to be the least optimal club based on the certain financial variable.
CLUB OPERATING PROFIT NET SALES NET PROFIT TOTAL ASSETS TOTAL LIABILITIES EQUITY CURRENT ASSETS CURRENT LIABILITIES AIK 0,960 1,000 0,923 0,942 0,000 0,876 1,000 0,107 Brynäs IF 0,094 0,344 0,307 0,475 0,166 0,573 0,673 0,457 Djurgården IF 0,407 0,543 0,541 0,646 0,725 0,736 0,545 0,559 Frölunda HC 0,520 0,000 0,618 0,000 0,792 0,239 0,486 0,189 HV71 0,015 0,084 0,244 0,005 0,484 0,000 0,000 0,662 Leksands IF 0,243 0,647 0,209 0,802 1,000 0,567 0,882 0,815 Luleå HF 0,161 0,347 0,245 0,568 0,454 0,817 0,227 0,627 Malmö Redhawks 1,000 0,821 1,000 1,000 0,724 0,900 0,764 1,000 Modo HK 0,507 0,645 0,484 0,721 0,790 1,000 0,866 0,744 Skellefteå AIK 0,000 0,406 0,202 0,549 0,194 0,266 0,531 0,485 Växjö Lakers 0,036 0,725 0,000 0,953 0,097 0,836 0,447 0,110 Örebro HK 0,597 0,949 0,612 0,996 0,734 0,991 0,997 0,000
29 Table 8
Grey Relational Coefficient
4.2.5 Financial rankings
As a final step of the GRA process, a ranking for each club and ratio is conducted and presented in Table 9 below on the basis of the Grey Relational Coefficient presented in Table 8.
As can be seen in Table 9, a ranking between 1-12 has been set for all clubs in each variable. Then, an overall ranking on the average of all the rankings combined together. The table shows that HV71 has the most optimal financial health. This is followed by Skellefteå AIK, Brynäs IF, Växjö Lakers, Luleå HF, Frölunda HC, Djurgården IF, Leksands IF, AIK, Modo HK, Örebro HK and lastly Malmö Redhawks.
CLUB OPERATING PROFIT NET SALES NET PROFIT TOTAL ASSETS TOTAL LIABILITIES EQUITY CURRENT ASSETS CURRENT LIABILITIES AIK 0,343 0,333 0,351 0,347 1,000 0,363 0,333 0,824 Brynäs IF 0,841 0,593 0,620 0,513 0,751 0,466 0,426 0,522 Djurgården IF 0,551 0,479 0,481 0,436 0,408 0,404 0,479 0,472 Frölunda HC 0,490 1,000 0,447 1,000 0,387 0,676 0,507 0,726 HV71 0,970 0,856 0,672 0,989 0,508 1,000 1,000 0,430 Leksands IF 0,673 0,436 0,705 0,384 0,333 0,469 0,362 0,380 Luleå HF 0,757 0,591 0,671 0,468 0,524 0,380 0,688 0,444 Malmö Redhawks 0,333 0,379 0,333 0,333 0,409 0,357 0,395 0,333 Modo HK 0,497 0,437 0,508 0,409 0,388 0,333 0,366 0,402 Skellefteå AIK 1,000 0,552 0,712 0,477 0,720 0,653 0,485 0,508 Växjö Lakers 0,932 0,408 1,000 0,344 0,838 0,374 0,528 0,820 Örebro HK 0,456 0,345 0,449 0,334 0,405 0,335 0,334 1,000
30 Table 9
Rankings for each club and variable
CLUB OPERATING PROFIT NET SALES NET PROFIT TOTAL ASSETS TOTAL LIABILITIES EQUITY CURRENT ASSETS CURRENT LIABILITIES OVERALL AIK 11 12 11 9 1 9 12 2 9 Brynäs IF 4 3 6 3 3 5 7 5 3 Djurgården IF 7 6 8 6 8 6 6 7 7 Frölunda HC 9 1 10 1 11 2 4 4 6 HV71 2 2 4 2 6 1 1 9 1 Leksands IF 6 8 3 8 12 4 10 11 8 Luleå HF 5 4 5 5 5 7 2 8 5 Malmö Redhawks 12 10 12 12 7 10 8 12 12 Modo HK 8 7 7 7 10 12 9 10 10 Skellefteå AIK 1 5 2 4 4 3 5 6 2 Växjö Lakers 3 9 1 10 2 8 3 3 4 Örebro HK 10 11 9 11 9 11 11 1 11
31
5
Analysis
In this chapter of the study, the results are analysed and further discussed in relation to the current research. Similar to the structure of the results section, this section constitutes a section which focuses on the Logistic Regression model followed by another section which focuses on the Grey Relational Analysis. The entire chapter ends with final remarks and a description of the limitations of the models.
5.1
Logistic Regression model
It is stated that neither Net sales nor Net profit has a major impact on sport success, according to what is presented in Table 4. It does however show the direction which these factors do affect the sport success, which is positive, because both of these variables have positive beta values. The non-financial aspects do not contribute to the sport success in a great way; however they do describe other perspectives in the operation of a hockey club which are required to be further analysed.
5.1.1 Underlying factors to Net sales and Net profit
Increasing the amount of net sales, gives the organisation a higher amount of capital to use in the operation and increase the probability to meet its objectives but more importantly, cover its costs (Simmons, 1967). The amount of net sales becomes less significant if the organisation does not use the capital effectively (Schmidgall & DeFranco, 2016). Sport organisations are however different from other, more original businesses, which seek profit maximization and give back to its shareholders. (Pinnuck & Potter, 2006). The organisations in this sample are operated in different associations, where a majority have been non-profit organisations, and several still are. In recent years it is a trend that several organisations develop to become a limited liability, where profit maximisation has become an aspect of more importance. Some of the clubs may act rather opportunistic in order to seek success in their businesses. This is proven in the data collection that net income differs in high degree, both positive and negative values.
32
To become a champion, which of course is the greatest objectives for these clubs, the amount of revenue and further profitability, is as described the most important aspect in order to explain the sport outcome. Profitability does not only affect the sport success on the ice hockey rink, it also contributes to the future financial success. Less capital leads to decreased probability to gain new and better players, but also and more importantly reduce the willingness from investors to invest capital into the club. An organisation that makes a loss every season decreases its financial health in a long-term perspective (Barajas et al., 2005). Clubs have in a way put this in a system to have higher player budget than the finances allow. The priorities in these clubs have been to get the most powerful team regardless of costs. This is not a solid approach when seeking sport success, based on what is disclosed in this study.
Several organisations in the sample make losses nearly every year, even though profit has to be prioritized. A main reason for these losses for several clubs is that unexpected costs occur during a couple of seasons. With this in mind, a majority of these clubs does act too opportunistic and therefore sign expensive contracts with players and have been eliminated early or not even qualified for the play-offs. Playing in the play-off is very important for the clubs since the participation leads to a greater amount of games played at the home arena, which leads to a greater amount of short-term revenue, but also get more attention, which in the long-run attracts more sponsors. This is also one explanation why some clubs act more opportunistic. According to Barajas et al. (2005) as well as Ecer & Boyukaslan (2014) this is a fact which likewise is certainly connected to the football industry, where the opportunistic financial behaviour in clubs is considered even more distinct.
Profitability increases the financial performance in the clubs, which increase the financial resources in future years which will make the probability to attract better players even higher (Szymanski & Kuypers, 1999). Better performance on the pitch increases the amount of financial resources in the organisation (Pinnuck & Potter, 2006). It is however important to keep a sound relation between financial health and investment in players, with the connection to other aspects which may affect the sport performance, such as physical and mental health of the players. This study shows that some clubs do not have a stable financial health and therefore make losses in several years, e.g. Malmö
33
Redhawks. The overall financial health of the clubs playing the Swedish Hockey League is considered not as optimal as it could be and therefore has room for improvement. To be able to make a profit, the organisation is required to get income from its business (Simmons, 1967). The core income in a sport organisation is revenue from tickets sold to the games and sponsorship from companies that will be a partner to the club. In recent years, the media rights have become an important source of income to the clubs. It consists of almost half of the total revenue in each club (EY, 2018). These TV-rights have been around 29 million SEK to each club playing in SHL in recent seasons. From the season 2018/2019 SHL has negotiated a new agreement about the media rights, which will give each team around 45 million SEK. From one season to another the income from media rights will increase around 15 million SEK. This is of course very important and will make a difference to the overall financial health of the clubs.
Each individual club in SHL has different ways to increase the income from its audience, such as shops with merchandise etc. This is similar to how clubs in other leagues and sports operate, such as the Australian Football League (AFL), where the attendance decides the short-term as well as long-term sport success (Pinnuck & Potter, 2006). The main aspect is the audience rate and if the club owns its stadium or not. Frölunda HC is the club that attracts most people at average each season during the sample. It has fluctuated during the years, but they have had an average of 10 000 people at its home games. Thanks to this high audience rate Frölunda HC has the highest revenue from tickets and other revenues related to home games.
In the sample, half of all clubs; AIK, Djurgården IF, Frölunda HC, Malmö Redhawks, Skellefteå AIK and Örebro HK do not own the stadium they play in. Another aspect to consider is that the rent for playing in the arena differs among these clubs. Frölunda HC pays the highest rent about 15 million SEK, Djurgården IF about 5 million SEK and Skellefteå AIK pays around 6 million SEK. In regard to the remaining clubs, there is no information about rent costs.