University of Kalmar
Title: Role of Different Carbon
Sources for Growth, Production and
Community Composition of
Bacterio-plankton
Author: Markus Lindh
Degree project work in Biology or Environmental Science
No: 6355
Degree project works made at the University of Kalmar, School of Pure and Applied Natural Sciences,
can be ordered from:
www.hik.se/student
or
University of Kalmar
School of Pure and Applied Natural Sciences
SE-391 82 KALMAR
SWEDEN
Phone + 46 480-44 73 00
Fax + 46 480-44 73 05
e-mail:
info@bom.hik.se
Role of Different Carbon Sources for Growth, Production and
Community Composition of Bacterioplankton
Markus Lindh, Biology 240hp
Degree Project Work, 30hp for Master of Science
Supervisor: Assistant Professor, Jarone Pinhassi
School of Pure and Applied Natural Sciences
Kalmar University
Examiner: Professor, Åke Hagström
School of Pure and Applied Natural Sciences
Kalmar University
ABSTRACT
It has been suggested that growth, production and community structure of bacterioplankton are dependent on resource availability. However, previous studies have only investigated the effect of either organic substrate mixtures or a few sin-gle organic substrates on the bacterioplankton community. The aims of this study were to investigate the impact of five different relevant carbon sources on the bacterioplankton community. This impact was evaluated comparing treatments on samples taken from Skagerrak and the Baltic Sea, in whole seawater cultures. Analysis of bacterial abundance, bacte-rial production (as Leucine incorporation), bacterioplankton DNA community structure and colony-forming bacteria grow-ing on agar plates were evaluated. Differences between carbon sources in terms of bacterial numbers were relatively small, with strong growth responses for L-amino acids, glucose, acetate and pyruvate with the only exception of glycolate, where growth was lower. Bacterial production, on the other hand, presented marked differences, different patterns for each carbon source, especially in the Baltic Seawater. Furthermore, differences in colony size and number of colony-forming bacteria in the different treatments were important. The analysis of DNA community from each experiment, by denaturing gradient gel electrophoresis (DGGE) analysis of PCR-amplified 16S rDNA, allowed a visualization of the mi-crobial community structure. Sequencing of the stronger bands on the gel revealed the identity of the dominant bacterial species. In terms of bacterioplankton community structure, differences between carbon sources and between environ-ments were important. One unknown species belonging to γ-proteobacteria was both unique and dominant for glucose treatment in the Baltic experiment. Another γ-proteobacteria, a Vibrio was found to specialize in glucose in the Skagerrak experiment. One uncultured bacterium belonging to α-proteobacteria, both unique and dominant was found in glycolate, also this in Skagerrak, another uncultured α-proteobacteria was clearly dominant for glucose treatment in Skagerrak. Some bands were also present in most treatments, e.g. uncultured species belonging to bacteroidetes in Skagerrak and β-proteobacteria in Baltic, suggesting that those species are not specialized in consuming a single carbon source. As a conclusion different carbon sources clearly had an individual but important role for bacterioplankton properties. The prop-erties also showed to be dependent on the environment.
Studier har visat att marina bakteriers tillväxt, produktion och samhälle är beroende av näringstillgången. Men dessa stu-dier har endast undersökt effekten av antingen en organisk substratblandning eller ett par organiska substrat på bakterie-samhället. Målet med denna studie var att undersöka effekten av fem olika men viktiga kolkällor på bakteriebakterie-samhället. Effekten jämfördes mellan kolkällorna från vattenprov tagna i Östersjön och Skagerrak, i helvattenkulturer. Bakterieantal, bakterieproduktion, DNA från bakteriesamhället samt kolonibildande bakterier på agarplattor analyserades. Skillnader i bakterieantal mellan olika kolkällor var relativt små, L-aminosyror, glukos, acetat och pyruvat gav en stark respons, enda undantaget var glykolat som hade låg tillväxt. Skillnader i bakterieproduktion mellan kolkällorna var däremot större, varje kolkälla gav en specifik respons, speciellt märkbart i Östersjöexperimentet. Skillnader i kolonistorlek och antal kolonibil-dande bakterier mellan kolkällor var också viktiga. DNA analyser med Denaturing Gradient Gel Electrophortesis (DGGE), gav möjligheten att se bakteriesamhällets uppbyggnad. Sekvensering av de starkare banden i gelen gav identitet till de dominanta arterna. Skillnader i bakteriesamhället mellan olika kolkällor var tydliga. Samhället hade ungefär fyra olika do-minanta band. En art med okänd specifik tillhörighet, var närmast släkt med en γ-proteobakterie. Detta band var både unikt och dominant i glukosbehandlingen för Östersjöexperimentet. En annan γ-proteobakterie, en Vibrio hittades i glu-kosbehandlingen för Skagerrakexperimentet. En bakterie närmast släkt med en α-proteobakterie var både unik och domi-nant i glykolatbehandlingen, också den i Skagerrakexperimentet. Ytterligare en α-proteobakterie var domidomi-nant i glukosbe-handlingen i Skagerrakexperimentet. Somliga band fans även i samtliga eller flera av behandlingarna, t.ex. en okänd bak-teroidetes i Skagerrakexperimentet och en β-proteobakterie i Östersjöexperimentet. Dessa arter verkar inte vara speciali-serade på en specifik kolkälla. Som en slutsats har olika kolkällor en viktig men individuell effekt för marina bakteriers
INTRODUCTION
What is the unique role of bacteria in the sea? The degradation of dissolved organic matter (DOM). From the perspective of single bacteria, consump-tion of reduced organic carbon is important from many aspects. The two most important are to gen-erate energy and building blocks for the cell itself. As a result and as product of evolution, different species have different metabolic pathways, and different species take up different carbon sources with many different mechanisms. If species have this variety of metabolic pathways and uptake mechanisms, then what are the effects on bacte-rioplankton, when subjected to a variable resource supply?
It has been shown that the concentration of spe-cific carbon sources vary depending on season and depth. The glucose concentration is shown to vary depending on location, season and on natural phenomena like El niño, (Rich et al. 1996). Accord-ing to Ho et al. 2002, acetate also varies, partly depending on depth and partly on season. Suttle et al. 1991 showed that amino acids are another carbon source that varies seasonally. These stud-ies clearly show that carbon sources vary both on temporal and spatial scales, in other words, the concentration of resources and indirectly the bac-terial use of them is a variable factor.
Since resources vary on temporal and spatial scales, how does this affect the composition of bacterial communities? Is one specific species specialized in a given resource? Marine bacterio-plankton can be divided into two groups, those which specialize in resources with high molecular weight and those who specialize in low molecular weight, (Covert & Moran 2001). The response of bacteria to high molecular weight resource is de-scribed by Pinhassi et al. 1999. When adding pro-tein to mesocosms, some bacterial species, e.g.
Polaribacter irgensii and Psychroserpens burto-nensis, belonging to the Cytophaga group,
re-sponded in both growth and community structure. In another study researchers radioactively labelled a protein and followed its course, and made the observation that certain species of Cytophaga, are better than others in degrading and assimilating proteins, (Cottrell & Kirchman 2000). Based on these studies it is clear that at least some bacteria are specialized in either low molecular weight or high molecular weight carbon sources.
There is also a possibility to look at one or two organic substrates or a mixture of organic sub-strates. In environments rich in nitrogen (N),
phosphorus (P) and dissolved organic matter (DOM), Eilers et al. 2000 observed that substrate addition, (a mix of monomers such as L-aspartate, sugars such as glucose, acids like acetate and alcohols like ethanol) provided high growth re-sponses of Vibrio species, whereas Alteromonas species provided low growth responses. Similar studies with the opposite environments (with much less nutrients), Pinhassi & Berman (2003) gave insight that e.g. Vibrio and Shewanella belonging to γ-proteobacteria, actually have a selective ad-vantage toward easily assimilated carbon sources and inorganic nutrients, whereas Roseobacter and
Sphingomonas, both α-proteobacteria are clearly
more dominant at low nutrient concentrations. Moreover, it has been shown that different species of estuarine bacterioplankton specialize in different complex DOM sources, (Covert & Moran 2001, Kisand et al. 2002). All studies mentioned above, have in one way or another investigated the effect on bacterioplankton properties, on growth, produc-tion and the community composiproduc-tion In experi-ments where the substrate was a mixture of sev-eral organic carbon sources, or a few single or-ganic carbon sources.
However, to my knowledge, no studies have been made on the difference between individual sub-strates. If the effects on bacterioplankton proper-ties are different between individual substrates, could a species be specialized in e.g. glucose rather than L-amino acids, or acetate rather than glycolate? Could properties such as the life-style of a microbial ecosystem be derived, simply by look-ing at the present carbon sources? In this study, the role of different bacteria in the processing of central carbon sources was investigated. Seawater cultures were subjected to manipulated resources. The carbon sources were acetate (CH3COO-),
glucose (C6H12O6), pyruvate (CH3COCO2H),
glyco-late (C2H4O3) and L-amino acids (H2NCHRCOOH,
were R is an organic substituent). These carbon sources have a proven importance for the growth of bacteria. The carbon sources are a part of the natural marine environment, and compose an im-portant fraction of the DOM in the environment. The inorganic nutrients (N and P) were also used. To compare the community structure response of bacteria, the experiments were initiated by adding substrates shortly after in situ sampling. As a com-parison, experiments were partly directed to the Baltic Sea and to the Skagerrak. Bacterial abun-dance and production have been measured during growth, to observe the growth response and pro-duction. When bacterial numbers and production reached the highest values, and at the end of each
experiment, samples were collected for community DNA and for isolation of the dominant colony form-ing bacteria.
DNA phylogeny
All genomes are more or less different, however there are a few constituents present in all ge-nomes of all organisms. One example is the 16S rRNA gene, which is highly conserved in order to preserve its crucial function, namely protein manu-facturing. The gene is especially suited for deter-mining genetic relationships, since the gene has highly conserved regions and variable regions. By looking at the variable regions one can see how closely related any two species are, how they have evolved and most important, since there are sev-eral databases available with genomic data, one can determine the identity of the organism. The method is important for deriving representative sequences for a given environment, and for look-ing at the diversity of any given group of microor-ganisms. Hence, the phylogenetic analysis based on the 16S rRNA gene is a basic and fundamental step for understanding the microbial ecosystem as a whole.
MATERIALS & METHODS
In situ sampling
Seawater from the Baltic Sea and the Skagerrak was collected in this study. Baltic seawater was collected at Kalmarsund (56,68° N, 16,41° E) on the 17th of September, 8thof October and 27thof November for experiments BAL 1, BAL 2, and BAL 3, respectively. Skagerrak seawater was collected from the Kristineberg Marine Research Station (58,15° N, 11,26° E) on the 6thof November for the SKA experiment. For all experiments except BAL 1, surface seawater was prefiltered through a 150 µm mesh net (to remove larger particles) into a 25 l polycarbonate bottle (Nalgene).
Carbon source availability experiments
In order to identify selection of heterotrophic bacte-rial species due to carbon source availability, dif-ferent carbon sources were added to whole sea-water cultures. Duplicate enriched cultures of 1,5 l received a final concentration of 20 µM carbon in the form of acetate, glucose, glycolate, L-amino acids and pyruvate, respectively. A total of 6 µM N (NH4Cl) and 0.6 µM P (Na2HPO4) were added to
all cultures to avoid inorganic nutrient limitation. Duplicate control cultures received no addition of carbon sources. Seawater cultures were main-tained in the dark at 5˚C above in situ tempera-tures (to speed up growth), except for BAL 1
(20˚C, actual in situ temperature). BAL 2 (17˚C), BAL 3 (15˚C) and SKA (15˚C).
For collection of microbial community DNA, 750 ml aliquots of whole seawater cultures were filtered through a 0.2 µm pore-size polycarbonate filter at <200 mm Hg to collect bacterial cells. Community DNA was collected after the highest values for production and abundance were reached for each experiment, (approximately 48 hours for BAL 1, 2 and SKA, 72 hours for BAL 3). And also after 5 days in BAL 3 and SKA experi-ment, when cultures had decreased in bacterial numbers and levelled out. Filters were immediately frozen at –80°C in TE buffer (10 mM Tris, 1 mM EDTA, pH 8.0) until further processing.
Diversity analysis
Extraction of microbial community DNA was performed using a combined treatment with en-zymes (lysozyme, proteinase K) and phenolchloro-form as described in Riemann et al. 2000. DNA was re-suspended in TE buffer and quantified fluorometrically (PicoGreen; Molecular Probes). Bacterial 16S rDNA was amplified by PCR using a bacterial primer complementary to position 341-358 with a 40 bp GC-clamp (GC341F, (Muyzer et al. 1993) and a universal primer complementary to position 907-927 (907RM, (Muyzer et al. 1998). A PCR kit from GE healthcare (Illustra Ready To Go Beads TM), complemented with Taq polymerase,
dNTPs, and PCR buffer and primers (10 pmol/µl final concentration) was used. Also sterile Milli-Q water was added to reach a 25µl PCR reaction. In general 1 µl of DNA template from the DNA extrac-tions were added, with the exception of DNA ex-tractions with low DNA concentration, where a larger volume, up to 4 µl, was added. Initial dena-turation was at 95°C for 2 min followed by a ther-mal cycling program as follows: denaturation for 30 sec at 94°C; annealing for 30 sec at an initial 63°C, decreasing 1°C every two cycles to a final of 53°C, extension for 90 sec at 72°C. Ten cycles were run at 53ºC for a total of 30 cycles followed by final 7 min incubation at 72°C. As a comparison, another set of primers were tested on four samples, prim-ers 1401r and 968f according to (Felske et al. 1996). PCR products were loaded on a 1% aga-rose gel, with a resolution range of linear DNA fragments from 10 kb-0,5 kb to assess the quality of the products. PCR products were quantified fluorometrically with PicoGreen.
Denaturing Gradient Gel Electrophoresis (DGGE) is an important method to assess the microbial community structure. DGGE was per-formed with protocol according to Schauer et al. 2003. PCR products of 60 ng were loaded on a 6% polyacrylamide gel with a DNA-denaturant gradient ranging from 29 to 52%. The gel was run using the D Gene System (Bio-Rad) at 60°C for 6 h at 150 V in 1x TAE (40 mM Tris [pH = 7.4]. DGGE bands were excised using a sterile razor blade and eluted in 20 µl of MilliQ water overnight at 4°C, followed by a freeze-thaw cycle. A total of 1 µl of the eluate was used for reamplification with the original primer set. A part of the PCR product was ana-lyzed by DGGE together with the original sample to verify the correct position of the band. PCR products were purified with the QIAquick PCRPuri-fication Kit (QIAGEN) and quantified fluorometri-cally (PicoGreen; Molecular Probes) and subse-quently sent for sequencing at Macrogen. Sequence identity was determined through BLAST (nucleotide - BLASTn), (Gibson, Muse. 2004). If only species with unknown specific affilia-tion were the closest relatives, a search term was included (bacteria[ORGN] AND sp nov[WORD]) to find the closest cultured relatives. Finally a phy-logenetic tree based on the sequences were cre-ated, using TreeCon software and BioEdit se-quence alignment.
Study of colony forming bacteria
In order to isolate and evaluate the number of col-ony forming bacteria in situ and the ones selected in our cultures, samples of seawater were cultured on agar plates. For the in situ colony-forming bac-teria, 100 µl samples were spread on Zobell agar plates at 1:1, 1:10 and 1:100 dilutions. To identify and quantify colony-forming bacteria growing in the culture experiments, samples were collected when the highest abundance and production levels were reached (day 2 for BAL 1, 2 and SKA, day 3 for BAL 3), and at the end of BAL 3 and SKA ex-periments. For each culture bottle, 100 µl samples were spread on Zobell agar plates at 1:10, 1:100 and 1:1000 dilutions. For bacterial isolation, colo-nies were picked, re-streaked and incubated on Zobell agar plates and then in liquid rich medium (Marine Broth). Isolates were preserved by adding glycerol 25%final concentration) and stored at -80°C. To discard any contamination in the isolation process, a sample of each isolate was spread on plates after growth on Marine Broth. Photographs of the plates were taken and used for colony mor-phology and CFU ml-1 comparison.
Bacterial enumeration
Daily samples for bacterial enumeration by epif-luorescence microscopy were fixated with para-formaldehyde (PFA), (3,7% final concentration), and subsequently stained in the dark for 10 min-utes with SYBR Gold, for epifluorescence micros-copy count, 20 cells/square was counted. The measurements were used to evaluate when each experiment reached the highest abundance. Samples for enumeration of bacteria by flow cy-tometry were preserved daily with PFA (1% final concentration) and glutaraldehyde (0,05% final concentration).Samples were stored in -80°C freezer until analysis. Flow cytometer protocol according to Gasol and del Giorgio, 2000. Upon analysis, samples were stained with Syto13 (5 µM final concentration) and incubated in the dark for 20 minutes. The samples were then processed in a FACSCalibur flow cytometer. Beads (BD Tru-countTM Tubes) were used as reference (standard)
and Milli-Q as sheath fluid. The measurements were used to construct growth curves, (see re-sults).
Bacterial production
Bacterial production in the cultures were measured daily through [3H]-leucine incorporation. Protocol
according to Kirchman et al. 1985 and simplified by Smith, Azam, 1992. The analysis was per-formed with a liquid scintillator.
RESULTS
Bacterial abundance and production
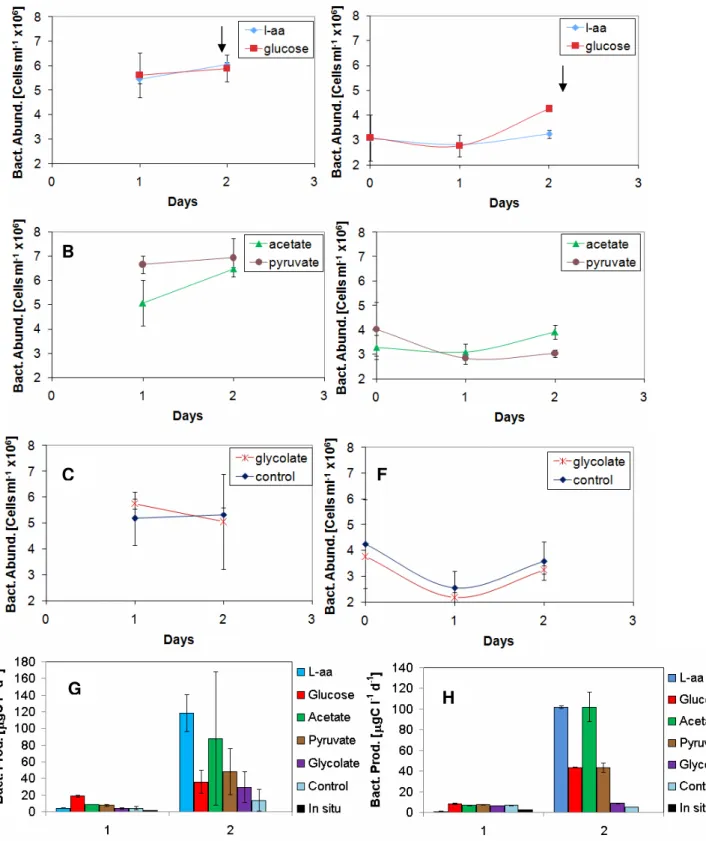
Bacterial numbers were derived from flow cytome-ter data. In the first two Baltic experiments the abundance were relatively constant in all treat-ments during day 1 and 2, (Fig. 1.A-F) and the highest values were reached on day 2. In BAL 1 about 6 x10⁶cells ml-1 were reached and approxi-mately 3x10⁶cells ml-1 in BAL 2. However,
bacte-rial production in both experiments showed a dif-ferential response within the tested carbon source additions (Fig. 1.G-H) where the highest values were reached on day 2. In BAL 1 L-amino acids presented the highest production of about 120 µgC l-1 d-1, followed by acetate 80 µgC l-1 d-1, pyruvate
provided 50 µgC l-1 d-1, glycolate and glucose were
close together with 30 µgC l-1 d-1 and control
pre-sented values of approximately 10 µgC l-1 d-1. In
BAL 2 the main features of bacterial production were different from BAL 1. In this second experi-ment, L-amino acids and acetate presented the highest values of 100 µgC l-1 d-1, then glucose and
pyruvate group together at 40 µgC l-1 d-1 and fi-nally, glycolate was close to control, at about 10 µgC l-1 d-1.
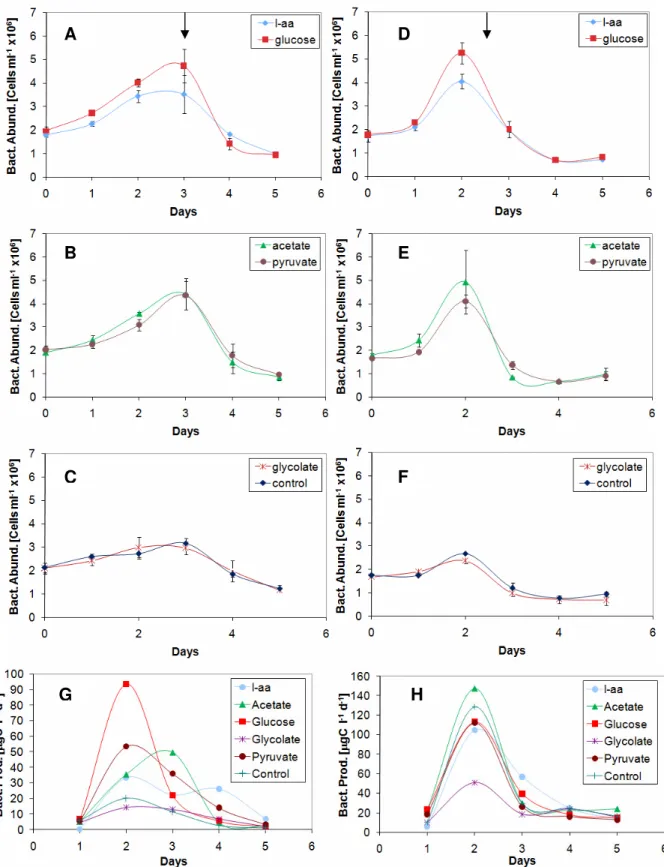
In BAL 3, bacterial numbers for all treatments reached highest values on day 3 (Fig. 2.A-C). All treatments reached about 4-5 x10⁶cells ml-1, ex-cept for glycolate and control that reached 3 x10⁶ cells ml-1. Bacterial production in BAL 3 presented
similar differences between carbon sources as the production in BAL 1 and 2 experiments. Glucose present the highest production level of about 90 µgC l-1 d-1, followed by acetate and pyruvate 50 µgC l-1 d-1. L-amino acids lay around 30 µgC l-1 d-1, interestingly with two peaks on day 2 and day 4. Glycolate was close to control with 20 µgC l-1 d-1. All carbon sources showed an increase in bacterial production until day 2, when the highest values were reached, except for acetate with its peak in production closer to day 3. Production decreased until day 5. The, highest levels of production in all treatments were reached before the peak in growth.
Bacterial abundances in SKA increased until day 2, and then decreased until day 5 (Fig. 2.D-F). Acetate and glucose reached the highest abun-dance of about 5x10⁶cells ml-1, L-amino acids and
pyruvate reached about 4x10⁶ cells ml-1 and gly-colate was close to control, about 3x10⁶cells ml-1. All carbon sources except glycolate had their high-est production values on day 2 with approximately the same level. Acetate reached about 140 µgC l-1
d-1, followed by L-amino acids with 130 µgC l-1 d-1. Glucose and pyruvate have the same peak at 110 µgC l-1 d-1. The control also reached high produc-tion levels around 110 µgC l-1 d-1. Finally the glyco-late treatment produced 50 µgC l-1 d-1.
Fig. 1. Bacterial abundance and production from BAL 1 (left) and BAL 2 (right) whole water experiments. A-F show growth curves, carbon source are indicated in upper right square. Day 0 is unavailable for BAL 1 as no measurements were taken. Arrows indicate when sampling for DNA community and growth on plates took place. G-H shows biomass production, carbon sources are indicated to the left of each diagram. Error bars indicate standard deviation.
G
H
C
F
Fig. 2. Bacterial abundance and production from BAL 3 (left) and SKA (right) whole water experiments. A-F show growth curves, carbon source is indicated in upper right square. Arrows indicate when sampling for DNA community and growth on plates took place. Error bars indicate standard deviation. G-H shows biomass production, carbon sources are indicated to the left of each diagram. Error bars for bacterial production in BAL 3 and SKA are not avail-able because only one set of duplicates were measured.
A
B
C
G
D
E
F
H
Study of colony-forming bacteria
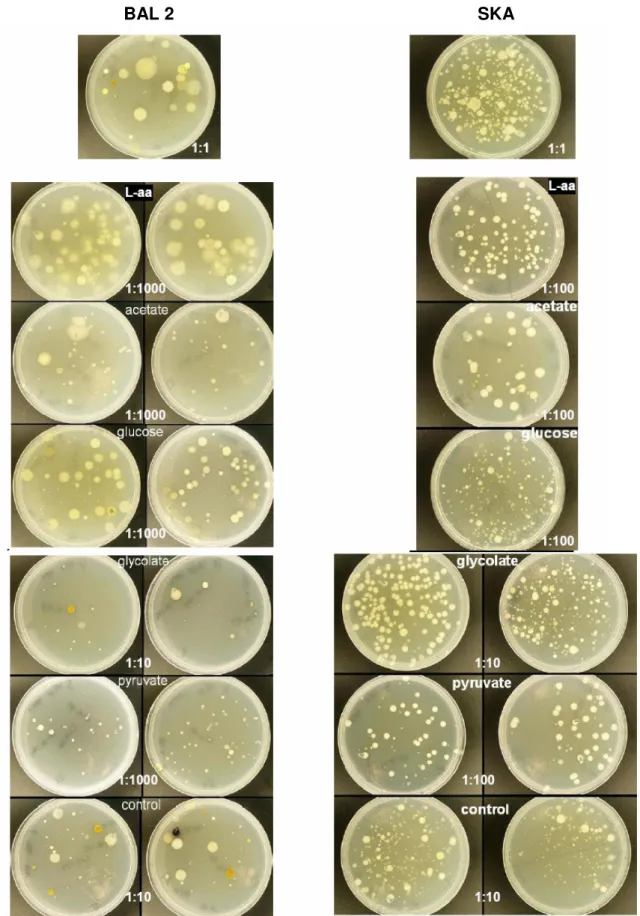
The visible morphologies and number of CFUs were analysed by growing samples on Zobell agar plates. The similarity between the experiments with Baltic whole water were high, with the main features remaining in all experiments, therefore data is only shown for BAL 2.
In experiment BAL 2, L-amino acids and glucose presented the largest amount and size of colonies (Fig. 3), while acetate, pyruvate and glycolate pre-sented relatively smaller colony amount and size. In the SKA experiment differences between carbon sources were not substantial. L-amino acids to-gether with acetate generally had large colonies, while glucose, pyruvate, glycolate and control had smaller colonies. The amount of colonies were less in acetate and pyruvate, and relatively similar between L-amino acids and glucose.
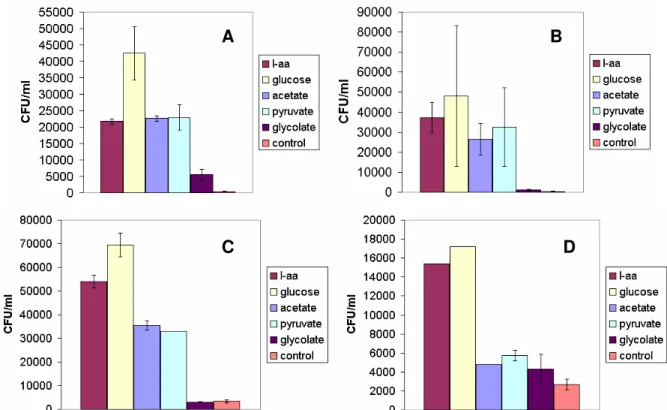
In experiments BAL 1 and 2 (Fig. 4.A and B), the CFU ml-1was relatively similar between
treat-ments, except for glycolate and control which pre-sent low CFU ml-1. Also, glucose, presented higher numbers, around 4 x10³CFU ml-1. L-amino acids,
acetate and pyruvate reached about 2 x10³CFU ml-1in BAL 1 and 3 x10³CFU ml-1 in BAL 2. Glyco-late and control had low numbers, close to 0. In BAL 3 (Fig. 4.C), CFU ml-1 measurements showed that glucose and L-amino acids presented the highest values, of about 7 x10⁴CFU ml-1 and
5.5 x10⁴CFU ml-1respectively, acetate and
pyru-vate grouped together at 3.5 x10⁴CFU ml-1, finally
glycolate and control presented 5 x10³CFU ml-1. In SKA, (Fig. 4.D) glucose had the highest values at 1.7 x10⁴CFU ml-1, followed by L-amino acids at
1.6 x10⁴CFU ml-1. Acetate, pyruvate, glycolate and control grouped together at 5 x10³CFU ml-1.
Fig. 3. Colony-forming bacteria from BAL 2, (left) and SKA, (right) whole water experiments. The two on the top are in
situ. Treatment and dilution are indicated for each duplicate. Duplicates for SKA L-amino acids, acetate and glucose
are unavailable.
Fig. 4. Colony forming units for whole water experiments BAL 1, (4.A) BAL 2, (4.B), BAL 3, (4.C), SKA, (4.D). Error bars indicate standard deviation. No error bars indicate that standard deviation was too low.
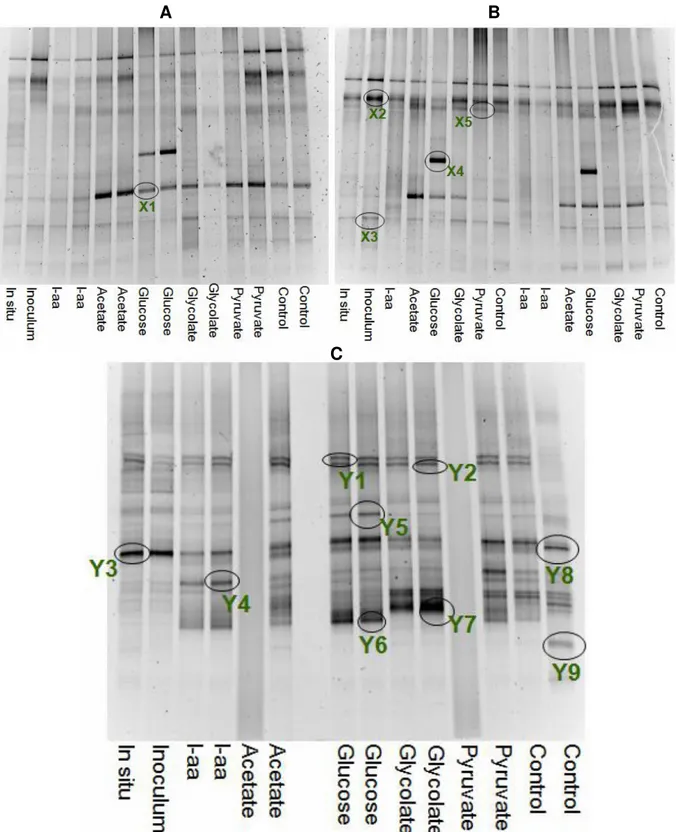
Community structure
The bacterial community structure in BAL 1 and BAL 2 experiments presented relatively similar patterns. The most prominent feature was the strong and unique band for glucose, X4, (Fig. 5.A and B). Sequence identity through BLAST, (Table 1) indicated that this band belongs to a
γ-proteobacteria, with unknown specific affiliation. The two bands at the top of the Baltic DGGEs, X2 and X5, present in most samples, had their closest relatives in uncultured Bacteroidetes. Band X1, corresponded to a β-proteobacteria, primarily found in acetate, glucose, glycolate and pyruvate. Finally, band X3 was present in all treatments ex-cept L-amino acids and corresponded to actino-bacteria. The BAL 3 experiment is not shown. The DNA analysis for this experiment could not be performed because lack of time.
Differences between carbon sources in the Skagerrak whole water experiment were also visi-ble, (Fig. 5.C). Several of the bands sequenced appeared to be present in all treatments. This was the case of bands Y1 and Y2, which belonged to Bacteroidetes, and Y3, which corresponded to an α-proteobacteria. Some bands were present only in some treatments, e.g. band Y5, primarily pre-sent in glucose and acetate, to which the closest
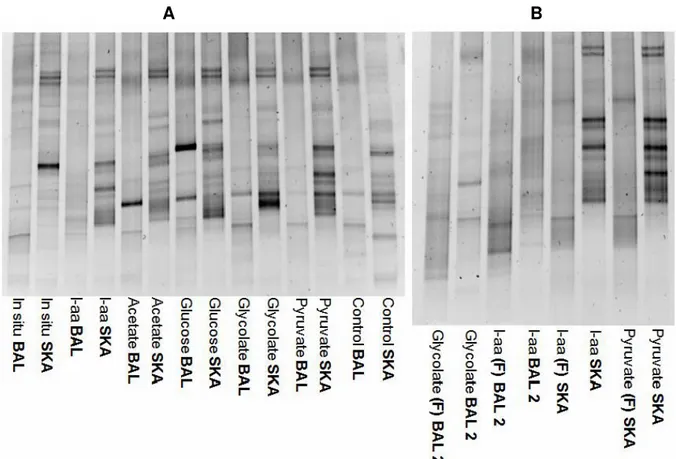
relative was Bacteroidetes. This was also the case of Y4 that was found in two of the treatments, L-amino acids and pyruvate, these corresponded to a α-proteobacteria. Finally, some other bands ap-peared to be present in only one of the treatments. This was the case of band Y8, present in control. Glycolate had a strong and unique band, Y7, which was a α-proteobacteria. Glucose also pre-sented a strong band, Y6, corresponding to a γ-proteobacteria, Vibrio sp. And a species of cyano-bacteria (band Y9) was only found in the control. Results also indicated differences in community structure between environments (Fig. 6.A). In order to test if the banding pattern was biased by the use of particular primers, a second primer set (Felske et.al, 1996) were applied (Fig. 6.B) to some of the samples (Baltic whole water and to Skagerrak whole water). There were two bands visible in L-amino acids, with the Felske primer set. Whereas with the original primer set there were no bands in this sample . In glycolate the patterning was different, but sequencing of the bands is needed to verify composition differences.
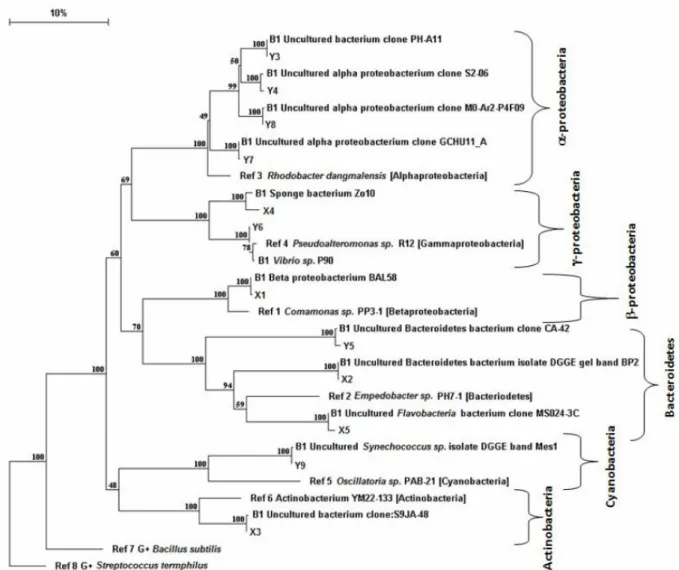
A phylogenetic tree was made, based on the 16S rRNA sequences, (Fig. 7).
A
B
Fig. 5. Community structure of whole water experiments, BAL 1, (5.A), BAL 2, (5.B) and SKA, (5.C). Treatment is indicated below each DGGE. Cut out bands are indicated with circle and name, (for identification of bands see table 1). Number of bands is a relative measurement of diversity and strength of bands represent the dominant species.
A
B
Fig. 6. Community structure comparison. 6.A comparison DGGE between BAL 2 and SKA experiment. 6.B compari-son DGGE of different primers used. Samples from BAL 2 whole water, and from SKA whole water, were amplified with the original set of primers (907r and GC341f), and with primer set used by (Felske et al. 1996) indicated with (F).
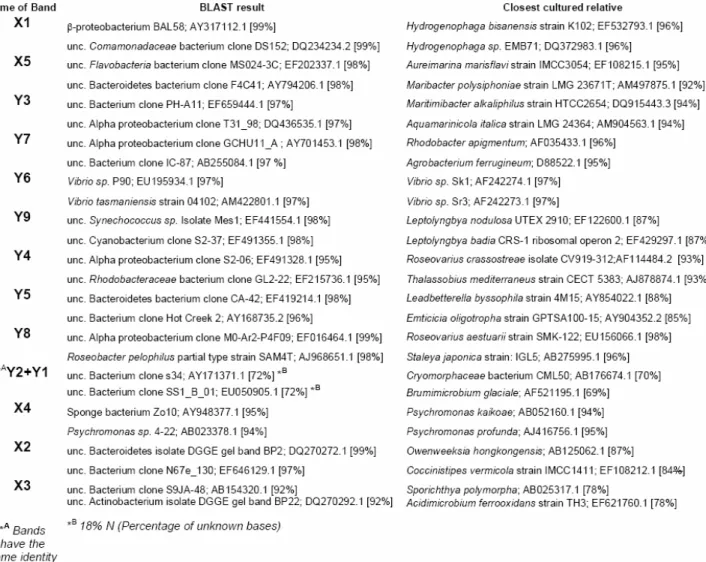
Table 1. Phylogenetic affiliation of 16S rRNA gene sequences from excised DGGE bands obtained. For each phylo-type, the closest two relatives in GenBank and closest cultured relatives are shown. Accession numbers and se-quence similarity are shown after each species.
Fig. 7. Neighbour-joining phylogenetic tree of all bands sequenced, together with the best match in BLAST indicated with B1 before sequence name. Skagerrak bands are called Y and Baltic bands are called X. Reference sequences for a selection of major groups of bacteria are indicated with “REF” before sequence name. Evolutionary distance is given in percent as 10% sequence divergence. Number on branches indicates percentage of 1000 bootstrap repli-cates. The quality of sequences Y 2 and Y1 was not optimal for phylogenetic analyses, for this reason were excluded in the tree.
DISCUSSION
Abundance and production
Treatments gave a response in growth for all substrates, however in both BAL 1 and 2 bacte-rial numbers were quite constant, (Fig. 1.A-F), probably due to the short incubation time (2 days). Increase in growth was more distinct in the BAL 3 and SKA whole water experiments, (Fig. 2.A-F). In both environments glucose to-gether with acetate gave the highest increase in growth, followed by L-amino acids and pyruvate. The only substrate with low increase in growth was glycolate. Differences in abundance be-tween substrates were relatively small. However, when considering bacterial production differ-ences between carbon sources were very impor-tant. In BAL 1, L-amino acids presented the highest production followed by acetate, then pyruvate, glycolate and glucose were close to-gether, (Fig. 1.G). In BAL 2 the overall bacterial production was higher than in BAL 1. But differ-ences between carbon sources were similar with BAL 1, L-amino acids and acetate present the highest values then glucose and pyruvate group together, finally, glycolate presented the lowest production and was close to control, (Fig. 1.H). In BAL 3 however, the response to different car-bon sources was different from BAL 1 and BAL 2. Here glucose presented the highest produc-tion, followed by acetate and pyruvate, then by L-amino acids, again glycolate present low pro-duction and was close to control, (Fig. 2.G). In the SKA experiment acetate and L-amino acids present the highest production but all substrates were quite similar, except glycolate which psented lower production, (Fig. 2.H). These re-sults have two major implications: first, the stimulation of bacterial production can show large differences between the substrates (with SKA as an exception, where production was similar between treatments), and second, the response pattern can differ between environ-ments.
Can my results be verified by other studies? It has been shown by Rich et al. (1996), that glu-cose supports a substantial fraction of bacterial production in the Pacific Ocean. L-amino acids are also known to support the growth of bacteria in the Sargasso Sea, (Suttle et al. 1991). Ho et al. 2002 suggest that bacteria at certain depths may be better adapted to acetate uptake than in other depths. Pyruvate was shown to support growth and contribute to approximately 1/10 of the total bacterial production in the eastern Medi-terranean, (Obernosterer et al. 1999). These
studies together with the result in this study show that carbon sources have an important role for growth and in the case of bacterial produc-tion, bacterial growth response differ between substrates.
Furthermore, the experiments were conducted at different times, with notable differences in the stimulation of bacterial growth and production. Could temporal differences be an important fac-tor for the differential response of bacterioplank-ton? Between sampling of the BAL 1 and 2 ex-periments a time period of 4 weeks had passed. Before sampling of the final third BAL experi-ment another 5 weeks had passed. An indication of this temporal difference was visible when comparing abundance and bacterial production between the Baltic experiments. Between BAL 1 and 2 the total numbers of bacteria had changed markedly, BAL 1 had about 5-6 x10⁶cells ml-1 while BAL 2 reached approximately 3-4 x10⁶
cells ml-1. In BAL 3 the abundance was followed
for a longer time period, hence the abundance ranges from 2-5 x10⁶cells ml-1. For the produc-tion the strongest implicaproduc-tion of temporal differ-ences probably was the overall production level which changed between the experiments. In both BAL 1 and BAL 2, L-amino acids followed by acetate reached the highest production lev-els, (Fig. 1.G-H) However in BAL 3 two other substrates (glucose and pyruvate) reached the highest production, (Fig. 2.G). Based on the time differences between sampling and the differ-ences in bacterial numbers and production from experiment to experiment, temporal variation seems to be a factor for the differential response of bacterioplankton. In similarity, Ho et al. 2002 showed that acetate uptake varied strongly with season, but with no obvious pattern, also the uptake rates of acetate in surface waters varied on a daily basis. The uptake of glucose was shown to vary over a longer period of several months, and variations were more important when affected by El Niño related changes, (Rich et al. 1996).
Even though acetate and pyruvate are known poor carbon sources (low in energy), it was clear that high levels of growth were reached in re-sponse to enrichment with these substrates. Both in Skagerrak and the Baltic this response was reflected. Growth of Escherichia coli on glucose and amino acids is typically fast while low levels of growth are characteristic with ace-tate and pyruvate, (Madigan, et al. 2003). How-ever, in this study acetate and pyruvate
stimulat-ed high growth. Moreover, it was very interesting that acetate and pyruvate also stimulated bacte-rial production. This means that in contrast to E.
coli, marine bacterioplankton are adapted to
utilize pyruvate and acetate, and there is proba-bly a selective advantage to specialize in these carbon sources. As mentioned earlier, Obernos-terer et al. 1999 showed that an important frac-tion of bacterial producfrac-tion was due to pyruvate. Acetate was also important for growth and some bacteria at certain depths could have an advan-tage over other bacteria in other depths at utiliz-ing acetate, (Ho et al. 2002). Hence, acetate and pyruvate are important for growth and produc-tion, but species utilizing them have also a sub-stantial advantage over E. coli and in some cases over other marine bacterioplankton. It is known that bacterial production or protein synthesis takes place prior to cell division, (Madigan, et al. 2003). Therefore the pattern seen in Fig. 2.G, i.e. peak in production before abundance, was logical. However, this pattern was reflected only in the Baltic experiment. In the Skagerrak experiment, the highest produc-tion was reached the same day as the growth peak. This could be an indication of higher nutri-ent levels in Skagerrak. The high production levels of control could also be an indication of higher nutrient levels. The peak in growth and production was reached faster than in BAL 3, this means that bacteria goes from protein syn-thesis to cell division faster.
In order to calculate biomass production it was necessary to use conversion factors. The ap-plied factors were: molecular weight of leucine, fraction of leucine per protein, isotope dilution and 2.22x10⁶DPM/µCi to convert radioactivity (DPMs) to µCi. Even though the isotope dilution was significant, (may reflect lower values for L-amino acids, i.e. 3H-leu was diluted with leu from
the L-amino acids substrate). The conservative assumption is to put the dilution factor to 1. Few measurements have put the factor to about 2, (Simon, Azam, 1989).
Growth on plates, CFUs
When comparing plates with CFU ml-1, it was characteristic that plates with big colonies had the highest CFU ml-1, (Fig. 3 and 4). This
indi-cates that L-amino acids and glucose were bet-ter carbon sources for colony forming bacbet-teria, in similarity with Pinhassi & Berman (2003), were glucose contributed to increase in CFU ml-1. Sequencing of the preserved isolates will
even-tually show any correlation to species found in the DGGEs.
DNA Community Composition
In each experiment different responses to differ-ent carbon sources were found. The most evi-dent finding in experiments BAL 1 and 2, was the unique and strong band for glucose, (X4), (Fig. 5), corresponding to γ-proteobacteria. Since they are both unique and strong bands, this would suggest that this phylotype specialize towards glucose. L-amino acids do not seem to be preferred by any species, it has no strong bands in neither BAL 1 nor BAL 2. Acetate, gly-colate and pyruvate seem to be equally pre-ferred by different species, with similar strength in the present bands. Some of the bands se-quenced appeared to be present in most treat-ments, like X1, with weaker band for in situ and L-amino acids. This was a b-protebacteria called BAL 58, described by Simu & Hagström (2004). The band X5, present in most samples was a flavobacteria belonging to bacteroidetes. This band was interesting, not only because of its response to carbon sources, the closest relative also contains genes for proteorhodopsin, (Ste-panauskas & Sieracki, 2007). This could indicate that bacteria with proteorhodopsin are also adapted to grow when subjected to a resource supply and have an important ecological role in the degradation of DOC. The two experiments with Baltic whole water, presented a highly simi-lar patterning, even though approximately 4 weeks had passed between them. In the two separate experiments, with Baltic whole water, two separate DNA extractions and PCR reac-tions were performed, still the outcome was the same. This would mean that even though tempo-ral differences should be important, the commu-nity composition did not change over this time period of 4 weeks. Moreover, differences in bac-terial production between carbon sources may need to increase to present a substantial re-sponse in community structure. These results have two major implications: the community structure response can show large differences between the substrates. And secondly differ-ences may increase if there is a longer time pe-riod between experiments, or larger differences in production between carbon sources.
In the SKA experiment there were strong indica-tions that different carbon sources stimulate different bacteria. E.g. the glucose treatment presented two strong bands, (Y6), (Fig. 5), cor-responding to Vibrio species belonging to
γ-proteobacteria, in similarity with studies by Eil-ers, et al. (2000) and Pinhassi & Berman (2003). And one weaker band, (Y5), which closely re-semble an uncultured bacteroidetes described by Chauhan & Williams (2007) where growth of bacteria was investigated on substrate coated agar slides. Another important band in SKA was the unique and strong band for glycolate, a α-proteobacteria. This phylotype clearly special-izes in glycolate. This was interesting since no or very little growth and production was observed in the glycolate treatment. L-amino acids are rela-tively similar with acetate and pyruvate, but in contrast to them, one strong band (Y4) was pre-sent. One of the control treatments had a unique band, (Y9), an uncultured Synechococcus sp. described by Allers et al. 2007. In their study, the response of bacterioplankton to glucose and P addition in mesocosms was investigated. Sev-eral of the bands sequenced appeared to be present in all treatments, such as Y8, corre-sponding to a uncultured Roseobacter belonging to α-protebacteria. In Pinhassi & Berman (2003), species of Roseobacter was also found when studying the effect of substrate addition on bac-terioplankton. The band Y3 appears to be pre-sent in several treatments. Although, the band might not have the same identity in L-amino acids compared with in situ. Since it is a strong band it is hard to compare it with the weaker bands in the same level, and therefore sequenc-ing of the band in other treatments is needed to verify its true identity. These results have one major implication: the community structure re-sponse can show large differences between substrates.
When comparing the DGGE result between Bal-tic and Skagerrak whole water, the bacteria re-sponding to treatments were not the same. Envi-ronmental differences clearly affect the commu-nity composition, (Fig. 6.B). Also, there were large differences between carbon sources re-gardless of the environment.
Why do manipulated carbon sources affect growth, production and community structure?
As mentioned above, studies on E. coli clearly states glucose and L-amino acids as good car-bon sources, while acetate and pyruvate are poor carbon sources (low in energy). Still, the response in growth, production and even com-munity composition are marked. It was obvious that there are differences between E. coli and marine bacterioplankton, when considering spe-cialization of nutrients. What are these
differ-ences? And why is there a specialization? Dif-ferent bacteria have evolved difDif-ferent metabolic pathways, and it is reasonable to expect that bacteria are not equally good at utilizing certain substrates. Since the DOC composition in the aquatic environment is a broad spectrum of dif-ferent molecule sizes, (Neidhardt et al. 1990), the most likely explanation would be that the properties of DOC (size) are directly linked to the specialization. As stated above, certain species specialize in small molecules, others in large ones (Low molecular weight, High molecular weight), (Covert & Moran 2001). A specialization is possible depending on each species’ ability to process and utilize large molecules or small molecules, which has been evolved by adapta-tion.
Another explanation is the ability of a species to express hydrolytic ectoenzymes. The importance of these enzymes has been investigated by Mar-tinez et al. 1996. Hydrolytic ectoenzymes play a role in hydrolysing polymeric and particulate matter in aquatic environments for transport into the cell. It could be suggested that depending on the ability of species in natural marine environ-ments to express these enzymes, and depend-ing on which carbon source is available, the bacterioplankton community will adapt and shift. However it has not been shown that large varia-tion in species’ ability for enzyme expression is correlated to large community structure variation, (Unanue et al. 1999). Still the ability of express-ing ectoenzymes may be important for bacterial specialization.
There could also be a selection pressure to-wards supply and demand. If there is low levels of glucose and amino acids and high levels of pyruvate and acetate, the bacteria may chose the better carbon source first, so when they are depleted the bacteria now turn to the poor car-bon sources. It could be possible that many bac-teria can grow well on glucose and amino acids, and as many on pyruvate and acetate, but not equally well. Therefore a specialization is possi-ble.
Mechanisms of selection
Some theories have been proposed to why dif-ferent substrates have difdif-ferent responses, ex-pression of ectoenzymes, selection pressure and metabolic pathways depending on evolutionary differences. How does the actual selection work in the natural environment? The first theory takes predation into account. If a certain species
is specialized towards glucose for instance, call it A. Another species however, call it B, was at first better or even the best at utilizing glucose in comparison with species A. Species B was how-ever subjected to predation (Fenchel T, 1982), subsequently species B left a door open for spe-cies A, which in this scenario is not the better glucose utilizer. As a result the community struc-ture response may not be direct, but rather indi-rect. The second considers Hutchinson’s para-dox, how species of a community can coexist without competitive exclusion occurring, (Hut-chinson, 1961). How then, can the specialization towards carbon sources be accurate if no exclu-sion takes place? Even though this statement is quite old, it has a point. However, numerous explanations have been suggested and experi-mentally verified, (Wilson, 1990), e.g. niche di-versification where species are highly special-ized in a certain environment. On the molecular biological level this diversification is quite intrin-sic and differences between close relatives of a species can be very important (Madigan, et al. 2003).
What do the results mean?
Although more data is needed, it is possible to put forward a hypothesis. According to this study it should be possible to divide bacteria into at least 3 separate groups, depending on evolution and adaptation. The first are the specialists, which are the ones that should have strong bands for a single substrate but none of the oth-ers. They specialize in very few carbon sources and if their specific carbon source is present, a strong response is induced. The second are bacteria that can utilize several carbon sources. This group has not specialized in a specific car-bon source, their focus is a broad spectrum of carbon sources, the advantage of which is the ability to compete with highly specific bacteria. These should be reflected in normal or weak bands present in most or all treatments. Finally, the third are the opportunists, bacteria that can be either specific or have a broad specialization for carbon sources, but are not equally good at utilizing or competing for carbon sources directly, compared with the first two groups. Their strat-egy would be to let predators and other grazers remove their competitors and then aim for the carbon source.
Could this hypothesis be tested? This study have derived and identified DNA for a selection of bacterioplankton. It is possible to construct probes for this selection and apply Fluorescence
In Situ Hybridization, (FISH), in similarity with
Harvey et al. 2006, in which they investigated the response of bacterial community composition after adding protein, glucose and DOM. The application of FISH is especially interesting when adding several different substrates, as in this study. By making probes from sequence data, the detection of these key organisms in the envi-ronment is possible. FISH uses a probe which binds to its target DNA by hybridization. Once the probe is attached, it can be visualized under the microscope, (Pernthaler et al. 2002). It would be interesting to use this approach and follow bacterioplankton species, to measure the frac-tion of both specific species e.g. Vibrio and en-tire groups of bacterioplankton, e.g.
α-proteobacteria, in the different treatments, and see if there are any numerical dominance, (Dang et al. 2002).
Another quantification method is quantitative-PCR, (Q-PCR). It is possible to construct primers from sequence data and quantify the amount of PCR product from a specific group of bacteria or a specific species, (Gibson & Muse, 2004). In the end it would be possible to compare the amount of DNA from a species or a group of bacteria between different carbon source treat-ments. Similar quantification studies have been made by Countway & Caron (2006). In their study they quantified and investigated the ecol-ogy of Ostreococcus sp. in a Californian chan-nel. Further studies with both whole water and dilution cultures are important and necessary. Good data from DNA quantification techniques is the best approach, and will help understanding the impact and importance of resource supply on a larger ecological scale.
DGGE optimization
Even though there are differences between envi-ronments, between the BAL 2 and SKA experi-ments, do these differences represent what it is actually happening in the incubations? Could there be problems with the gels? Even when optimizing the DGGE resolution by changing the acrylamide solutions for the gel casting, the re-sult remained the same. This would suggest that the diversity is higher in the Skagerrak rather than the Baltic Sea. This may be accurate since it is known that many species are incapable of adapting to brackish waters, (Cognetti & Maltagliati, 2000). However another DGGE analysis from the Baltic Sea, made by Riemann, et al. 2008, shows a higher diversity, with more bands. In Fig. 5 above, it is possible to see that
there could be more bands. There were diffuse bands that might be possible to retrieve by opti-mizing the method. A first step would be to re-make the PCR reactions of the DNA extractions, since the problem does not lie in the acrylamide solutions.
Applications
In the near future, NASA will endeavour mis-sions to Mars and to Jupiter’s moon Europa. One goal of the missions is to look for indirect traces of microorganisms such as microfossils and also directly look for microorganisms. How-ever, the chances of finding microbial life or mi-crofossils can be quite small, when the re-searchers do not know where to search and what they are looking for. Therefore, the concen-tration should be on other indirect signs, and an interesting aspect would be to look for re-sources. The aim of this study was to see what types of microorganisms selects for a given car-bon source. When the bacterial community com-position is determined through phylogenetic analysis, some bacterioplankton properties may also be known. The optimal application would be a subglacial lake, like Grimsvötn on the Vatna-jökull ice cap. Such an environment can be used as an analogue for environments on both Mars
and Europa, (Gaidos et al. 1999). Make the same study there and hopefully see a response. Then, in theory the data could be applied to a NASA mission, in terms of what to look for. E.g. if researchers found glucose, then one could look for signs that are characteristic of microor-ganisms that specialize in glucose. It would be much simpler to look for microbial life if their properties would be known. The subglacial lake is known to be anoxic and the bacteria are chemo-litho-autotrophs, (Gaidos et al. 2004), if there are any specialization, it will probably be toward an inorganic resource.
Conclusions
Different carbon sources clearly have an impor-tant role for bacterioplankton community struc-ture, growth and production, and the response is dependent on the environment. Different carbon sources have an individual effect, sometimes visible in bacterial production, and certainly visi-ble in the DGGE. Some species are specialized in a given carbon source. Other species can utilize several different carbon sources. Further studies would help understanding the impact and importance of carbon source supply on a larger ecological scale.
REFERENCES
Allers E, Gómez-Consarnau L, Pinhassi J, Gasol JM, Simek K, Pernthaler J. 2007. Response of
Alteromo-nadaceae and Rhodobacteriaceae to glucose and phosphorus manipulation in marine mesocosms. Appl.
Environ. Microbiol. 9: 2417-2429.
Chauhan A, Williams HN. 2007. Biostimulation of
estuarine microbial community on substrate coated agar slides: a novel approach to study the phylogeny of Bdellovibrio- like organisms. Microb. Ecol. 30:
Epub. ahead of print.
Cottrell M, Kirchman L. 2000. Natural assemblages of
marine proteobacteria and members of the Cyto-phaga-Flavobacter cluster consuming low- and high-molecularweight dissolved organic matter. Appl.
Envi-ron. Microbiol. 66: 1692-1697.
Cognetti G, Maltagliati F. 2000. Biodiversity and
adap-tive mechanisms in brackish water fauna. Mar. Poll.
Bull. 40: 7-14.
Countway PD, Caron DA. 2006. Abundance and
dis-tribution of Ostreococcus sp. in the San Pedro chan-nel, California, as revealed by quantitative-PCR. Appl.
Environ. Microbiol. 72: 2496-2506.
Covert J S, Moran M A. 2001. Molecular
characteriza-tion of estuarine bacterial communities that use high- and low-molecular weight fractions of dissolved or-ganic carbon. Aquat. Microb. Ecol, 25: 127–139.
Dang H, Lovell C R. 2002. Numerical dominance and
phylotype diversity of marine Rhodobacter species during early colonization of submerged surfaces in coastal marine waters as determined by 16S ribo-somal DNA sequence analysis and Fluorescence in situ Hybridization. Appl. Environ. Microbiol.
68:496-504.
Eilers H, Pernthaler J, Amann R. 2000. Succession of
pelagic marine bacteria during enrichment: a close look at cultivation-induced shifts. Appl. Environ.
Mi-crobiol. 66:4634–4640.
Fenchel T. 1982. Ecology of heterotrophic
microflagel-lates: quantitative occurrence and importance as bac-terial consumers. MEPS 9: 35-42.
Gaidos E, Lanoil B, Thorsteinsson T, Graham A, Skidmore M, Han S, Rust T, Popp B. 2004. A viable
microbial community in a subglacial volcanic crater lake, Iceland. Astrobiol. 4: 327-44.
Gaidos, E, Kirschvink, J, Nealson, K. 1999. Life in
icecovered oceans. Science 284: 1631-1633.
Gasol JM, del Giorgio PA. 2000. Using flow cytometry
for counting natural planktonic bacteria and under-standing the structure of planktonic bacterial commu-nities. Sci. Mar. 64: 197-224.
Gibson G, Muse S. 2004. A primer of genome
sci-ence. 2nd edition, p. 88-89, 241-242. Sinauer.
Harvey R, Dyda R, Kirchman D. 2006. Impact of DOM
composition on bacterial lipids and community struc-ture in estuaries. Aquat. Microb. Ecol. 42: 105-117.
Ho T, Scranton M, Taylor G. 2002. Acetate cycling in
the water column of the Cariaco Basin: Seasonal and vertical variability and implication for carbon cycling.
Limnol. Oceanogr. 47: 1119-1128.
Hutchinson, G.E. 1961. The paradox of the plankton. Am. Nat. 95: 137-145.
Kirchman DL, Knees E, Hodson R. 1985. Leucine
incorporation and its potential as a measure of protein synthesis by bacteria in natural aquatic systems. Appl.
Environ. Microbiol. 49: 599-607.
Kisand V, Cuadros R, Wikner J. 2002. Phylogeny of
culturable estuarine bacteria catabolizing riverine organic matter in the northern Baltic Sea. Appl.
Envi-ron. Microbiol. 68: 379–388.
Madigan Michael T, Martinko John, Parker Jack. 2003. Brock biology of microorganisms. 10th edition, p.
120-122, 129-130, 132-133, 581-583. Prentice Hall. Martinez, J, Smith D C, Steward G F, Azam F. 1996.
Variability in ectohydrolytic enzyme activities of pe-lagic marine bacteria and its significance for substrate processing in the sea. Aquat. Microb. Ecol. 10:
223-230.
Muyzer G, de Waal EC, Uitterlinden AG. 1993.
Profil-ing of complex microbial populations by denaturProfil-ing gradient gel electrophoresis analysis of polymerase chain reaction-amplified genes coding for 16S rRNA.
Appl. Environ. Microbiol. 59: 695-700.
Neidhardt, F C, Ingraham, J L and Schaechter M. 1990. Physiology of the bacterial cell: a molecular
approach. p 61. Sunderland: Sinauer associates, Inc.
Pernthaler A, Pernthaler J, Amann R. 2002.
Fluores-cence in situ Hybridization and catalyzed reporter deposition for the identification of marine bacteria.
Pinhassi, J, Azam F, Hemphälä J, Long R, Martinez J, Zweifel U L, Hagström Å. 1999. Coupling between
bacterioplankton species composition, population dynamics, and organic matter degradation. Aquat.
Microb. Ecol. 17: 13-26.
Pinhassi J, Berman T. 2003. Differential growth
re-sponse of colony-forming α- and γ-Proteobacteria in dilution culture and nutrient addition experiments from lake Kinneret (Israel), the eastern Mediterranean Sea, and the gulf of Eilat. Appl. Environ. Microbiol. 69:
199–211.
Obernosterer I, Kraay G, Ranitz E, Herndl G. 1999.
Concentrations of low molecular weight carboxylic acids and carbonyl compounds in the Aegean Sea (Eastern Mediterranean) and the turnover of pyruvate.
Aquat. Microb. Ecol. 20: 147-156.
Rich J H, Ducklow H W, Kirchman D L. 1996.
Concen-trations and uptake of neutral monosaccharides along 140˚W in the equatorial Pacific: Contribution of glu-cose to heterotrophic bacterial activity and the DOM flux. Limnol. Oceanogr. 41: 595-604.
Riemann L, Steward GF, Azam F. 2000. Dynamics of
bacterial community composition and activity during a mesocosm diatom bloom. Appl. Environ. Microbiol. 66:
578-87.
Riemann L, Leitet C, Pommier T, Simu K, Holmfeldt K, Larsson U, Hagström Å. 2008. The native
bacterio-plankton community in the central Baltic Sea is influ-enced by freshwater bacterial species. Appl. Environ.
Microbiol. 74: 503-515.
Schauer M, Balagué V, Pedrós-Alió C, Massana R. 2003. Seasonal changes in the taxonomic
composi-tion of bacterioplankton in a coastal oligotrophic sys-tem. Aquat. Microb. Ecol. 31: 163-174.
Simu, K. and Hagstrom, Å. 2004. Oligotrophic
bacte-rioplankton with a novel single-cell life strategy.
Appl. Environ. Microbiol. 70: 2445-2451. Smith DC, Azam F. 1992. A simple, economical
method for measuring bacterial protein synthesis rates in seawater using 3H-Leucine. MMFW 6: 107-114.
Stepanauskas R, Sieracki ME. 2007. Matching
phy-logeny and metabolism in the uncultured marine bac-teria, one cell at a time. Proc. Natl. Acad. Sci. U S A.
104: 9052-7.
Suttle C A, Chan A M, Fuhrman J A. 1991. Dissolved
free amino acids in the Sargasso Sea: uptake and respiration rates, turnover times, and concentrations.
MEPS. 70: 189-199.
Teixeira M, Neijssel O M. 1997. Bioenergetic
conse-quences of microbial adaptation to low-nutrient envi-ronments. Journal of Biotech. 59: 117–126.
Unanue M, Ayo B, Agis M, Slezak D, Herndl GJ, Iriberri J. 1999. Ectoenzymatic activity and uptake of
monomers in marine bacterioplankton described by a biphasic kinetic model. Microb. Ecol. 37: 36-48.
Wilson B J. 1990. Mechanisms of species
coexis-tence: Twelve explanations for Hutchinson’s paradox of the plankton: Evidence from New Zealand Plant communities. New Zealand Journal. Ecol. 13: 17-42