Oral fluoride retention after
use of mouth rinses with
different fluoride content.
Alexander Stime
Lisa Hansen
Supervisors: Dan Ericson and Kerstin Larsson
Master thesis in Odontology (30 ECTS)
Malmö University
Dentistry program
Faculty of Odontology
2
Oral fluorid retention efter
användning av munskölj med
olika fluoridkoncentrationer.
Alexander Stime
Lisa Hansen
Handledare: Dan Ericson och Kerstin Larsson
Examensarbete (30 hp)
Malmö universitet
Tandläkarprogrammet
Odontologiska fakulteten
3
Abstract
Objective: The purpose of the study is to investigate how fluoride content in saliva depends on different fluoride mouth rinses: 1450 ppm, 910 ppm, 225 ppm and to compare a new 1450 ppm fluoride mouth rinse with the other concentrations.
Material and method: The study included 17 subjects which rinsed with three different mouth rinses, A (225 ppm), B (1450 ppm) and C (910 ppm) at three different times. They rinsed for 1 minute and then spat out all content in a container. After different intervals they passively transferred their saliva into a given container for 1 minute. The samples were sealed and stored in a freezer until the time of analyzing. After the trial, the samples were taken out of the freezer and were reheated. They were mixed with TISAB III and measured with an ion specific electrode. The group’s values were compared by analyzing the results using Tukey’s test.
Results: A visible difference between the three mouth rinses were detected, however, only the difference between mouth rinse A and B were deemed statistically significant at all time points. A statistical significant difference between mouth rinse B and C were found at the time point of 45 minutes.
Conclusion: There is a statistical significant difference between the new, high fluoride containing mouth rinse B and mouth rinse A, but there is not enough data in the study to see a statistically significant difference between mouth rinse B and C, or A and C. Further studies need to be made.
4
Background
Caries is according to WHO’s technical information note from 2017 “the most common non communicable disease worldwide”. It’s also a very expensive disease, costing the society about 5 – 10 % of the whole healthcare budget (1). The use of fluorides to prevent caries lesions, which is well known and documented, is a less expensive and more comfortable option to operative caries treatment or extraction. However it is not without risks. Low to medium high intakes of fluorides can cause fluorosis, and extremely high intakes can cause intoxication and even death. However, the latter one is not possible with the fluoride consumption of dental products used according to the recommendations.
Caries
Dental caries, or dental cavities, is a term to describe loss of tooth substance, i.e. enamel, dentine and or cementum, caused by metabolic changes in the oral biofilm (2). This might result in cavities and occurs when the bacterial flora frequently produces more acids, able to dissolve tooth minerals.
Caries disease is a multifactorial disease and caries lesion occurs when acids from cariogenic bacteria in the oral cavity slowly undermine and
demineralize the tooth's minerals, i.e. hydroxyapatite. The bacteria that causes caries feed on simple sugar molecules from the intake of food (3). The sugars are being metabolized in the bacteria to organic acids that lower the oral pH. At low intakes of sugar, the bacteria produce alcohol, acetic acid and formic acid, whilst at high intakes they produce lactic acid, which dissolves tooth
minerals at a larger extent than acetic- and formic acid. When the pH has dropped, the equilibrium between ions in the tooth and surrounding fluids shifts, resulting in demineralization of
the tooth at a higher rate than the remineralization, which leads to loss of tooth substance. This balance between re- and demineralization is shown in the formula below (2).
Ca5(PO4)3(OH)2 + OH ↔ 5Ca2+ + 3PO43− + 𝑂𝑂𝑂𝑂− (2).
Caries affects both enamel, dentin and root cement and its progression is generally slow-moving(2).
Caries and sugar consumption
As mentioned earlier, caries is multifactorial in its development, and one factor is the intake of food and drinks. It is shown in studies that people who eat more sugar has a higher number of bacteria involved in caries development, also known as carcinogenic bacteria. These findings involved both high frequency of sugar intake and large volumes of sugar. It is also known that a high sugar intake is greater of a risk for people that don’t have a consistent exposure of fluoride, than people that do.(4)
5
By changing the amount of sugars in the diet the risk for caries reduces, and this information is of great importance to especially high-risk patients to treat the underlying cause of the caries disease (4).
Saliva
The saliva is of great benefit to the majority of functions in the mouth. The saliva consists of more than 99% of water and the remaining part consists of minerals, proteins and
glycoproteins. In a normal mouth, the salivary glands secrete between 0.2 – 0.5 ml/min at rest, and the saliva comes mainly from the three major salivary glands: gl. Parotis, gl.
Submandibularis and gl. Sublingualis. Saliva contains a saturated amount of both phosphates and calcium. These are the same minerals as the minerals of the tooth, which reduces the difference in the ion concentration between the saliva and the tooth, reducing the risk of the teeth's minerals being dissolved (2).
The constant secretion of saliva has many functions, one of which is the lubrication of teeth, tongue and mucous membranes for reduced friction. This happens with mucins that make the saliva viscous. The mucins are high molecular weight glycoproteins which also have a property that clumps together bacteria that try to bind to the oral cavity. The saliva can also store ions, buffer sudden changes in pH using bicarbonate (HCO3−), rinse plaques, form pellicle, digest carbohydrates from food intake and also has an antibacterial function (2). In the saliva there is fluoride in an ionized form, i.e. F-, which can bind to naturally occurring calcium. It then forms CaF2 which acts as a fluoride reservoir that is slowly releasing fluoride ions (5).
Earlier measurements from another study show that the use of mouth rinse containing a higher content of fluoride results in elevated levels of fluoride in the saliva up to 120 minutes after rinsing compared to mouth rinses with a weaker concentration of fluoride (6). Another study shows similar results on toothpaste, where the higher concentration gives higher fluoride values up to 60 minutes after the experiment. It also shows that both concentrations were above the participants’ baseline value after 60 minutes (7).
Fluoride
It is well known that fluoride has a preventive effect against caries and has been used in toothpastes in Sweden since the 1960s (8). Since caries is one of the most common diseases, it is important to prevent it (1). Untreated, caries may lead to extensive tooth decay, but may also progress and infect the pulp tissue and the apical bone. When the caries lesion is to that extent, the teeth may need to be root filled, treated prosthetically or be extracted, depending on the diagnosis, which can lead to both physical and mental stress for the patient (9). This also leads to an increased economic stress for the patient and society, which could be avoided with non-operative caries therapy, such as fluoride treatments (10).
Swallowed fluoride is absorbed mainly in the gastrointestinal tract. The amount of fluoride absorbed depends on the food content in the stomach, but if the food does not contain a high level of calcium, such as dairy products, about 90% of suspended fluoride is absorbed into the blood stream (11). In the stomach, fluoride can be absorbed in the form of hydrogen fluoride, HF, and does so by binding to naturally occurring hydrogen ions in the stomach. Because fluoride binds to hydrogen ions in this way, no enzymatic process is needed to aid the transport of fluoride over the gastrointestinal mucosa. In the small intestine, fluoride is absorbed in a non pH depending form.
6
Fluoride is affected by the pH in its environment, which means that fluoride at a low pH (<3.5) is present in larger amounts in the form of HF, whereas fluoride at a high pH is found to be more in the form of F- (12). About half of the absorbed fluoride amount is stored in mineralized tissue, such as teeth and bones. The remaining amount is eliminated mainly through the kidneys, but also through sweat and saliva. The amount of fluoride not absorbed in the gastrointestinal tract is eliminated via faeces. During the development phase of the tooth, fluoride can be incorporated into the enamel, dentin and cement of the tooth, but in a fully developed tooth fluoride can only be retained in the surface layer of the enamel (2). Fluorides effects on the tooth and oral cavity
Fluoride has various functions that makes it important for oral health. The fluoride is incorporated into the enamel and forms either fluorapatite or fluorinated hydroxyapatite, a more acid-tolerant mineral than hydroxyapatite. This allows the enamel to withstand
demineralization and acidic environments to a greater extent. The fluoride penetrates a porous enamel more easily than a fully intact enamel, which means that the fluoride is retained to a greater extent in the part of the tooth that is most demineralized. The fluoride concentration in the tooth is different depending on how far into the teeth it is measured. The highest
concentration is found in the outermost part of the enamel, which reaches the values between hundreds and thousands of mg/kg, as well as the inner part of the dentin, which reaches concentrations between 800-1500 mg/kg (13).
Fluorides most important effect on the caries development is its ability to make
remineralisation easier (14). Fluoride also has an antibacterial effect. It is presented in studies that fluoride can affect the bacterial metabolism in the cariogenic bacteria, and in that way reduces the caries development. The effect itself is deemed complex, but include fluorides effect to act as an inhibitor of enzymes in the bacteria (15).
Studies show that longtime continues use, and presence of fluoride retained to the plaque, soft tissue and teeth, is an important part of an optimal prophylactic treatment against caries. New methods are being developed to make sure that a small amount of fluoride is constantly being released in the oral cavity, both intraoral devices and new materials that slowly releases fluoride to ensure the constant presence of fluoride to prevent the development of caries (16). Risks with increased fluoride intake
Although fluoride is incorporated into mineralized tissues, the effect has been shown to be temporary, and requires continuous administration to give a preventive effect on caries. However, fluoride in high doses comes at a risk and becomes toxic. The amount of fluoride required to give a toxic effect is calculated at 5 mg per kilogram body weight and are levels not achieved when following the dental recommendations (17).
Increased fluoride intake may also cause changes in enamel, dental fluorosis, and in some cases changes in the bone, so called osteofluorose (18). Dental fluorosis can occur when high levels of fluoride are ingested by children during the development of the permanent dentition. Increased levels of fluoride are found in the blood stream and reach the pulp of the tooth and disturb the mineralization of the enamel and/or dentin (19).The risk of getting dental fluorosis is different from person to person, but is estimated to occur at the intake of over 0.1 mg
fluoride per kilogram of body weight and day (20). In light dental fluorosis, only small white spots can be seen on the teeth, while in more severe cases the teeth can get larger
discolorations and loose parts of the enamel (19). Osteofluorosis with clinical symptoms occurs only at doses above 10-20 mg fluoride per day for over 20 years.
7
The fluoride affects the bone in to ways, 1) by being incorporated into the bone tissue, and 2) by contributing to bone formation through the effect of osteoblasts. Osteofluorosis occurs when a very high level of fluoride is bound into the bone, leading to joint and back pain, among other things (21).
Methods for measuring fluoride concentration
The ability to measure fluoride and conducting meaningful studies of international interest is important. However, there is no such standard when it comes to measuring levels and
concentration of fluoride in saliva. Furthermore there are no standardized measurement technique. Since the 1970s sufficiently sensitive methods have been invented. The most common one is using an ion specific electrode, or ISE, in combination with the buffer TISAB III, or total ionic strength adjustment buffer. This is a fairly uncomplicated and reliable method with not a lot of preparations needed before the actual measurement (22). Fluoride measurement with the ISE functions by measuring the ions that passes over a membrane, made of lanthanum crystals with Europium ions attach, rather than measuring the actual amount of fluoride ions in the solution. When measuring the concentration of specific ions in a solution, the ions passes through the membrane and a difference in potential between the solution and the membrane accrue. The difference in potential can be measured and registered. The difference in potential is in proportion to the level of fluoride ions according to Nernst equation. Therefor it is possible to calibrate the electrode by a standardized solution (23).
A problem with measuring fluoride ions in a solution is that fluoride can bind to hydrogen, aluminum, iron, silicon and calcium. TISAB III binds to both aluminum and iron ions and makes sure that they can’t bind to the fluoride. The ISE can only measure free ions and not fluoride that is combines with another element (23).
Temperature and pH are also important in ISE. By adding TISAB III the pH stabilizes. If the pH goes under 5.0 the fluoride ions binds to hydrogen ions and becomes HF and HF2-. If the pH rises above 8.0, La(OH)3 is produced, which increases the electrode’s sensitivity towards OH- which results in falsely high readings. A shifting temperature will also effect the measure results from the ISE. A change of 1 degree Celsius can causa a misreading by 2% at a
concentration by 0,001 ppm fluoride (23).
By adding TISAB III to the solution, the pH level is stable and the bonded fluoride in fluoride complexes is released. This enables the ISE to measure all fluoride in the solution, and not just the free fluoride ions (23).The ISE does have a flaw that it can’t differentiate between fluoride that’s been bonded in a complex or were free in the solution. This were however not a necessary acquirement for this study, therefor the ISE were suitable as a measuring method (24).
Another fluoride measurement technique is spectrophotometry. It’s a technique where a brown solution containing aluminum is added to the fluoride solution. The fluoride ions bind to the aluminum and becomes aluminumfluoride, which is transparent. This process of forming aluminumfluoride results in a formation of a substance that absorbs light from the spectrophotometer.
8
The amount of light absorbed is therefore correlated to the amount of fluoride in the original solution, which makes it possible to measure the fluoride concentration (25). A bachelor thesis comparing the spectrophotometer with the ISE presented that the spectrophotometer as a method of measuring fluoride was more complicated to use and gave less reliable results (26).
Objective
The purpose of the study is to investigate how fluoride content in saliva depends on different fluoride mouth rinses: 1450 ppm, 910 ppm and 225 ppm. The aim is also to compare a new 1450 ppm fluoride mouth rinse with the other concentrations, and see if the new one gives a significantly higher fluoride amount in the saliva, if it lasts for a long time and if the retained and/or swallowed amount of fluorine is in the range of an acceptable amount.
Hypothesis
0 hypothesis: The preparation containing 1450 ppm NaF has no difference in the
concentration of fluoride measured in the saliva over time compared to the 910 ppm and 225 ppm mouth rinse.
Hypothesis: The preparation containing 1450 ppm NaF has a difference in the concentration of fluoride measured in the saliva over time compared to the 910 ppm and 225 ppm mouth rinse, and is retained in a non-toxic dose.
Material and method
Material
Test solutions: Brilliant Smile 0.32 Fluoride Rinse, Dentan Mint 0.2%, Dentan Mint 0.05% Standardized fluoride solution: Fluoride Dissolve 1000 ppm
Buffers: TISAB III
Fluoride electrode: SevenCompact ™ pH / Ion S220, PerfectION ™ Combination Fluoride Electrode
Laboratory materials: Eppendorf research Pipettes, Tip StackPack Pipette tip 200 µl, Petri dishes, Sarstedt tube with cap 114x44mm, Sarstedt container 25 ml 54x27, Sarstedt screw cap tube 10 ml 100 x 16 mm conical base with enclosed cap,
Laboratory machines: Sarstedt mono.mixer D-5223, Termaks b 8054 Trial subjects:
Twenty volunteers were recruited for the main trail, and a total of four volunteers were recruited for the two pilot trials. The inclusion criteria for the trial were that the subjects 1) had a good general health without any medical conditions, allergies or medication, 2) had a minimum of 24 teeth, six in each quadrant, without any extensive restorations, 3) had no signs of gingivitis, active periodontitis or active caries, 4) had no dental braces or removable oral prostheses, 5) were not pregnant, and 6) had not been participating in any other study a month before the trail.
Method
The application to the ethics committee in Lund was submitted and approved, reference number 2018/180. 20 subjects, who fulfill the selection criteria, were recruited at Malmö University. All participants received oral and written information about the experiment before the trial. All participants were volunteering to be part in the study and were promised a movie ticket after the completed trial.
9
The study was done as a randomized double-blind study. Before the main trial, two pilot trails where performed to perfect the method. The participants were not allowed to have brushed their teeth after 11 PM the night before the trials. They were also informed not to have eaten or drunken the morgning before the trial. Drinking water was permitted.
Before the trial, all three mouth rinses were measured and all three was close enough to the marketed concentration to deem these as correct.
During the trial, the subjects received 10 ml of one of the three different mouth rinses, without the students themselves or the responsible of the study knowing which of the three mouth rinses they were given. They rinsed for one minute and then spat out all of the mouth rinse in a container. After different intervals of rinsing, the subjects passively transferred their saliva into a given container for one minute. The samples were sealed and stored in freezer. This was done a total of three times per subject, spread out on different days, so that each individual in the experiment had rinsed with all three different mouth rinses in the study. After the trial, the samples were taken out of the freezer and heated to 25 ℃. An amount of the samples was transferred each to a new container, where a calculated amount of TISAB III were added. These were vibrated for ten seconds for homogeneous mixing. An amount of the vibrated mixture was pipetted into a drop onto a petri dish and the fluoride content of the solution were measured using an ion specific electrode. The values were registered and the samples were discarded. The group’s values were to be compared by analyzed the results using Tukey’s test.
The pilot trial:
Pilot trial 1:
Two subjects were told not brush their teeth after 11 PM the night before or the same morning as the experiment. They were also asked not to eat or drink before the attempt. The subjects received 10 ml of one of the three different mouth rinses. They rinsed for one minute and then spat out all the mouth rinse in the same container as they were given it in. Then the clock started. After 1, 3, 5, 15 and 30 minutes, the subjects passively transferred their saliva into a given container for one minute. The samples were sealed and frozen. This was done a total of three times spread over different days so that each individual had rinsed with the three
different mouth rinses in the study.
At the time of the analysis, samples were taken out of the freezer and heated to 25 ℃. 200 μl of the samples was transferred each to a new container where 20 μl of TISAB III were added. The samples were vibrated for ten seconds to gain a homogeneous mixing. Then 200 μl of the mixture were pipetted onto a petri dish in the form of a drop, in which the fluoride content were measured by an ion-specific electrode. The values were noted and the samples discarded. The values were plotted on a graph.
Pilot trial 2:
Two subjects were told not brush their teeth after 11 PM the night before or the same morning as the attempt. They were also asked not to eat or drink before the attempt. The subjects received 10 ml of one of the three different mouth rinses. They rinsed for a minute and then spit out all the mouth rinse in a new container. Then the clock started. After 1, 3, 5, 10, 20, 30, 45 and 60 minutes, the subjects passively transferred their saliva into a given container for 1 minute. The samples were sealed and frozen.
10
At the time of the analysis, samples were taken out of the freezer and heated to 25 ℃. 200 μl of the samples were transferred each to a new container where 20 μl of TISAB III was added. The samples were vibrated for 10 seconds to gain a homogeneous mixing. Then 100 μl of the mixture were pipetted onto a petri dish in the form of a drop, which were then measured using an ion-specific electrode. The values were noted and the samples discarded. The values were plotted on graphs.
The main trial
Before the trial
The participants were not allowed to have had brushed their teeth after 11 PM the night before the trial. They were also informed not to have eaten or drunk before the attempt. Drinking water was permitted.
During the trial
The subjects were recruited on their claim that they had a normal saliva secretion. Before the first trial, a baseline test were made to determent that all subjects had an accepted saliva secretion. The volunteers were asked to sit down and not speak for five minutes in order to avoid stimulation saliva. Then for five minutes they were asked to let their saliva passively drip into a container. The criteria in this trial was initially that the subjects should have a saliva secretion over 0.25 ml per minute, estimated by weight. The result is shown in table 1. In order to give the subjects all tree concentrations of the mouth rinse, three main trials were carried out. Each time the volunteers received 10 ml of either mouth rinse A, B or C,
following a randomized preset schedule, making sure all volunteers received all different concentrations. Neither the subjects nor the responsible of the study knew what concentration the subjects were given at what time in order for the test to be non-bias. The subjects rinsed for 1 minute and then spat out all of the mouth rinse in a container marked 0 and with the subject’s code and letter of the given mouth rinse. After 1, 3, 5, 10, 20, 30, 45 and 60 minutes of the rinsing, the subjects passively transferred their saliva into a given container for 1 minute, marked with the time, the subject’s code and the letter for the given mouth rinse. The samples were sealed and stored in a freezer.
Some of the subjects were not able to attend one or more of the set dates for the sessions. In order to complete the study, three single sessions were scheduled with those volunteers to complete the study. The single sessions were under the same premises as the original sessions. After the trial
The samples were taken out of the freezer and heated to 25 ℃ with a Termaks b 8054. An amount of 200 μl of the samples were transferred each to a new container, marked as the one before, where 20 μl of TISAB III was added. These were vibrated with a Sarstedt mono mixer D-5223 for 10 seconds for homogeneous mixing. 100 μl of the vibrated mixture were pipetted into a drop onto a petri dish which was then measured using an ion specific electrode. The values were registered and the samples were discarded. The results were analyzed with Tukey’s test. The ISE probe was also re-calibrated between every new session according to the manufacture in order to get the best results.
The samples that had a smaller amount of saliva than 200 μl were divided into four groups. One group with at least 100 μl, one group with at least 50 μl, one group with at least 20 μl and one group with less than 20 μl of saliva. To the samples with 100 μl of saliva, 10 μl of TISAB
11
III was added. To the samples with 50 μl saliva, 50 μl of de-ionized water and 10 μl of TISAB III was added.
The test with 20 μl of saliva, 80 μl of de-ionized water were added and then 10 μl of TISAB III. The samples with a volume lesser than 20 μl of content were deemed unmeasurable and were discarded.
In the samples with 200 μl of saliva it was possible to make two separate readings with the ISE if a faulty reading were suspected. However, this were not possible with the tests that only provided 100 μl of readable solution.
Results
20 subjects were recruited and a total of 17 subjects partook in the full study, 13 women and 4 men. The drop out rate was 15 %, which were probably due to the amount of time needed to
complete the study. 7 of the subjects had, after calculation of saliva secretion, a decreased secretion.
A total of 404 samples were included and measured in the study. As seven subjects had a decreased saliva secretion, 196 samples were not included in the analysis due to the inclusion criteria. They were however part of an added part of the study to see the difference in fluoride retention between high and low salivary rates. 72 samples from the original 476 samples, had a smaller amount of saliva than needed. These were deemed unmeasurable and were discarded. However, some of the samples were diluted to see if they could be measured, but the results were deemed faulty and were discarded. The results are presented in table 1 and 4 diagrams (figure 2-5).
salivering ml/min 101 0,03 102 0,304 103 0,322 104 0,362 105 0,216 107 0,834 108 0,09 110 0,448 111 0,4 112 0,164 113 0,068 114 0,414 115 0,116 116 0,666 117 0,324 118 0,272 119 0,086
Mouth rinse A, 225 ppm Mouth rinse B, 1450 ppm Mouth rinse C, 910 ppm
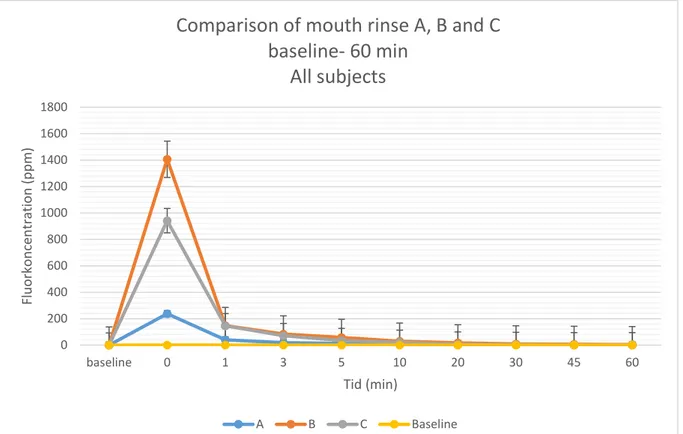
baseline 0,056925 0,056925 0,056925 0 237,91059 1406,3953 942,00118 1 39,874633 148,05707 146,652 3 18,648385 84,153447 72,025643 5 13,2209 58,275014 34,611421 10 6,9538071 29,681713 21,166383 20 2,38546 16,918236 7,8626308 30 1,2879429 9,0561308 5,1163 45 0,4659769 5,5321063 2,7434 60 0,45188 3,2358563 2,7114692
Tabel 1: Saliva secretion of all 17 subjects
Table 2: Comparison of mean values of concentration of fluoride in saliva samples of all subjects in baseline sample and after 0 – 60 minutes after rinse. Mouth rinse A = 225 ppm, B = 1450 ppm and C = 910 ppm fluoride.
12
Figure 2. A comparison of the three mouth rinses A, B and C which is 225, 1450 and 910 ppm in fluoride concentration, at the interval from baseline and 60 minutes after rinsing.
Figure 3: A comparison of the three mouth rinses A, B and C which is 225, 1450 and 910 ppm in fluoride concentration, at the interval from 10 to 60 minutes after rinsing.
0 10 20 30 40 50 60 70 5 10 20 30 45 60 Fl uo rk onc ent ra tio n ( ppm ) Tid (min)
Comparison of mouth rinse A, B and C
5 - 60 min
All subjects
A B C Baseline 0 200 400 600 800 1000 1200 1400 1600 1800 baseline 0 1 3 5 10 20 30 45 60 Fl uo rk onc ent ra tio n ( ppm ) Tid (min)Comparison of mouth rinse A, B and C
baseline- 60 min
All subjects
13 -500 0 500 1000 1500 2000 baseline 0 1 3 5 10 20 30 45 60 Fl uo ride co nc ent ra tio n ( ppm ) Time (min)
Comparison of mouth rinse A, B and C
Baseline - 60 min
Subjects with decreased saliva secretion
A B C -400 -200 0 200 400 600 800 1000 1200 1400 1600 baseline 0 1 3 5 10 20 30 45 60 Fl uo ride co nc ent ra tio n ( ppm ) Time (min)
Comparison of mouth rinse A, B and C
Baseline - 60 min
Subjects with normal saliva secretion
Figure 5. A comparison of the three mouth rinses A, B and C which is 225, 1450 and 910 ppm in fluoride concentration, with the subjects that had a normal saliva secretion
Figure 4. A comparison of the three mouth rinses A, B and C which is 225, 1450 and 910 ppm in fluoride concentration, with the subjects that had a decreased saliva secretion
14
Table 4: Tukey’s test on the difference between the three solution A 910 ppm, B 1450 ppm and C 225 ppm Differences
between groups
Tukey’s test (p-value)
Time (p-value) A-B A-C B-C
1 min 0,005 0,009 0,008 0,999 3 min 0,002 0,000 0,003 0,661 5 min 0,001 0,001 0,117 0,070 10 min 0,002 0,000 0,034 0,243 20 min 0,002 0,001 0,272 0,052 30 min 0,003 0,000 0,094 0,101 45 min 0,002 0,000 0,100 0,033 60 min 0,004 0,001 0,011 0,742
Discussion
Main resultsThe study’s aim was to investigate how fluoride content in saliva depends on different fluoride mouth rinses: 1450 ppm, 910 ppm and 225 ppm. The aim was also to compare the new 1450 ppm fluoride mouth rinse with the other concentrations, and see if the new one gave a significantly higher fluoride amount in the saliva. To analyze this, a Tukey’s tests were made.
As shown in table 2 and 3, there was a statistical difference between mouth rinse A (225 ppm) and B (1450 ppm) at all the tested time points (1, 3, 5, 10, 20, 30, 45 and 60 minutes).
Mason et al 2010 (6) used a similar method as this study, and found a statistic significant difference between 450 ppm and 225 ppm. It was therefore expected that the difference between mouth rinse A and B was statistically significant.
However did this current study not show a statistically significant difference between mouth rinse A (225 ppm) and C (910 ppm) which was expected when comparing with the previously mentioned study. Mason, S, C’s study had proximally the same number of subjects, but had a higher limit for saliva secretion rate of the subjects, at 1 ml/min instead of 0.25 ml/min that this current study had (27). The low limit in our study was most likely the reason for large amount of unmeasurable values, which probably lead to the inability to receive a statistical significant difference between mouth rinse A and C. Our study did also not find a statistical difference between moth rinse B (1450 ppm) and C (910 ppm) on all time points, which could be due to the same reason. There is, however a significant difference between the two mouth rinses B and C at the time point of 45 minutes. How this occurred might be of random chance, or, more probably, it shows that there is a statistical significant difference between the two mouth rinses, but this study did not have enough samples to gain saturation for the study. Subjects with a decreased saliva secretion in this study had more fluoride retained in the oral cavity for a longer period of time (se diagram 4-5). This is probably due to the reduced clearance of saliva, which lets the fluoride to stay in the mouth. It is known that people with a decreased saliva secretion has a higher risk of developing caries (28).
15
It is therefore much desirable that these people have a higher amount of fluoride in the oral cavity to reduce their risk of developing caries.
The test subjects
The results are based on the samples from 17 volunteers that participated in the study, based on three different mouth rinses. In order to prevent any manipulation of the results, the study was double blind. The volunteers were randomly given a number in order to hide their identity. Before the test started the supervisors of the test randomly gave the three different mouth rinse the letters A, B and C in order for the controllers not knowing in advance what concentration of fluoride the containers retained. Only the supervisors knew what letter coded for what concentration of fluoride. The test was performed in three different days, so that the test subjects had 1 week between each mouth rinse, minimizing the risk of contamination ny earlier trials. The trials were performed in the morning with instructions to the subjects not to have brushed after 11 PM the night before. This was again a way to minimize the risk of contamination by the earlier trials. However, it is impossible to be 100% sure that none of the volunteers did not brush his or her teeth on the morning of the experiment.
The main criteria for the volunteers were to be healthy, not to have any active caries lesions, not to have any dental retainers or prosthesis, and have a normal saliva production. Normal salivation is in this study defined as a minimum production of 0,25ml saliva / minute. After the measurement of the total amount of saliva produced during the baseline test it was shown that seven of the seventeen volunteers had a decreased salivation. One volunteer (subject 115) had a fluoride level that surpassed all of the others. This could be explained by the possibility that this person brushed his/her teeth before the trials and thus having a higher concentration of fluoride retained in the oral cavity.
It is also possible that volunteer 115 has higher fluoride retention than normal, which would explain the high readings. Because the subjects were anonymous, it was impossible to go back and confirm if the subject had not brushed their teeth after 11 PM the night before.
About the method
The method chosen to determine the fluoride concentration in the saliva sample in this study was an ion specific electrode, or ISE, which is a method that is fast and reliable. The amount of liquid used were 100-200 μl and gave accurate results with the ISE method, which is convenient when handling small amounts of saliva. This allows measurement without the need of dilution, which if done could have been a source of error.
A problem with measuring fluoride ions in a solution is that fluoride has the ability to create complexes with other ions in the solution. The ISE can only measure free ions, which leads to a compromised result if a great amount of the fluoride ions in the solution is bonded in
complexes. TISAB III was added to the solution to free the fluoride from possible complexes. TISAB III was also added to help stabilize the pH which is needed in order to get an accurate result from the ISE. This is because the ISE is pH dependent, and will have problems if the pH goes under 5.0 or over 8.0.
Another issue with the ISE is fluctuation of temperature. All the samples have to be the same temperature in order to get correct reading, and the ISE works at an optimal temperature 25 degrees Celsius. It is shown that a fluctuation of 1 degree will give a misreading of 2% at 0,001 ppm fluoride. To ensure this, all samples were kept in a heater set to 25 degrees for at least 24 hours prior to readings. However, due to the fact that measurement was made on
16
three different day, and the room temperature weren’t possible to control, it’s possible that there was a difference in temperature between the samples.
Importance of study
As previous stated, caries is one of the world most common diseases, costing the society up to 10% of the whole healthcare budget (1). Since caries is a multifactorial disease there is not one single solution that alone can prevent it. With the use of fluoride the risk of caries
decreases. This due to the fluorides negative effect on the metabolism of bacteria and also the fluoride’s ability to bind to the hydroxyapatite crystals of the enamel, leading to a higher resistance towards acid attack that otherwise would have demineralized the tooth’s surface. This study indicates a correlation between a higher fluoride concentrations in the saliva after rinsing with the new, higher fluoride mouth rinse compared to the other two solutions in the study. It also shows a small difference in duration of fluorides in the saliva, between the high fluoride mouth rinse compared to the others. Studies show that continues use, and presence of fluoride retained in the oral cavity is an important part of an optimal prophylactic treatment against caries (16). It is therefore of high importance of fluoride containing dentifrices to have as long retention to the oral cavity as possible. In this study, it was not possible to see a
statistical significant between rinse B and C, which makes it impossible to draw a conclusion that the new higher fluoride containing mouth rinse if a better prophylactic treatment for caries. However, if the study was repeated with more subjects and a higher limit of saliva secretion, a significant difference between the two mouth rinses might be expected. It is then necessary to see if the increased amount of fluoride from the new high fluoride mouth rinse is enough to give a clinically significant improvement as of prophylactic treatment.
Ethics
In this study 17 people were subjected to fluoride solutions at three times, with a maximum concentration of 1450 ppm. This is the normal fluoride level in regular toothpaste in Sweden. It would then be of similar risk for the subjects to attend this study as it would be brushing their teeth with toothpaste as they do regularly twice a day. The risk of ingesting fluoride is higher with mouth rinses than with tooth paste due to the amount and viscosity of the two. However, the volunteers were all both instructed in writing and orally not to swallow any of the mouth rinse and all of the volunteers were adults and used to mouth rinse, hence this risk was deemed small to non-existing.
Fluoride is however a discussed topic where claims have been put forth stating that fluoride should be classified as a neurotoxin, causing a lot of harm to the body. This was, according to those against fluoride use, especially harmful for young children where it causes i.e. ADHD, dyslexia and autism. However, most researches claim that these studies are inconclusive and the results are based on assumptions and only small parts of the results from studies (29). Most scientist agree that an excessive intake of fluoride is harmful, but when used accordingly to recommendations there are no risk for bodily harm (17).
Conclusion
There is a statistical significant difference between the new, high fluoride containing mouth rinse B and mouth rinse A, but there is not enough data in the study to see a statistically significant difference between mouth rinse B and C, or A and C. Further studies need to be made to see if they have a statistical significant difference.
17 References
1. World Health Organization. WHO | Sugars and dental caries. 2017; Available at:
http://www.who.int/nutrition/publications/nutrientrequirements/sugars-dental-caries-keyfacts/en/. Accessed Feb 7, 2019.
2. Fejerskov Oe, Nyvad Be, Kidd, Edwina A. M. edt. Dental caries : the disease and its clinical management. : Chichester : Wiley-Blackwell, 2015.; 2015.
3. Conrads G, About I. Pathophysiology of Dental Caries. Caries Excavation: Evolution of Treating Cavitated Carious Lesions Basel, Switzerland: S. Karger AG; 2018. p. 1-10. 4. Brian A. Burt, B.D.S., M.P.H., Ph.D., Satishchandra Pai, B.D.S., M.S., M.P.H. Sugar Consumption and Caries Risk:
A Systematic Review. Journal of Dental Education 2001;65:1017-1023.
5. Naumova EA, Kuehnl P, Hertenstein P, Markovic L, Jordan RA, Gaengler P, et al. Fluoride bioavailability in saliva and plaque. BMC ORAL HEALTH 2012 JAN 9;12.
6. Mason SC, Shirodaria S, Sufi F, Rees GD, Birkhed D. Evaluation of salivary fluoride retention from a new high fluoride mouthrinse. J Dent 2010 Nov;38 Suppl 3:30.
7. Ingle NA, Sirohi R, Kaur N, Siwach A. Salivary fluoride levels after toothbrushing with dentifrices containing different concentrations of fluoride. J Int Soc Prev Community Dent 2014 May;4:129-132.
8. Twetman Svante. Fluortandkräm vid risk eller förhöjd risk för karies. 2018; Available at:
https://www.internetodontologi.se/fluortandkram-vid-risk-for-karies/. Accessed -02-07, 2019. 9. Bjørndal L. The Caries Process and Its Effect on the Pulp: The Science Is Changing and So Is Our Understanding. American Academy of Pediatric Dentistry 2008 may/june;30:192-196. 10. Atkins CY, Thomas TK, Lenaker D, Day GM, Hennessy TW, Meltzer MI. Cost‐
effectiveness of preventing dental caries and full mouth dental reconstructions among Alaska Native children in the Yukon–Kuskokwim delta region of Alaska. Journal of Public Health Dentistry 2016;76:228-240.
11. Medjedovic E, Medjedovic S, Deljo D, Sukalo A. IMPACT OF FLUORIDE ON DENTAL HEALTH QUALITY. Materia socio-medica 2015 Dec;27:395-398.
12. Takahashi N, Nyvad B. The Role of Bacteria in the Caries Process. Journal of Dental Research 2011 Mar;90:294-303.
13. E. Angeles Martı´nez-Mier. Fluoride: Its Metabolism, Toxicity, and
Role in Dental Health. Journal of Evidence-Based Complementary & Alternative Medicine 2011 -09-29.
14. Almohefer SA, Levon JA, Gregory RL, Eckert GJ, Lippert F. Caries lesion
18
and toothpaste surfactant. Journal of applied oral science : revista FOB 2018 Jun 11,;26:e20170499.
15. Marquis RE. Antimicrobial actions of fluoride for oral bacteria. Can J Microbiol 1995 Nov;41:955-964.
16. Castioni NV, Baehni PC, Gurny R. Current status in oral fluoride pharmacokinetics and implications for the prophylaxis against dental caries. European Journal of Pharmaceutics and Biopharmaceutics 1998;45(2):101-111.
17. Tideström Karin. Nu ökar oron för fluor. 2015; Available at:
http://www.tandlakartidningen.se/teman/nu-okar-oron-for-fluor/. Accessed -02-07, 2019. 18. Roos J, Dumolard A, Bourget S, Grange L, Rousseau A, Gaudin P, et al. [Osteofluorosis caused by excess use of toothpaste]. Presse Med 2005 Nov 19,;34:1518-1520.
19. Denbesten P, Li W. Chronic fluoride toxicity: dental fluorosis. Monographs In Oral Science 2011;22:81-96.
20. Ullah R, Zafar MS, Shahani N. Iranian journal of basic medical sciences. 2007; Available at: http://ijbms.mums.ac.ir/.
21. Socialdepartementet. Fluor. Fluor 2013.
22. Hardwick K, Barmes D, Writer S, Richardson LM. International Collaborative Research on Fluoride. Journal of Dental Research 2000 Apr;79:893-904.
23. Mettler-Toledo International Inc. perfectION Guidebook Fluoride. Available at:
https://www.mt.com/se/sv/home/library/operating-instructions/lab-analytical-instruments/GB_Fluoride.html. Accessed Feb 8, 2019.
24. Itota T, Carrick TE, Rusby S, Al-Naimi OT, Yoshiyama M, McCabe JF. Determination of fluoride ions released from resin-based dental materials using ion-selective electrode and ion chromatograph. Journal of Dentistry 2004;32:117-122.
25. Barghouthi Z, Amereih S. Spectrophotometric Determination of Fluoride in Groundwater Using Resorcin Blue Complexes. American Journal of Analytical Chemistry 2012
-08-30;03:651.
26. Langeveld E, Åhman-Persson C. En jämförelse av fluoridmätningsmetoder avseende tillförlitlighet och användarvänlighet - En laborativ studie .
27. Mason, Stephen C.|Shirodaria, Soha|Sufi, Farzana|Rees, Gareth D.|Birkhed, Dowen. Evaluation of salivary fluoride retention from a new high fluoride mouthrinse. Journal of Dentistry 2010;38:S36.
28. Rodríguez PN, Martínez Reinoso J, Gamba CA, Salgado PA, Mateo MT, Manto MdC, et al. Association among salivary flow rate, caries risk and nutritional status in pre-schoolers. Acta Odontol Latinoam 2015;28:185-191.
19
29. Forskare varnar för fluor till barn. Svenska Dagbladet 2014 -02-15.
20 Appendix 2
Statistical calculations on samples that were not diluted.
Descriptive Statistics Dependent Variable: Time1
Individual Treat Mean Std. Deviation N
Total A B C Total 39,8746 27,42663 15 148,0571 127,55265 15 146,6520 135,97189 17 113,0225 119,05577 47 Descriptive Statistics Dependent Variable: Time3
Individual Treat Mean Std. Deviation N
Total A B C Total 18,6484 17,01379 13 84,1534 68,71764 15 72,0256 55,06910 14 59,8355 58,85303 42 Descriptive Statistics Dependent Variable: Time5
Individual Treat Mean Std. Deviation N
Total A B C Total 13,2209 15,64788 13 58,2750 51,66863 14 34,6114 35,08518 14 35,9093 41,03808 41 Descriptive Statistics Dependent Variable: Time10
Individual Treat Mean Std. Deviation N
Total A B C Total 6,9538 8,37001 14 29,6817 28,85916 16 21,1664 22,39327 12 19,6728 23,58896 42
21
Descriptive Statistics Dependent Variable: Time20
Individual Treat Mean Std. Deviation N
Total A B C Total 2,2408 2,64536 16 16,9182 19,89649 14 7,8626 5,64098 13 8,7191 13,14327 43 Descriptive Statistics Dependent Variable: Time30
Individual Treat Mean Std. Deviation N
Total A B C Total 1,2314 1,66941 15 9,0561 9,71435 13 5,1163 5,46549 11 4,9354 7,06558 39 Descriptive Statistics Dependent Variable: Time45
Individual Treat Mean Std. Deviation N
Total A B C Total ,4531 ,63355 14 5,5321 5,48542 16 2,7434 2,74341 11 3,0496 4,25984 41 Descriptive Statistics Dependent Variable: Time60
Individual Treat Mean Std. Deviation N
Total A B C Total ,4519 ,55362 15 3,2359 3,56476 16 2,7115 3,59665 13 2,1318 3,11163 44