http://www.diva-portal.org
Postprint
This is the accepted version of a paper published in Russian Politics. This paper has been peer-reviewed but does not include the final publisher proof-corrections or journal pagination.
Citation for the original published paper (version of record): Hutcheson, D., McAllister, I. (2018)
Putin versus the Turnout?: Mapping the Kremlin’s 2018 Presidential Election Support Russian Politics, 3(3): 333-358
https://doi.org/10.1163/2451-8921-00303002
Access to the published version may require subscription. N.B. When citing this work, cite the original published paper.
Permanent link to this version:
Putin versus the Turnout?
Mapping the Kremlin’s 2018 Presidential Election Support
Published as: Derek S. Hutcheson and Ian McAllister (2008) ‘Putin versus the Turnout? Mapping the Kremlin’s 2018 Presidential Election Support’, Russian Politics 3(3): 333-358 [ISSN: 2451-8913].https://doi.org/10.1163/2451-8921-00303002. This is the pre-proof manuscript, which is substantively similar to the final article but may contain minor editorial differences. Please refer to the published version if citing.
Derek Hutcheson
Department of Global Political Studies,
Faculty of Culture and Society (Kultur och Samhälle) Malmö University
SE-205 06 Malmö Sweden
derek.hutcheson@mah.se Ian McAllister
School of Politics and International Relations The Australian National University
Canberra, ACT 0200 Australia
ian.mcallister@anu.edu.au Abstract
The 2018 Russian presidential election was effectively a contest not between Vladimir Putin and the other seven candidates on the ballot paper, but between Putin and the level of election turnout. Anything less than a large majority based on a respectable level of turnout would have undermined Putin’s legitimacy to serve for a further six-year term. In the event, Putin achieved his goal. In this paper we examine the background to the election and the conduct of the campaign, and analyse the result. Putin’s success can be traced to, first, long-standing patterns of differential turnout across the regions and, second, administrative initiatives by the election authorities which created a renewed confidence in the integrity of the election process. While there is evidence that those wishing to protest against Putin spoiled their votes, the impact of this was minor.
Keywords
Introduction
On 18 March 2018, Vladimir Putin was elected for his fourth term as president of the Russian Federation. Despite the lowest-key election campaign in recent memory, he won an
overwhelming victory, with 76.7 percent of the vote, on a turnout of 67.6 percent. Having been the central figure in Russian politics since the start of the century, and still enjoying high approval ratings, Putin’s victory was hardly a surprise. However, from the moment he officially confirmed his candidacy, he still faced two obstacles. First, he had to beat the seven other candidates to the post; and second, he had to mobilise his support base to transfer his general popularity into an electoral mandate. Whilst a low-turnout plurality of the vote would formally have been enough to confirm his tenure as president for another six years, only a demonstration of strong support on a high turnout could reconfirm the charismatic public legitimacy that has been the foundation for his political longevity.
The obvious paradox was that the very predictability of the election created less incentive for people to turn out and vote than in a close contest in which every vote would make a
difference.1 As such, whilst the formal 2018 presidential election campaign was fought between eight candidates, the real electoral battle that Putin faced was essentially with the turnout, rather than his opponents. Despite his generally high popularity, Putin’s support base is not monolithic. There are a few regions in which he enjoys exceptionally high support, but also many in which he is merely popular. Ensuring a sufficient spread of votes on a high turnout was essential to his continuing legitimacy.
This article focuses in detail on this aspect of the 2018 election. By examining the voting and turnout patterns recorded in March 2018, it is possible see where the battle of “Putin versus the turnout” was most salient, and how high turnout benefited him disproportionately. The 2018 election result was also consistent with other recent contests in confirming the regions in which the presidential support base is most and least reliable. The article begins by setting out the background and framework of the 2018 election, before examining in more detail the
1 There is a large literature which shows that voters are discouraged from voting if they believe their vote will have little influence on the outcome. For reviews, see André Blais, “What Affects Voter Turnout?”, Annual
Review of Political Science 9 (2006): 111-25; Benny Geys, “Explaining Voter Turnout: A Review of Aggregate
Level Research”, Electoral Studies 25, no. 6 (2006): 637-63; Joao Cancela and Benny Geys, “Explaining Voter Turnout: A Meta-Analysis of National and Subnational Elections”, Electoral Studies 42, no. 3 (2016): 264-75.
geographical and aggregate patterns of voting. We place a particular focus on variations in turnout and support levels for Putin across the country, and evaluate their significance for the final result. Finally, we examine voters’ perceptions of the integrity of the election result. Background
The presidential election was scheduled symbolically for 18 March 2018 – which coincided with (and provided a reminder of) the anniversary of Crimea’s accession into the Russian Federation in 2014.2 Despite the fact that public interest in the campaign only picked up in the last few days before polling day, the parameters of the election were in place many months before it. For the first time, the presidential election did not immediately follow a State Duma one. The Duma’s mandate period was extended from four to five years, and the presidential term to six, after the 2011-12 elections. There was thus an 18-month gap between the September 2016 parliamentary election and the March 2018 presidential one.
The State Duma election nonetheless gave certain pointers toward the 2018 presidential contest. First, the victory of United Russia (UR) demonstrated that the Kremlin had regained control of the political agenda after some brief instability in 2011-12.3 There was clearly no appetite for radical reform among the electorate. At the same time, though, electoral turnout slumped to 47.9 percent in 2016 – a post-Soviet low, by some margin. As McAllister and
2 The election is formally due by law on the second Sunday of the same month as the previous election – since 2004, the second Sunday of March. However, since this often coincides with the 8 March (International Women’s Day) holiday, normal practice hitherto has been to shift it to a week earlier. The presidential election law was amended in 2017 to state that the election should be held one week later ‘if this Sunday falls on a week that includes a public holiday’ (Art 5.7) – which the second Sunday of March does every year. In 2018, the following Sunday happened to be the symbolic date of 18 March, the anniversary of Crimea’s
incorporation into the Russian Federation. Although Crimea’s status as Russian is not recognised by the international community, its de facto accession is still highly popular inside the country. In March 2018, 86 percent of Russians indicated approval, and only 14 percent thought it contravened international law (Aleksei Levinson, “‘86% za ‘Krymnash’”, Vedomosti, 3 April 2018,
https://www.vedomosti.ru/opinion/columns/2018/04/03/755654-krimnash (accessed 15 June 2018)). 3 Following the December 2011 parliamentary elections, brief but high-profile protests against perceived voter fraud briefly caught the Kremlin unawares. See Samuel A. Greene, “Beyond Bolotnaia: Bridging Old and New in Russia’s Election Protest Movement”, Problems of Post-Communism 60, no. 2 (2013): 40-52; Stephen White and Ian McAllister, “Did Russia (Nearly) have a Facebook Revolution in 2011? Social Media’s Challenge to Authoritarianism", Political Studies, 34, no. 1 (2014): 72-84.
White have demonstrated,4 UR’s overwhelming victory owed much to the fact that apathy was at its highest where support for UR was at its lowest – allowing the party to pick up many votes from a narrow base of high-turnout regions, while the opposition parties failed to gain as many votes in regions where they were relatively popular. Building on this passive pro-Kremlin electoral support – while drawing more people out to vote – became key to ensuring Putin’s success in 2018, since mobilising the passive Putin supporters would be key to ensuring high vote shares.
Following the protests that ended the previous electoral cycle, the Central Electoral Commission (CEC) and government authorities put more focus on ensuring the public transparency and integrity of the electoral process in 2016 and 2018. Vladimir Churov, the controversial chairman of the Central Electoral Commission (CEC), was replaced in March 2016 by Ella Pamfilova, a 1990s government minister who had more recently been Russia’s Human Rights Commissioner. Pamfilova’s presence sought to reassure voters and the international community about Russia’s commitment to the electoral rule of law.5 As we shall see later, to some extent this succeeded.
The basic electoral system for the 2018 election was as before – a majoritarian election across the whole Russian Federation, with a second-round run-off if no candidate received more than 50 percent in the first round. But there were several changes to the detail of the election
4 Ian McAllister and Stephen White, “Demobilizing Voters: Election Turnout in the 2016 Russian Election”,
Russian Politics 2, no. 4 (2017): 411-433.
5 OSCE/ODHIR, Russian Federation. State Duma Elections. 18 September 2016. OSCE/ODIHR Elections
Observation Mission. Final Report (Warsaw: ODIHR, 2016),
law between 2012 and 2018 which were important in shaping the campaign and result.6 In summary, the following innovations were introduced:7
• A reduction from 2 million signatures required to apply for nomination, to 100,000 for representatives of non-parliamentary parties, and 300,000 for self-nominated (non-party) candidates.8
• A prohibition on the candidacy of individuals convicted of grave or especially grave crimes within 10 and 15 years (respectively) from the date of the expiry of their conviction.
• Requirements to document the ownership of property or assets abroad, and to close any foreign bank accounts before submission of registration documents.
• Changes to electoral campaigning rules, which treated online media similarly to printed press, and prohibited the use of statements by private persons in campaign materials.
• A revised system for absent voting, to create a unitary database which granted the absent voter the right to vote at a specific nominated polling station only (except if they applied in the last five days before polling day).9
• Restrictions on some aspects of electoral monitoring (journalists attending electoral commission meetings needed to have been employed for at least two months prior to
6 As in previous years, the legal framework around the presidential election was regulated by a special law placed on top of the underlying framework election legislation of the Russian Federation See Federal’nyi zakon “O vyborakh Prezidenta Rossiiskoi Federatsii”, Federal Law No. 19-FZ (10 January 2003) with 27 amendments up to 5 December 2017 (latest version available at
http://ivo.garant.ru/#/document/185413/paragraph/1231053:0, accessed 13 June 2018); Federal'nyi zakon “Ob osnovnykh garantiyakh izbiratel'nykh prav i prava na uchastie v referendume grazhdan Rossiiskoi Federatsii”, Federal Law N67-FZ (12 June 2002) with 88 amendments up to 1 June 2017 (latest version – also with subsequent amendments – available at http://www.consultant.ru/document/cons_doc_LAW_37119/, accessed 22 June 2018).
7 A. Lyubarev (2017), Analytical Report on Crucial Changes in Legislation Regarding Russian Presidential
Elections of 2018 as Compared to Elections of 2012 (Moscow: Golos, 2017).
8 Parliamentary parties retained the privilege of being able to nominate candidates without signatures 9 The previous system – in which Absent Voting Certificates (AVCs) had to be obtained from the voter’s home polling station or electoral commission, and could be used to vote at any polling station in the electoral district, was alleged to be the source of widespread abuse and double voting.
the official announcement of the election) countered by enhanced oversight in other respects (regulations on remote video monitoring of polling stations through
webcams, and a guarantee of early access to the polling station for monitors). • A reduction in the time limit for appeals on election results from 1 year to 10 days. Although seemingly minor, some of the alterations had an impact on the campaign. A controversial unspent conviction, for instance, excluded one of the main potential candidates – Aleksei Naval’nyi – from being eligible to stand. Among the potential candidates,
prominent businessmen were discouraged from even attempting to register by the
requirement to liquidate assets abroad without a reasonable guarantee of registration. The rules on foreign bank accounts also caught out the Communist Party of the Russian Federation’s (CPRF) candidate, as we shall see below. In short, these seemingly minor amendments to the electoral law had the effect of seriously discouraging any potentially credible candidates from standing against Putin.
The Election Campaign
Although there were 70 expressions of interest in submitting documents, and 17 candidates got as far as opening special election accounts,10 in the end only eight candidates were registered. This was, however, three more candidates than stood in the 2012 election. One notable absentee from the ballot was Aleksei Naval’nyi, the self-styled “democratic nationalist” opposition leader, who had arguably been the most prominent extra-systemic critic of the Kremlin for several years. Naval’nyi initially came to prominence as a lawyer and anti-corruption campaigner, and his condemnation of United Russia in 2011 as the “party of crooks and thieves” drew widespread attention at the time.11 In his only direct foray into electoral politics, he came second in the Moscow mayoral election in 2013, winning an unexpectedly high 27.2 percent of the vote, but failed to force a second round against the incumbent mayor, Sergei Sobyanin. Thereafter, through his Anti-Corruption Foundation, he published high-profile allegations about several prominent public officials, most notably
10 Arkadii Kuznetsov, “Ne vse na vybory”, Profil, 5 February 2018,
http://www.profile.ru/politika/item/124571-ne-vse-na-vybory (accessed 13 June 2018).
11 Aleksei Naval’nyi, “Pil, RosPil, osvoenie. Intervyu s Naval’nym”, Finam 99.6am Radio. Video recording of interview, 2 February 2011, https://www.youtube.com/watch?v=leHWbcmd74E, accessed 15 June 2018.
prime minister Dmitrii Medvedev in spring 2017. These led to brief public protests, but were dismissed by Medvedev himself as “compote”.12
Naval’nyi’s provocative stance against the regime meant that he was arrested several times from 2012 onwards over protest activity and charged with administrative offences. More serious were several convictions in which he himself was charged with corruption. Of particular significance was a suspended five-year prison sentence from 2013, relating to allegations of embezzlement from the Kirovles forestry company in Kirov province. Naval’nyi, who claimed that the allegations were politically-motivated, appealed to the European Court of Human Rights and, following its verdict in early 2016 that the original trial had been flawed, the verdict was overturned by the Russian Supreme Court in November 2016.13 However, the case was retried and the sentence reinstated in early 2017, a verdict he again appealed.14 After much speculation, his candidacy attempt was officially declared invalid by the CEC in December 2017, on the grounds that he was still under sentence for a “grave” crime, which disbarred him from passive electoral rights.15 (Whether or not the charges themselves were justified, it is worth noting that the principle of disenfranchisement itself is not unusual; 16 countries of the European Union at least partially disbar certain categories of convicted criminals from either voting or candidacy.16) Once excluded, Naval’nyi called for a boycott of the election in an (unsuccessful) bid to reduce the turnout.
12 Natal'ya Demchenko, “Medvedev nazval ‘kompotom’ rassledovanie Naval’nogo o ego sobsvennosti”, RBK, 4 April 2017, https://www.rbc.ru/politics/04/04/2017/58e39ba59a79474e0de95933
(accessed 22 June 2018).
13 European Court of Human Rights, “Opposition activist’s conviction of embezzlement: result of arbitrary application of the law”, ECtHR Press Release 071 (2016), 23 February 2016.
14 Margarita Alekhina, Natalia Galimova and Ilya Rozhdestvensky, “Naval'nyi poluchil pyat' let uslovno po ‘delu “Kirovlesa”’”, RBC, 8 February 2017, https://www.rbc.ru/society/08/02/2017/589890179a7947795fb26569, (accessed 15 June 2018).
15 Central Electoral Commission of the Russian Federation, “Postanovlenie ‘Ob otkaze v registratsii gruppy izbiratelei, sozdannoi dlya podderzhki samovydvizheniya kandidata na dolzhnost' Prezidenta Rossiiskoi Federatsii Alekseya Anatol'yevicha Naval'nogo, i ee upolnomochennykh predstavitelei”, No. 118/973-7, 25 December 2017, Vestnik Tsentral’nogo Izbiratel’noi Komissii Rossiiskoi Federatsii No. 1(367), 2018: 197. Available at http://vestnik.cikrf.ru/upload/iblock/vest_01_2018.pdf (accessed 15 June 2018).
16 Jean-Thomas Arrighi, Rainer Bauböck, Michael Collyer, Derek S. Hutcheson, Lamin Khadar, Madalina Moraru, and Jo Shaw, Franchise and Electoral Participation of Third Country Citizens Residing in the European Union and
Of the eight candidates who were in the end registered, the most prominent was of course the incumbent president Vladimir Putin, who chose to stand as a self-nominated candidate, rather than taking advantage of the automatic right of the United Russia party to nominate him (which had been his strategy in 2012). This required Putin to collect the 300,000 valid signatures for such a venture. He achieved this with some margin to spare, and only 0.39 percent of the submitted 314,839 signatures were found to be invalid by the CEC.17 Alongside Putin on the ballot paper were seven other candidates. Two were perennial
presidential election stalwarts: Vladimir Zhirinovsky and Grigorii Yavlinsky. The former, the firebrand nationalist leader of the parliamentary Liberal Democratic Party of Russia (LDPR), was standing for the sixth time since 1991; and latter, the former Yabloko leader, returned for his fourth attempt at winning the presidency since 1996. Another perennial was the
Communist Party of the Russian Federation (CPRF), which in this case broke with tradition. Rather than fielding its veteran 73-year-old leader Gennadii Zyuganov for his fifth
presidential bid in 22 years, it instead nominated Pavel Grudinin, the director of the Lenin Collective Farm on the outskirts of Moscow. He had strong credentials as a “social
entrepreneur”; the farm had been transformed from a Soviet-era behemoth into a highly profitable enterprise where the standard of living of its inhabitants was well above the Russian average. But his acknowledged wealth (and also some undisclosed foreign bank accounts that surfaced during the campaign18) hindered his attempt to position himself as the representative of the main anti-capitalist opposition party.
of EU Citizens Residing in Third Countries. (Brussels: European Parliament, 2013),
http://www.europarl.europa.eu/RegData/etudes/etudes/join/2013/474441/IPOL-AFCO_ET(2013)474441_EN.pdf (accessed 15 June 2018).
17 Central Electoral Commission of the Russian Federation, “Postanovlenie ‘O registratsii kandidata na dolzhnost' Prezidenta Rossiiskoi Federatsii Vladimira Vladimirovicha Putina’”, No. 137/1127-7, 6 February 2018, Vestnik Tsentral’nogo Izbiratel’noi Komissii Rossiiskoi Federatsii No. 6 (372), 2018: 4,
http://vestnik.cikrf.ru/upload/iblock/vest_06_2018.pdf (accessed 15 June 2018).
18 Grudinin declared in his property and income declaration on 8 January that he did not hold any foreign bank accounts, but the Swiss authorities notified the Russian ones of the existence of 13 such accounts with 55 million roubles in them as of 31 December 2017. Whether or not they had been closed in the intervening week between the two declarations became a matter of some intrigue. Rather than disbar him from the election, the CEC incorporated the details of the omission on his income declaration (Vladimir Dergachev and Ekaterina
The other four candidates either represented throwbacks to the past, or were newcomers to the federal political scene. In the former camp were Maksim Suraikin, leader of the spoiler Communists of Russia party, and Sergei Baburin, a nationalist who was at one point a deputy speaker of the State Duma, but had largely faded from political prominence after the mid-2000s. The remaining two candidates were broadly liberal in their outlook. Despite the miserable showing of his minor Party of Growth in 2016 (which won just 1.3 percent of the vote), Boris Titov, the Presidential Commissioner for Entrepreneurs’ Rights, put himself forward as a candidate to promote the Stolypin Club’s economic growth strategy.19 Of perhaps the most interest – particularly to liberals and the Western media – was the presence on the ballot paper of Ksenia Sobchak. In a Shakespearian twist, Sobchak was the daughter the late Anatolii Sobchak, former St Petersburg mayor and erstwhile mentor of Vladimir Putin. She had reinvented herself from a socialite and reality television star into an opposition journalist, and her candidacy marked a further step in this rebranding. In the absence of Naval’nyi, she tried to claim the mantle of the liberal opposition figure in the election – though Naval’nyi excoriated her as a “caricature liberal” whose undermining of his call for a boycott rendered her, in his opinion, “an instrument of Putin”.20
With the nomination of the eight candidates, the formal election campaign proceeded as scheduled. There were several debates among the candidates on various state television channels – but in the absence of Putin, who declined to take up his allocated airtime, these lacked much impact. The format gave the candidates scrupulously identical airtime to respond one-by-one to each question, but this made for a lack of interaction between them. Zhirinovsky compared the format to a school classroom, and Pavel Grudinin left the debate studio in protest on 28 February, and only sent a representative in his place for the next one
Kopalkina, “Sbilsya so schetov”, RBC, 5 March 2018,
https://www.rbc.ru/newspaper/2018/03/06/5a9d4e9b9a79474ac8bee786 (accessed 15 June 2018)). 19 In spring 2017, Putin consulted with prominent economists about strategies for accelerating Russia’s economic growth. Among these were plans from Dmitrii Medvedev, former finance minister Aleksei Kudrin, and the Stolypin Club, an discussion club of prominent entrepreneurs and public officials (Kathryn Hille, “Kremlin gathers experts to tackle Russia’s anaemic growth”, Financial Times, 31 May 2017,
https://www.ft.com/content/590a20c4-43a4-11e7-8d27-59b4dd6296b8, accessed 15 June 2018). 20 Pavel Bosisov, “Spor Sobchak i Naval’nogo. Kratkii (naskol’ko vozmozhno) pereskaz”, Meduza, 18 March 2018, https://meduza.io/feature/2018/03/18/spor-sobchak-i-navalnogo-kratkiy-naskolko-vozmozhno-pereskaz (accessed 22 June 2018).
(but was back in place for later debates).21 Several debates descended into farce as the candidates shouted over each other to the point of inaudibility. The televisual highlights mainly involved Zhirinovsky and Sobchak sparring. Toward the end of the campaign (15 March, Rossiya-1), the latter was moved to tears by constant heckling from the LDPR leader. This was the culmination of an ongoing argument between them which had begun a few days earlier when Zhirinovsky, in a furious rage, had called Sobchak a “whore” and been rewarded by her with a glass of water in his face.
Putin boycotted the debates, remaining aloof while his rivals squabbled like unruly
schoolchildren. This decision further emphasised Putin’s well-crafted image as a stabilising force in a volatile political landscape, though it also further reduced the possibilities for interaction among the candidates. Lacking even a formal election programme, he engaged in very little overt campaigning, beyond a single campaign rally in Moscow on 3 March and a two-minute oration in Crimea a few days later. But as the incumbent president, his activity and media coverage were extensive. He received ten times more mentions in the media than any other candidate, and was the subject of between one-third and two-fifths of all television coverage on the main channels.22 Alongside the conveniently-timed re-run on state television of his 2017 interview with Oliver Stone,23 there was also a 2-hour feature film about him on prime-time television. His annual Address to the Federal Assembly, broadcast live on 1 March, was also something of a blockbuster production. It culminated with animations of
21 A recording of the debate – put online by Ksenia Sobchak – is available at
https://www.youtube.com/watch?time_continue=2321&v=Gy0CM-093tk, accessed 23 March 2018. The walkout occurs around 40 minutes into the recording.
22 Golos, Analiticheskii doklad Soblyudeniye ravenstva prav kandidatov v sredstvakh massovoi informatsii na
vyborakh prezidenta Rossii 2018 goda (Moscow: Golos, 2018), https://www.golosinfo.org/ru/articles/142634, (accessed 15 June 2018); OSCE/ODIHR, Russian Federation. Presidential Election. 18 March 2018. ODIHR
Election Observation Mission Final Report (Warsaw: ODIHR, 2018): 16,
https://www.osce.org/odihr/elections/383577 (accessed 15 June 2018).
23 The CEC adjudged that the Stone interviews did not technically suggest that voters should vote “for” or “against” Putin, thus did not count as election advertising. It nonetheless advised (after three of the four parts had already been broadcast) that the rest of the screening should be postponed until after the election (Central Electoral Commission of the Russian Federation, “Sostoyalos' 141-e zasedanie Tsentral'noi izbiratel'noi komissii Rossiiskoi Federatsii”, 14 February 2018, http://www.cikrf.ru/news/cec/39054/, accessed 15 June 2018.)
new advanced weaponry that he claimed could evade interception by anti-ballistic missiles of other countries and keep Russia secure from any threat.24
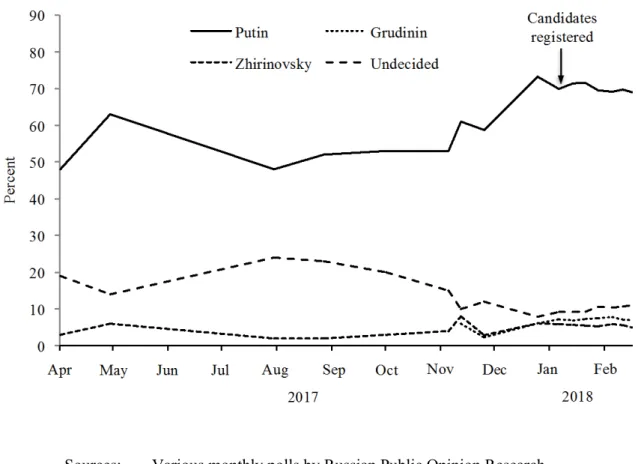
Figure 1. Voting Intention, April 2017-March 2018
Sources: Various monthly polls by Russian Public Opinion Research Center (WCIOM, https://wciom.ru) and Levada Center
(https://www.levada.ru).
Putin began the campaign as the favourite and remained far ahead of the others throughout. As figure 1 shows, for over a year before the election surveys asking people about which hypothetical candidate they would vote for showed very similar results to the final election outcome (Grudinin is only listed from December 2017, but the CPRF’s likely candidate until
24 Vladimir Putin, “Presidential Address to the Federal Assembly”, 1 March 2018,
http://en.kremlin.ru/events/president/news/56957 (accessed 15 June 2018). The speech had been postponed from the previous December and the other candidates – most notably Grigorii Yavlinsky – complained about the extra 7.5 hours of prime-time television coverage that Putin derived from it (Vladimir Dergachev, “‘Yabloko’ poprosilo sud obyazat' ‘Pervyy kanal’ vzyat' interv'yu u Yavlinskogo”, RBC, 14 March 2018,
that point – Gennadii Zyuganov – was polling no better prior to that). In April 2017, just after the March protests against corruption, around half of the respondents were prepared to vote for Putin (assuming he were to stand). Support for Putin increased throughout 2017, and had stabilised by the time the candidates were formally registered in early February 2018. There was very little change during the election campaign itself.
While Putin remained the preferred candidate by far, several of the other candidates provoked reactions among the electorate. Grudinin and Zhirinovsky were viewed positively and
negatively by between 13 and 17 percent of the electorate, respectively, with the clear majority ambivalent. At opposite extremes, however, Putin was viewed positively by 72 percent of respondents, and disliked by only 6 percent, while Sobchak polarised people in the opposite direction. Some 57 percent of respondents noted that they related negatively to her (and only 2 percent positively).25 Clearly, Sobchak’s involvement in the campaign had created some emotional reaction amongst voters who were otherwise unmoved, and this negative reaction may have helped mobilise anti-liberal voters to turn out.
Two other factors played a role in mobilising voters. The first was a major “get out the vote” campaign organised by the electoral and civic authorities. These authorities had already plastered many cities and towns with posters about the election long before the four-week final campaign had begun, and augmented this with messages on public transport, SMS targeting, trinkets, and even special election-promoting milk cartons.26 Moreover, issues of local interest – such as voting to choose between town renovation projects that were to be funded through the Comfortable Town Environment (Komfortnaya gorodskaya sreda) programme – were in some cases appended onto the presidential election, thus providing voters with a further incentive to go to the polling stations.
The second factor was external. Two weeks before polling day, retired double-agent military intelligence officer Sergei Skripal’ and his daughter were poisoned with a nerve agent in Salisbury in the United Kingdom. In the following days, Britain’s rhetoric became
25 FOM (Foundation of Public Opinion), “Prezidentskie vybory – 2018. Opros 11 marta”, 11 March 2018,
http://fom.ru/Prezidentskie-vybory-%E2%80%93-2018/13942 (accessed 23 March 2018, now removed). 26 OSCE/ODIHR, ODIHR Election Observation Mission Final Report: 11.
increasingly bellicose towards Russia, which it accused of orchestrating the affair.27 After Prime Minister Theresa May had given Russia an ultimatum to explain itself, and expelled 23 Russian diplomats, the Foreign Secretary Boris Johnson then all-but accused Putin of murder, stating that he thought it “overwhelmingly likely” that the president had authorised the
assassination attempt personally.28 These accusations, given prominence in the Russian state media and treated as farcical, were also given a contemptuous response from the Russian Ministry of Foreign Affairs and later by Putin himself.29 As with ongoing economic
sanctions, the perception of outside interference in Russian affairs may actually have had the effect of mobilising voters in Putin’s support. A survey two weeks after the election found that most people had heard of the allegations, but only 10 percent believed Russia to have been involved. Negative attitudes to the United Kingdom had also increased significantly.30 The Election Result
The scale of Putin’s victory is apparent from table 1. More than three out of every four voters cast their ballot for him, and his margin of victory over the second-placed candidate,
Grudinin, was nearly 65 percent of the vote. Putin’s tally of 56.4 million votes represented not just a post-Soviet record, but also meant that – for the first time – he enjoyed the support
27 Ewen MacAskill, “Russia should 'go away and shut up', says UK defence secretary”, The Guardian, 15 March 2018, https://www.theguardian.com/politics/2018/mar/15/russia-ripping-up-the-international-rule-book-says-defence-secretary (accessed 15 June 2018);
28 Jessica Elgot and Ewen MacAskill, “'Overwhelmingly likely' Putin ordered spy attack, says Boris Johnson”, The
Guardian, 16 March 2018, https://www.theguardian.com/politics/2018/mar/16/overwhelmingly-likely-putin-ordered-spy-attack-says-boris-johnson (accessed 15 June 2018).
29 First Channel, “Moskva ne namerena otvechat’ na ul’timatum Londona. Poslu Velikobritanii v RF zayavlen reshitelnyy protest”, 13 March 2018,
https://www.1tv.ru/news/2018-03-13/342320-moskva_ne_namerena_otvechat_na_ultimatumy_londona_poslu_velikobritanii_v_rf_zayavlen_reshitelnyy_pr otest (accessed 15 June 2018).
30 Levada-Center, “Boleye poloviny rossiyan stali plokho otnosit'sya k Velikobritanii”, 5 April 2018,
https://www.levada.ru/2018/04/05/bolee-poloviny-rossiyan-stali-ploho-otnositsya-k-velikobritanii/print/
of more than half the total electorate (108.7 million people), not just those that turned out to vote.31
Table 1. Presidential Election Result, 18 March 2018
Candidate Party Percent
Vladimir Putin Independent/Self-nominated 76.69
Pavel Grudinin Communist Party of the Russian Federation 11.77 Vladimir Zhirinovsky Liberal Democratic Party of the Russian Federation 5.65
Ksenia Sobchak Civic Initiative 1.68
Grigorii Yavlinsky Yabloko 1.05
Boris Titov Party of Growth 0.76
Maksim Suraikin Communists of Russia 0.68
Sergey Baburin Russian All-People’s Union 0.65
Invalid votes 1.08
---
Total 98.93
Turnout 67.50
Source Central Electoral Commission32
Even by their own low expectations, the candidates from the parliamentary opposition parties performed very poorly. Vladimir Zhirinovsky’s sixth attempt to become Russian president was his least successful yet; he won just 5.7 percent of the vote. The Communists’ decision to run with Pavel Grudinin, rather than Zyuganov, did not yield them any obvious benefit. On
31 Three months before the election, the first deputy head of the presidential administration, Sergei Kirienko, unveiled the Kremlin’s “70/70” strategy to a seminar of regional vice-governors: the aim of obtaining 70 percent of the vote on a 70 percent turnout. In the event the turnout was slightly lower than this but with a higher share of the vote. (Natal’ya Galimova, “V Kremle obsudili poluchenie 70% golosov za svoevo kandidata na vyborakh”, RBK, 26 December 2017, https://www.rbc.ru/politics/26/12/2016/58600eff9a794781b168ae26
(accessed 22 June 2018)).
32 Central Electoral Commission of the Russian Federation, “Postanovlenie ‘O rezul'tatakh vyborov Prezidenta Rossiiskoi Federatsii, naznachennykh na 18 marta 2018 goda’”, No. 152/1255-7, Vestnik Tsentral’nogo
Izbiratel’noi Komissii Rossiiskoi Federatsii No. 8(375), 2018: 176-79. Candidates’ official shares of the vote are
denominated from the total number of ballots given out, in which 1.08 percent invalid papers are included, and thus do not add up to 100 percent.
the contrary, he obtained the party’s worst ever presidential election result. Perhaps indicative of the low expectations the main opposition had, and their comfortable positions as
parliamentary parties, they did not seem particularly upset. Ivan Mel’nikov, the CPRF’s Vice-Speaker in the State Duma, argued that the result “could not be called unsuccessful”, leading one to wonder what other adjective might better describe a situation in which a party’s candidate wins six times fewer votes than his nearest rival in a national election. Despite Zhirinovsky’s worst election voting figures in more than 25 years, the LDPR was happy that it had “retained more votes than others” and come third.33 The perennial splits amongst the liberal opposition were also evident in Ksenia Sobchak’s delight in election night interviews at claiming “first place among the liberal candidates” – oblivious to the fact that the entire group of liberal candidates (herself, Grigorii Yavlinksy and Boris Titov) had won just 3.5 percent of the vote among them.
Despite effectively being declared a “one horse race”, turnout was a respectable 67.5 percent. This was higher than in 2012, and also considerably higher than the 47.9 percent recorded in the 2016 Duma election. As figure 2 shows, it was also the first time that turnout in
parliamentary and presidential elections had moved in opposite directions in the same electoral cycle. As noted earlier, the comparative research tells us that the absence of competition usually decreases the incentive to turnout to vote. In this case, the expectation was confounded, suggesting that voters felt the election was sufficiently important to cast a ballot.
33 Yulia Makarova, Elena Ladilova, Angelina Galanina and Konstantin Dorofeev, "Izbiratelyam ne khvatilo partii", Izvestiya, 23 March 2018: 1, https://iz.ru/722477/iuliia-makarova-elena-ladilova-angelina-galanina-konstantin-dorofeev/izbirateliam-ne-khvatilo-partii (accessed 15 June 2018).
Figure 2. Turnout in Russian Elections, 1991-2018
Source: International IDEA.34
One possible explanation for the relatively high turnout in 2018 was a continuation of the very marked patterns of differential regional turnout that occurred in the 2016 State Duma election, and to a lesser extent in the 2012 presidential election. In effect, in areas where turnout was low, these followed the traditional theory—i.e., in the absence of competition, people were more likely to stay away from the polls out of lack of intrigue. In areas where turnout was high, this may have been because the authorities are traditionally effective at mobilising the vote for Putin, as they did in 2016 for UR. An in-depth analysis of the patterns of turnout and support for Putin indicates that it was not monolithic; indeed, there was a close connection between the areas in which he won most support, and areas where people turned out in higher numbers. It is to this regional relationship that we now turn.
34 International IDEA, Voter Turnout Database, https://www.idea.int/data-tools/data/voter-turnout (accessed 22 June 2018).
The Regional Effect
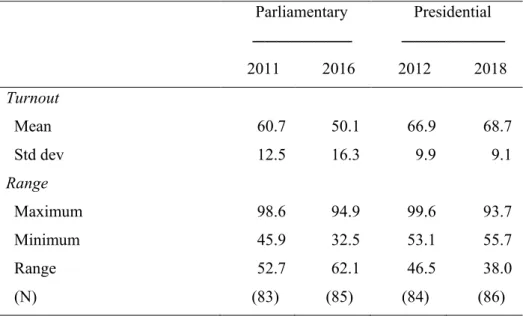
Russia is divided into 85 regions (two of which – the Republic of Crimea and the federal city of Sevastopol – were new compared with the 2012 election).35 Observing the turnout and the election results for each of them allows us to construct a more nuanced picture of the patterns of support for Putin (and the other candidates) across the Russian Federation. The range of turnout in 2018 was in fact narrower than in the 2012 presidential election and particularly the 2016 State Duma election. Parliamentary elections, as can be seen in table 2, generally exhibit more fluctuations in turnout compared to presidential ones. In 2016, turnout was particularly low in many regions, with more than two out of three voters failing to go to the polls in Moscow and St Petersburg, and turnouts below 40 percent were recorded in many other provinces. By contrast, even in the lowest turnout region in 2018 – Irkutsk Province – 55.7 percent of the electorate participated, meaning that the majority of people voted in every region of Russia.
Patterns of differential turnout are not new, as tables 2 and 3 demonstrate. In the top five regions in 2018, table 3 shows that turnout was 90 percent or more – which is in line with countries such as Australia and Belgium that have systems of enforced compulsory voting.36 These are exceptional levels of turnout in a voluntary voting system. Eight of the ten regions where turnout was over 80 percent were national republics at the borders of Russia, either in the north Caucasus (Kabardino-Balkariya, Chechnya, North Ossetia-Alanya, Dagestan, Karachaevo-Cherkessiya, and Ingushetiya) or, in the case of Tyva, at the Mongolian border. Other geographically remote regions – the Chukotka Autonomous District and the Yamalo-Nenets Autonomous District in the Arctic – were also within this top group. These regions are well-known for their regular strong electoral support for the regime, a factor that is often
35 These two regions are not internationally recognised as belonging to Russia, but (without taking judgement on this) they are included in the analysis, as the electoral figures used in the analysis would otherwise deviate from the official results. In addition to the 85 regions, the city of Baikonur (which is rented by Russia from Kazakhstan) is listed separately from the rest of Russia and is included in the overall result – making 86 units of analysis.
36 See Sarah Birch, Full Participation: A Comparative Study of Compulsory Voting (Manchester: Manchester University Press, 2009); Ian McAllister, The Australian Voter: Fifty Years of Change (Sydney: University of New South Wales Press, 2011).
attributed to the effectiveness of “machine politics” in getting out the vote.37 They are also the regions that – on other quality of governance indicators – generally come at one end of the spectrum in terms of bureaucratic impartiality among the 85 regions of Russia.38
Table 2. Regional Turnout, 2011-2018 (Percent)
Parliamentary Presidential --- --- 2011 2016 2012 2018 Turnout Mean 60.7 50.1 66.9 68.7 Std dev 12.5 16.3 9.9 9.1 Range Maximum 98.6 94.9 99.6 93.7 Minimum 45.9 32.5 53.1 55.7 Range 52.7 62.1 46.5 38.0 (N) (83) (85) (84) (86)
Figures are based on the number of federal subjects (regions) and electoral units that were reported at the time of the election.
Source Central Electoral Commission (2017, 2018); Electoral Geography 2.0 (2012).39
37 Grigorii V. Golosov, “Machine Politics: The Concept and Its Implications for Post-Soviet Studies”,
Demokratizatsiya, 21, no. 4 (2013): 459-81.
38 Marina Nistotskaya, Anna Khakunova and Carl Dahlström, Expert Survey on the Quality of Government in
Russia’s Regions: A Report, Quality of Government Institute Working Paper 2015:16 (2015), Gothenburg,
https://qog.pol.gu.se/digitalAssets/1549/1549833_2015_16_nistotskaya_kahkhunova_dahlstr--m.pdf, (accessed 16 June 2018).
39 Central Electoral Commission of the Russian Federation, Vybory deputatov Gosudarstvennoi Dumy
Federal’nogo Sobraniya Rossiiskoi Federatsii sedmogo sozyva. 2016. Elektoral’naya statistika (Moscow: CEC,
2017); Central Electoral Commission of the Russian Federation, “Postanovlenie ‘O rezul'tatakh vyborov Prezidenta Rossiiskoi Federatsii…’” (2018); Electoral Geography 2.0, “Russia. Presidential Election 2012”,
https://www.electoralgeography.com/new/en/countries/r/russia/russia-presidential-election-2012.html
(accessed 22 June 2018). Note: the mean figures are slightly different to overall national turnout, since turnout is averaged across regions, rather than aggregated across the whole country.
It is easy to focus on such outlying cases and miss the fact that such exceptional turnout levels were not the norm. With a variation of 38 percent, there was still a considerable difference in activity levels between the 93.7 percent turnout in Tyva and the 55.7 percent in Irkustsk Province, even if the latter still represents – by international standards – a
respectable level of participation. The lower-turnout regions (below 60 percent) were
generally mid-Russian provinces, or regions that have traditionally been less known for their centralised bureaucratic machines (such as the Republic of Karelia, which has considerable political and economic interaction with Finland). Moscow and St Petersburg, which had among the lowest turnouts in the 2016 State Duma election, also had below-average
participation rates in 2018 (59.9 percent and 63.9 percent respectively), but they were not at the very bottom of the list, and returned to their equivalent 2012 levels. Both were affected by the new rules on absent voting; Moscow had a net surplus of approximately 175,000 people who voted there from other regions, while the opposite was the case in St Petersburg.40
Table 3. Top and Bottom Five Regions in 2018 Turnout
2018 2016
--- ---
Region Rank Turnout Rank Turnout
Republic of Tyva 1 93.7 4 89.7
Yamalo-Nenets AO 2 91.9 12 74.3
Rep. Kabardino-Balkaria 3 91.8 3 90.1
Chechen Republic 4 91.5 1 94.9
Rep. North Ossetia-Alania 5 90.0 7 85.6
Zabaikalsky Krai 82 58.0 69 38.9 Tver Province 83 57.6 52 41.6 Novgorod Province 84 57.3 83 39.8 Republic of Karelia 85 57.2 64 39.6 Irkutsk Province 86 55.7 84 34.6
40 Committee for Civic Initiatives, Analiticheskii doklad “Osnovnye tendentsii i itogi vyborov prezidenta RF 18
marta 2018 goda (Moscow: KGN, 2018): 15,
Source: As for Table 2
The overall increase of 2.2 percent in aggregate turnout also disguises some rises and falls among the individual regions. Compared with 2012 (not including Crimea and Sevastopol’), 54 regions had higher turnout, and 29 saw reduced activity levels. The biggest gains were in the Republic of Kabardino-Balkariya (+18.7 percent), Stavropol’ Territory (+13.5 percent), Magadan, Bryansk and Vladimir Provinces and Perm Territory (all regions in which turnout rose between 11 and 13 percent). By contrast, in most of the areas with the biggest falls in turnout (of between 4 and 11 percent), it had already been exceptionally high in 2012 and remained above-average in 2018. The affected regions were the Republics of Mordovia, Tatarstan, the North Caucasus, but the exception was the Republic of Komi, where turnout fell between the two elections from 70.1 to 60.4 percent.
When we compare 2018 regional patterns of turnout in the most recent federal election – the 2016 State Duma – there is considerable continuity. Although the rank order changed slightly, eight of the top ten turnout regions in 2018 were also among the top 10 in 2016. Of the 10 regions with the lowest turnout in 2018, six were in the same category in 2016. The correlation between regional turnout in 2016 and 2018 was 0.882 (p<.000). However, in 2016, the standard deviation was larger than in 2018 (16.3 as compared with 9.1), which reflects the wider distribution of low turnout in the State Duma election compared with the presidential election. The correlation between turnout in 2012 and 2018 is also very high, at 0.879 (p<.000).
The existence of regions with consistently high turnout is noteworthy by itself, but its electoral significance is enhanced by the fact that there has in recent years been a high correlation between turnout and partisan and candidate voting patterns. The pattern that was observed in 2016, with United Russia winning a very substantial vote advantage in regions with a markedly higher turnout, was repeated in 2018 for Putin. Indeed, Putin’s support was much higher almost everywhere than UR’s vote in 2016.41 There was no region in Russia where the other candidates collectively won more votes than Putin alone did. He did exceptionally well in a handful of regions; in 22 areas he won over 80 percent of the votes
41 On average, his share of the vote was 25 percent higher than UR’s vote share in 2016, and 14.2 percent higher than the combined vote for UR, A Just Russia, Motherland, the Russian Party of Pensioners and Justice, Patriots of Russia and Civic Platform, all of which could be considered “satellites” of the main party of power.
cast, and of them, six returned votes for him of over 90 percent. Even in the region where he did worst (the Republic of Sakha), he won 64.4 percent of the votes cast.
Observing the patterns of regional support for Putin across the Russian Federation reveals some notable geographical patterns. Once again, Putin won his highest shares of the vote (more than 85 percent) in the ethnic republics around the North Caucasus and Tyva, and mid-Russian republics such as Tatarstan and Mordovia. Perhaps unsurprisingly, the Republic of Crimea and Sevastopol’ also voted in large numbers for him, awarding him 92.1 percent and 90.2 percent of the vote, respectively. And as in previous elections, Yamalo-Nenets featured in the top ten regions in their support for Putin. Overall, and repeating the 2012 and 2016 elections, there was a clear east-west distribution to Putin’s support base, with the Siberian regions on average voting about 5 percent less for him than the western regions.42
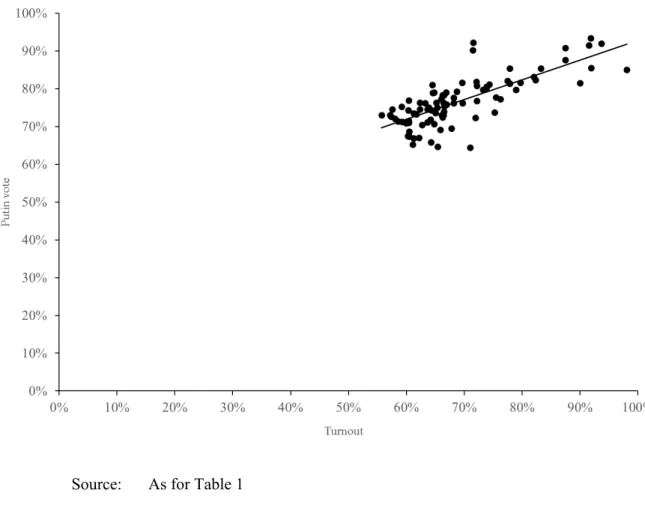
The presence of the same regions in the lists of high and low turnout areas and strong Putin-supporting regions suggests a connection between the two. Figure 2 demonstrates this by showing a significant positive correlation between the share of the vote for Putin and the level of turnout. Higher turnout provided a double advantage for Putin: a higher absolute number of votes were cast in these regions; and he won higher proportions of that higher number. Of the 43 regions in which Putin received enough support to have the votes of the absolute majority of the whole electorate (not just those that voted), turnout was above average in all but ten of them. Taken as a proportion of the whole electorate, he enjoyed the support of at least seven out of 10 adults in Tyva, the North Caucasus Republics, Kemerovo Province and Yamalo-Nenets. At the other end of the scale, his absolute support was lowest in Primor’e, the Jewish Autonomous Province, Irkutsk, Omsk and Sakhalin, where three out of five voters either voted for another candidate, or did not vote for anybody.
42 After Putin’s re-inauguration, the governor of Yamalo-Nenets (one of the best-performing regions for Putin support in the election) was appointed federal Minister for Natural Resources, while the governor of Sakha (location of the poorest result) was replaced.
Figure 2. Turnout compared with vote share for Putin, 2018 presidential election
Source: As for Table 1
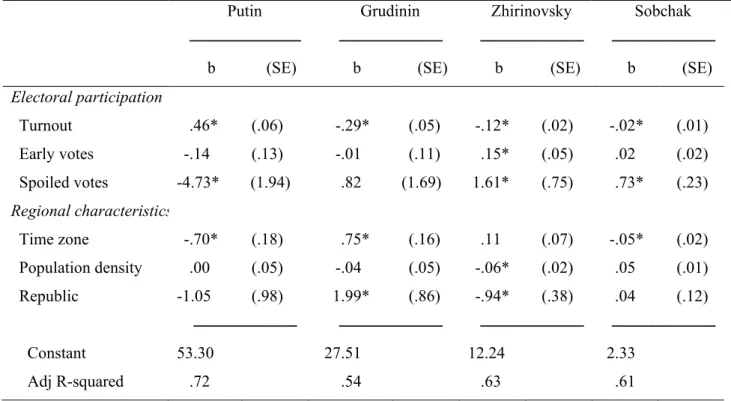
While differential turnout represented an important advantage for Putin, it was not as pronounced in 2018 as in 2016. In 2018 the lowest share of the vote for Putin in any region was 64.4 percent; by contrast, in 2016 United Russia’s large majorities in high-turnout regions easily cancelled out the effects of low-turnout regions in which the opposition collectively won more votes than the winner. Table 4 shows the predictors of support for the four leading candidates and suggests that Putin gained 0.46 percent extra votes for each 1 percent increase in turnout, net of other factors. The turnout effect is negative (and statistically significant, though lower) for the other three candidates. In other words, in regions where more voters turned out to vote, Putin gained a sizeable vote advantage, while the other three candidates lost votes.
Electoral Integrity
The finding that differential turnout mattered to the election outcome points, once again, to the role of election authorities and, more specifically, to their efforts to increase the turnout, particularly in areas of traditional Putin support. As noted earlier, several factors came
together to encourage turnout: direct encouragement to vote by the election authorities; easier access to absent voting; and, at the margins, removing duplicate or redundant entries from the electoral register.43 In and of itself, these mobilisation efforts may not reflect anything untoward. It was shown earlier that the vast majority of citizens had positive views of Putin, but it is not necessarily the case that all of these people would be inclined to vote. By
contrast, people who vote for opposition candidates are in the minority, and may hold stronger views about the political system which makes them more likely to cast their ballots as a protest regardless of the unlikely chance of success. It is probable that the majority of marginal votes from more passive voters would be therefore be cast for Putin, whose support is so broad and general that less committed voters – if pushed to do so – are more likely to lean towards him as the best candidate on offer.
There have traditionally been relatively few spoiled ballot papers in presidential elections, and this was also the case in 2018, at 1.08 percent of the votes cast. This is slightly lower than in previous elections, though generally in line with these results. As turnout goes up, typically, more people are brought to the polls who are less interested and informed, and therefore more likely to spoil their ballots by incorrectly filling them out.44 We would expect, then, that the higher the turnout, the higher the proportion of spoiled votes, and this is a common pattern across the advanced democracies.45 This did not occur in the 2018 Russian election, and the correlation of -0.636 (p<.000) suggests that as turnout increased, the proportion of spoiled votes actually declined.
A closer observation of the various regions shows that the lowest proportions of spoiled ballots were all in the North Caucasus — Kabardino-Balkariya, Chechnya, Ingushetiya, Karachaevo-Cherkessiya and Dagestan. As we have seen, these regions also exhibited high turnout and strong Putin support. Two factors may have been at work to explain this
43 Committee for Civic Initiatives, Analiticheskii doklad “Osnovnye tendentsii i itogi vyborov prezidenta RF 18
marta 2018 goda (Moscow: KGI, 2018): 17,
https://drive.google.com/file/d/1EMN1YPS5C9DjKRULeFrqwqViUit0mx7t/view (accessed 15 June 2018). 44 See Ian McAllister and Toni Makkai., “Institutions, Society or Protest? Explaining Invalid Votes in Australian Elections”, Electoral Studies 12, no. 1 (1993): 23-40; Fredrik Uggla, “Incompetence, Alienation or Calculation? Explaining Levels of Invalid Ballots and Extra-Parliamentary Votes”, Comparative Political Studies 41, no. 8 (2008): 1141-68.
intuitive finding. First, if we take opposition claims at face value, the high degree of official mobilisation may have led to people being assisted in completing their ballot papers to ensure that there were fewer errors. A related but more innocent explanation could be that, in regions dominated by strong political machines, election officials were more likely to give the benefit of the doubt to incorrectly completed ballot papers and count them as valid. In the better-governed regions, ballot errors may have been treated more stringently.
A second explanation may be that spoiled votes represented a protest against Putin. The regression analysis in table 4 predicts support for Putin across the region from a range of variables measuring electoral participation and regional characteristics. In the case of spoiled ballots, the partial coefficient is -4.73. This means that for each 1 percent increase in the percent of spoiled ballots, the vote for Putin decreased by 4.73 percent. While the overall number of spoiled ballots was remarkably small, so the gain for Putin was minor, this does suggest that a substantial proportion of these spoiled votes was cast in protest against Putin. There is a positive effect for spoiled votes on the Zhirinovsky vote, though not for the other two candidates. In the case of Zhirinovsky, this may reflect the fact that his supporters are older and less educated, and therefore more likely to incorrectly complete the ballot paper (their age is also shown in the positive effect for early voters, which usually correlates with older voters).
Table 4. Electoral and Regional Support for Putin, Grudinin, Zhirinovsky, Sobchak
Putin Grudinin Zhirinovsky Sobchak
--- --- --- ---
b (SE) b (SE) b (SE) b (SE)
Electoral participation Turnout .46* (.06) -.29* (.05) -.12* (.02) -.02* (.01) Early votes -.14 (.13) -.01 (.11) .15* (.05) .02 (.02) Spoiled votes -4.73* (1.94) .82 (1.69) 1.61* (.75) .73* (.23) Regional characteristics Time zone -.70* (.18) .75* (.16) .11 (.07) -.05* (.02) Population density .00 (.05) -.04 (.05) -.06* (.02) .05 (.01) Republic -1.05 (.98) 1.99* (.86) -.94* (.38) .04 (.12) --- --- --- --- Constant 53.30 27.51 12.24 2.33 Adj R-squared .72 .54 .63 .61 *, statistically significant at p<.05.
Notes: Ordinary least squares regression showing partial (b) coefficients and standard errors (SE) predicting the percentage vote. Turnout, early votes and spoiled votes is percent, time zone is ± hours UTC, population density is 100 persons per square kilometre, autonomous republic is zero or one. N = 86 regions.
Source: As for Table 1
In addition to the suspicion that at least some voters spoiled their votes in order to register a protest against Putin, the results in table 4 also indicate several other factors. Grudinin won a substantial part of his vote from remote regions that were further from Moscow to the east, while Putin’s vote came from regions closer to the west, and Zhirinovsky’s support was stronger in low population density regions, which suggests a strong rural component to his base of support. Sobchak’s vote was more likely to come from regions in the west.
Finally, did the voters regard the integrity of the election any differently than for previous Russian elections? The perceived fairness of previous elections has raised mixed views
among voters.46 When asked about the fairness of filling in of the ballot paper and the counting of votes, for example, the proportion seeing the process as “very fair” or
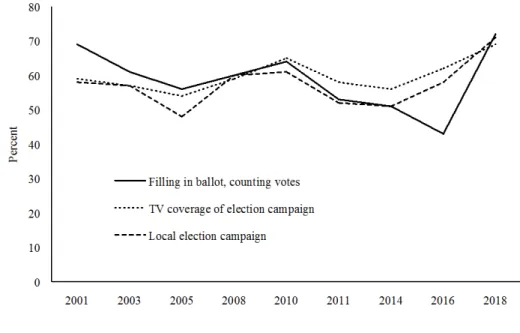
“reasonably fair” has declined consistently since the early 2000s. In 2001, figure 3 shows that 69 percent of the respondents regarded the process as fair, compared to just 43 percent in 2016 – a significant and important decline from previous elections. Indeed, in 2016 a majority of voters actually regarded the conduct of the election as having been unfair (even though the authorities were clearly striving for greater transparency than in the past). Perceptions of the television coverage of the election and the conduct of the local campaign were slightly more positive. Nevertheless, over the period of the surveys, barely half of all Russian voters have regarded these aspects of the various elections as fair.
Figure 3. Perceptions of Electoral Integrity, 2001-2018
Notes: The question was “In your opinion, to what extent are elections in Russia fair in relation to … the composition of the ballot paper and the counting of votes … the television coverage of the election campaign … the conduct of the electoral campaign in your district?” Sources Russian Election Surveys, 2001-201847
46 Ian McAllister and Stephen White, “Electoral Integrity and Support for Democracy in Belarus, Russia and Ukraine”, Journal of Elections, Parties and Public Opinion 25, no. 1 (2014): 78-96.
47 Ian McAllister, National representative survey, conducted on a nationally representative sample of the Russian Federation by R-Research, fieldwork 4-26 April 2018, N = 2,004 (funded by Australian National University). For
The 2018 shows a significant change in these opinions, with no less than 72 percent of respondents regarding the filling in of ballots and the counting of votes as fair—an increase of 29 percent on the 2016 Duma election. There are also increases, albeit less dramatic, in the proportion seeing the television coverage as fair (increase of 7 percent) and the local
campaign as fair (increase of 13 percent). Overall, then, the declining public views of electoral integrity appear to have been substantially arrested in 2018. The reasons for this change must remain speculative, but it may be that the CEC’s publicity campaigns to increase turnout, a new and seemingly more independent leadership within the CEC, and measures by the authorities to increase transparency in polling stations (such as webcams) may have changed Russians’ pessimistic views of the fairness of their elections.
Conclusion
At one level, the 2018 Russian presidential election was a non-event; once Putin had decided to run, there was no doubt that he would win. Changes to the electoral law plus Putin’s incumbency advantage and widespread public support were major disincentives for any candidate aspiring to mount a challenge. At another level, Putin did have an important electoral challenge ahead of him: to gain a majority of the votes based on a respectable level of turnout. In many important respects, then, the contest was not between Putin and the other candidates but between Putin and the level of election turnout. Anything less than a
respectable demonstration of support would undermine his legitimacy and cast doubt on his ability to serve effectively for a further six-year term as president, taking him to 2024. In the event, Putin won the election easily on a level of turnout that was in line with previous presidential elections, and substantially higher than the 2016 Duma State election. Moreover, the regime could justifiably claim that the level of turnout was higher than in the 2016 U.S. presidential election, when 65.4 percent of the enrolled electorate cast a ballot. Such an outcome was even more remarkable given that the outcome of the presidential election was a foregone conclusion. Two factors came together to create this fortuitous result for Putin. First, as in previous elections, differential turnout across the regions—with higher turnout in pro-Putin regions and lower turnout in regions where his support was lower—was important.
full bibliographical details of the series of 2001-16 national representative surveys, see Derek S. Hutcheson,
While the impact of differential turnout on the outcome was less than in previous elections, it has been a consistent component of Putin (and UR’s) electoral success.
The activity of the election authorities was a second factor that undoubtedly played a role in increasing the turnout. We know that citizens’ confidence in the independence and fairness of election procedures has a major impact on the level of electoral participation, as well as on public support for the system as a whole.48 In the Russian context, a new, more independent CEC head, major publicity campaigns about the importance of voting and more transparent polling day procedures all served to encourage voters to participate. This is reflected in the dramatic increase in the proportion of voters who saw the filling out of ballot papers and the counting the votes as fair. While changes to election laws clearly discouraged opposition candidates from nominating, voters still had a greatly enhanced view that the conduct of the election on polling day would be fairer than any Russian election in almost two decades. With Putin safely returned to the Kremlin for another six years, the political elites’ attention will now be moving to the next electoral hurdles: the 2021 State Duma election and the presidential election of 2024. The latter has particular significance, given that Putin will not be able to stand for a third consecutive term (and fifth overall) without legal changes. In the absence of an obvious credible successor or challenger, the main challenge for the Kremlin in the coming period will be to ensure that this potential rupture point is managed smoothly, at the same time as managing public expectations on policy outcomes.
The recent parliamentary and presidential elections suggest two possible strategies. First, the Kremlin can seek to can minimise opposition mobilisation, reduce the scope for potential challengers to emerge from outside the system, and rely on a narrow based of high-turnout regions to consolidate its position in a general atmosphere of indifference (as United Russia did in 2016). Alternatively, it can push strongly to mobilise its supporters to demonstrate that it maintains a substantial mandate across the whole country (as was done in 2018). That mandate can then be used to mobilise support behind a possible within-system successor to Putin (or justify his continued incumbency, should a legal way be found to facilitate this).49
48 See Pippa Norris, Why Electoral Integrity Matters (Cambridge: Cambridge University Press, 2014).
49 Putin has gone on record since his re-inauguration to confirm that he intends in the future, as he did in 2008, respect Russia’s constitutional provision that the president cannot serve more than two consecutive terms.
Finally, the strong focus on electoral integrity shows that a further lesson was learned from the previous election cycle: the legitimacy of the process matters as well as the result. There can be no doubt that after 18 years at the top of Russian politics, Putin’s renewed mandate will set up a fascinating dynamic for the possible transition to come.
(Vladimir Putin, “Meeting with Heads of International News Agencies”, transcript, 25 May 2018,