MULTIVARIATE ANALYSIS OF
FACTORS ASSOCIATED WITH
STUDENT’S EXPERIENCES OF
BEING BADLY TREATED,
HARASSED AND
DISCRIMINATED
- A SECONDARY ANALYSIS OF THE
MALMÖ UNIVERSITY STUDENT HEALTH
SURVEY
MULTIVARIATE ANALYSIS OF
FACTORS ASSOCIATED WITH
STUDENT’S EXPERIENCES OF
BEING BADLY TREATED,
HARASSED AND
DISCRIMINATED
- A SECONDARY ANALYSIS OF THE
MALMÖ UNIVERSITY STUDENT HEALTH
SURVEY
NATALIE RISTIC
Ristic, Natalie.
Victimization and discrimination at Malmö Högskola. An analysis of the student health service survey.
Master thesis in criminology, 30 points.
Malmö University: Faculty of health and society, Institution of criminology, 2017.
Abstract
International and national reports and research have shown that between 12-75 % of the students at universities have experiences of being badly treated/humiliated, harassed or discriminated by staff or fellow students, at least once during their university studies. A newly published report by Malmö university is of
importance because this report includes a broader range of variables that have a connection with experiences of being badly treated, harassed or discriminated. Nevertheless, the report is limited because the results are based on bivariate regression analysis on binary variables and thus, does not control for other correlated variables. The aim of the current thesis is to improve the results by using multivariate logistic regression. The results indicate that using multivariate logistic regression narrows down the number of significant variables, which corresponds with the complexity of interaction in everyday life, providing a more realistic perception of the interaction of the dependent variables.
Key words: being badly treated/humiliated, discrimination, harassment,
Contents
Introduction p.3
1. Vulnerability and victimization p.3 2. Harassment, discrimination and being badly treated p.4 3. Vulnerability and victimization of students at universities p.5 3.1 international research and legislations p.5 3.2 Swedish research and legislations p.7
3.3 Malmö university student health survey p.8 3.4 Bivariate vs. Multivariate analysis p.9
Aim and research question p.10
Method p.11 1. Ethics p.11 2. Variables in the analysis p.11 3. Multivariate logistic regression p.13
Results p.13
Discussion p.20 1. Variables that increased the probability of feeling p.21
badly treated, harassed or discriminated
2. Variables that decrease the probability of feeling p.23
badly treated, harassed or discriminated
3. Limitations p.25 4. Future implications p.26 Conclusion p.27 References p.28
Introduction
International (Juang et al. 2016; Hatzenbuehler, Corbin & Fromme, 2011; Crutcher et al. 2011 & Ben Chi-pun Liu, 2016) and national (Lindström, 2005; Källoff et al. 2015 & Dnr 40-0789-05) reports and research have shown that between 12-75 % of the students at universities have experiences of being badly treated/humiliated, harassed or discriminated by staff or fellow students, at least once during their university studies.
A newly published report by Malmö university (Källoff et al. 2015) show that 25% of the students have experienced feeling badly treated/humiliated, 5% report experiences of harassment and 9% report feeling discriminated at some point during their study time at Malmö university. The report is based on material that was collected as a part of a student health service survey and included questions about background, study situation, physical and psychological health. The report shows which variables within these areas that have a connection with experiences of being badly treated/humiliated, harassed or discriminated.
The report of the student health survey (ibid) is of importance because this report compared to the other, includes a broader range of variables that have a
connection with experiences of being badly treated, harassed or discriminated. Nevertheless, the report is limited because the results are based on bivariate regression analysis on binary variables and thus, does not control for other correlated variables. Furthermore, the analysis in the report does not include a merged model of the three dependent variables; being badly treated/humiliated, harassed or discriminated, as they indicate mutual overlap.
The overall purpose of this essay is to carry out a new analysis on the same material that considers these limitations. The thesis will begin with a description of some relevant terms, previous research within the field and its criminological relevance and a thorough description of the Malmö university health survey.
1. Vulnerability and victimization
The term victimization normally refers to those processes associated with becoming a victim of a crime and it signifies the pattering of criminal
victimization that is most frequently structured by age, class, gender and ethnicity (Walklate, 2011). Although anyone may be a potential victim, some groups are particularly prone to victimization because of their social marginality, invisibility or vulnerability (Grattet & Jenness, 2001). Thus, linking together vulnerability and victimization, Sparks (1982) suggested that vulnerability refers to a state in which the victims do nothing to put themselves at special risk but find themselves vulnerable because of the characteristics they possess: young/old, female/male, weak, foreign and so on. Sparks (ibid) links vulnerability to those that can be harmed and those who put themselves at risk and argues that vulnerability is not physical, rather, is informed by who is considered to be at risk and who is
considered to be harmed. Furthermore, Green (2007) point out that those who are most likely to be victimized (e.g. economically marginal, young, ethnic minority males) are also those least likely to be seen as vulnerable and perhaps also implying their smaller value as victims. Carrabine et al. (2009) proposes a hierarchy of victimization with the bottom of the hierarchy consisting of the drug
addicts, the homeless, the street prostitute: all those for whom their lifestyle makes them prone to victimization (thus being vulnerable but denied victim status); and further nearer the top would be the elderly female victims of violent crimes (the least prone to such crime, but assumed vulnerable and quickly
assigned victim status). Consequently, when harm and risk are taken together and used as a measure of vulnerability, it is easily seen how the young become more readily identified as offenders rather than victims and the least likely to be considered vulnerable.
2. Harassment, discrimination and being badly treated/humiliated Three commonly researched variables when it comes to victimization and
vulnerability at workplaces and schools are: harassment, discrimination and being badly treated/humiliated. The terms: harassment and discrimination, are most clearly defined in the Swedish Discrimination Act (SFS 2016:828). The Act (ibid) set six different forms of discrimination, which are; direct discrimination, indirect discrimination, lack of availability, harassment, sexual harassment and
instructions to discriminate. As well as, seven different grounds of discrimination. These are; gender, gender identity, ethnicity, religion, disabilities, sexual
orientation and age (ibid). The Swedish Discrimination Act (ibid) defines direct discrimination as: someone getting disadvantaged by being treated less favourably than another is, has been or would be treated in a comparable situation. Indirect discrimination is defined as: someone being disadvantaged by the application of a provision, criterion or procedure that appears neutral but that may be of particular disadvantage for individuals of a particular gender, gender identity, ethnicity, religion, disability, sexual orientation or age. The third form of discrimination, the lack of availability, is defined as: an individual with a disability that is
disadvantaged by measures of accessibility that have not been implemented for that person to be in a comparable situation to people without this disability. Harassment is defined as: a behaviour that violates a person’s dignity and that is associated with any discrimination on grounds of gender, gender identity or expression, ethnicity, religion or other belief, disability, sexual orientation or age. Sexual harassment, on the other hand, is a conduct of a sexual nature that violates someone’s dignity. Instructions to discriminate, which is the last form of
discrimination, is defined as: orders or instructions to discriminate an individual on the grounds of the above-mentioned forms of discrimination which is given to someone who is in a dependent or subordinate relationship to the person who gives the order or instruction. Or, if the individual is committed to fulfil a mission on the grounds of the superordinate (ibid). Thus, discrimination and harassment are more or less intertwined as harassment is done on the grounds of
discrimination (gender, gender identity, ethnicity, religion, disabilities, sexual orientation and age) but is expressed more through physical behaviour than pure discrimination does. Whereas, being badly treated/humiliated is a broader term, that can be a result of many different behaviours and statements, such as someone being rude or showing lack of respect, that result in resentment, humiliation and/or hurt (Cambridge, 2017), on the grounds of discrimination (SFS 2016:828). To distinguish the three variables can in other words instead be interpreted as different shades of violating the grounds of discrimination through different means and approaches (ibid).
A group that might be prone to victimization because of their social marginality and vulnerability are members of the LGBTQ society. An interview-study by Guadalupe-Diaz & Jasinski (2016) showed how the sexual identity of individuals within the LGBTQ society that were victims of intimate partner violence affected their chances of getting adequate help, thus hitting various genderist barriers and discriminations for help. Another example is bullying at school, Side & Johnson (2014) used semi-structured interviews and literature analysis to study how the physical appearance of school-children could form the basis of both verbal and physical bullying and harassment. Victimization and vulnerability at the workplace due to ethnic background and socioeconomic status was studied through data from closed discrimination charges by Roscigno et al. (2012). Also, Gomez, Miranda & Polanco’s (2011) logistic regression analysis showed that perceived discrimination statistically predicted endorsement of a suicide attempt history with the influence of culturally-related stressors – i.e., stress related to the process of adapting to the beliefs, values and practices of a dominant culture. Another logistic regression analysis by Abajobir et al. (2017) showed that
childhood maltreatment such as harassment in various forms was found to lead to later problem behaviours including aggression and intimate partner violence victimization in young adulthood.
Thus, discrimination, harassment and being badly treated/humiliated can be associated with various factors, such as research suggests; gender, socioeconomic status, gender identity, disabilities, psychological problems,
3. Vulnerability and victimization of students at universities
Students are a vulnerable group that has been studied broadly. Students being a vulnerable group refers to the great diversity of individuals enrolled in university programs and courses. The classrooms include students of different sexual orientations, ethnic backgrounds, age, psychological wellbeing, academic performance, religion, recreational habits and so on (Moore & Hansen, 2012). Research have demonstrated that student’s victimization experiences, such as harassment, discrimination and feeling offended, are associated with various psychological, social and academic problems (Fan & Dempsey, 2017). Victimized students are more prone to develop psychosocial maladjustments, such as
depression and anxiety (Hawker & Boulton, 2000), mental health problems (Williams, Neighbors & Jackson 2003, Woodford et al. 2014) risk behaviours such as alcohol abuse (Hatzenbuehler, Corbin & Fromme, 2011) and illicit substance use (Lanaway, 2017).
3.1 International research and legislations
A self-report survey on perceived discrimination at a northern Californian university on a sample of 142 ethnic minority students showed that 75% of participants reported experiencing at least one instance of discrimination at the university (Juang et al. 2016). The study (ibid) included variables such as: age, gender, family support, family socioeconomic status, immigration status, peer support, psychological symptoms (depression and loneliness) and somatization (physical symptoms such as nausea, pain in heart and chest, faintness and dizziness). The results of the multiple regression analysis showed that age was positively related to somatization and that females (73%) reported higher levels of
peer support and lower levels of discrimination than males. Furthermore, greater perceived discrimination by peers was associated with greater depressive
symptoms and greater family- and peer support predicted fewer depressive symptoms for both males and females.
Hatzenbuehler, Corbin & Fromme (2011) studied discrimination as a risk factor for health-risk behaviours, including alcohol abuse. The study (ibid) included a sample of 1539 participants (64% female) at the University of Texas at Austin with over 40% of the sample experiencing at least one discrimination event at the university, discrimination due to gender was the most commonly reported
(34.40%), followed by race/ethnicity (29.10%) and 4.40% of the sample reported discrimination due to sexual orientation. The study included variables such as: alcohol problems, binge drinking, coping motives, negative effect and positive alcohol expectancies. The result of the multivariate regression analysis found that discrimination was associated with alcohol-related problems when controlling for levels of consumption. The results further indicated significant indirect effects from discrimination to alcohol-related problems through the pathway linking negative affect to coping motives and stress associated with discrimination may lead to the development of positive expectancies for alcohol.
A Canadian study (Crutcher et al. 2011) on 242 Alberta family medicine
graduates (53.2% females) showed a total of 44.7% of the graduates reported that they had experienced intimidation, harassment and/or discrimination (IHD) during their two-year residency program. Variables included were: gender, ethnicity, culture, language and sexual orientation. A logistic regression analysis was carried out and the results showed that the primary basis for IHD was perceived to be gender (26.7%), more females (41.7%) than males (4.5%), followed by ethnicity (16.2%), and culture (9.5%). A significantly greater proportion of males (38.6%) than females (20.0%) experienced IHD in the form of work as punishment. Ben Chi-pun Liu (2016) studied the records of 671 (79.9% females) social work students and graduates in the UK. The records included the student’s academic results and socio-demographic data such as gender, ethnicity and perceived
disabilities. The results of Chi-square tests and logistic regression analysis showed that among the students, 34.4% of them reported learning difficulties, 27.6% of them were black, 42.3% of them were female with learning disabilities, 43.8% of them were black with a disability, 46.2% of them were black female with
disability and 61.5% of them were black female with a learning difficulty. Thus, the intersection between gender, race and learning difficulties showed that black female students with learning disabilities had a relatively higher probability in failing the social work program. Hence, Chi-pun Liu (2016) emphasizes the need for interventions for providing continuous support, focusing on how the support is provided and addressing contextual and structural barriers at learning institutions. Teachers should receive proper training in designing effective interventions to develop complete knowledge of learning principles and instructional strategies for helping students with learning difficulties and tackle the contextual, structural, environmental and personal issues, such as poor social integration, help-seeking behaviours and negative interaction with university personnel, that affect the academic performance of students of minority groups (ibid).
Preventative measures of students experiencing discrimination, harassment and being badly treated/humiliated at universities is first and foremost handled at government level. This is done both in legislations restricted to a certain country, such as The U.S. The U.S. department of education’s office for civil rights (U.S. department of education, 2017) enforces several laws that prohibit discrimination on the basis of race, colour, and national origin, sex, disability, and age in
programs or activities that receive Federal funds from the Department of Education. These laws extend to all state education agencies, elementary and secondary school systems, colleges and universities, vocational schools, proprietary schools. Further, the office of civil rights (ibid) has responsibilities prohibiting disability discrimination by public entities, such as universities, whether or not they receive federal financial assistance. But also on a wider legislative level such as the European commission’s workplace and education anti-discrimination guidelines to EU member states (European Commission, 2015). Interestingly, the grounds of discrimination: racial/ethnic origin, sex, religion, disability, age and sexual orientation which individuals are protected against under EU law do all apply for workplace opportunities and environment, but only racial/ethnic origin applies for education (ibid).
3.2 Swedish research and legislations
In Sweden, the 2nd chapter, 5§ of the Discrimination Act (SFS 2016:828) states
that those operating within the meaning of the Education Act (2010: 800) or other educational activities may not discriminate against any child, pupil or student participating in or applying to the educational corporate. Employees and
contractors of the educational corporate to be equated with the education provider when they act within the scope of their employment or contract. Consequently, according to the 2nd chapter, 7§ of the Discrimination Act (SFS 2016:828) if an education provider becomes aware that a child or pupil or student participating in or applying for the provider's activities considers that in the course of business have been subjected to harassment or sexual harassment, the education provider is obliged to investigate the circumstances surrounding the alleged harassment and where appropriate take the measures that can reasonably be demanded to prevent harassment in the future. If a student feels discriminated, harassed or offended, the he/she can report this to the Equality ombudsman. According to the Equality ombudsman (Diskrimineringsombudsmannen 2017) a college or university should conduct continuous active measures in 4 steps. These steps are; investigate risks of discrimination (through surveys, interviews, or other methods), analyse the causes, implement measures and to monitor and evaluate. These steps should be conducted within the areas of admission and recruitment, teaching methods and organization of education, examinations and assessments, the study environment and finally within studies in conjunction with parenthood. The same 4 steps should be undertaken when it comes to harassment and sexual harassment, but the education provider should also include clear guidelines and routines that clarifies how the educational institution should act if harassment or sexual harassment occurs. The personnel should be educated about the rules of harassment and how to prevent and avoid such occurrences (ibid).
A study of the psychosocial study environment at Stockholm university (Dnr 40-0789-05) was done in 2005 to get an overview of the occurrence of harassment, on the grounds of the discrimination act (SFS 2016:828), on campus. The study was based on an online survey and the statistical analysis showed that, out of 369 students that participated, 50% of them reported being exposed to incidents that could be defined as harassment. Furthermore, approximately 50% of those
reporting being exposed to harassment, reported being so because of gender, with the clear majority being women, 14.2% reported being harassed due to ethnic belonging and 12.5% reported harassment due to sexual orientation. The survey also included questions about academic background of parents, parenthood, questions about stress and competition in the study environment, peer support, and questions about harassment and discrimination. The results showed that students with children felt more exposed on campus, with lower peer support and higher competition with other students in the study environment. Experiences of harassment for students with children resulted in a higher proportion of
psychological problems than for the other students. Students of parents with no academic background and thus smaller network of contacts, who have been exposed to harassment, experienced harassment for a longer period than those with a large network of contacts. The health consequences of experiencing harassment also appear to have been greater for the former group.
Another survey study was done at Lund university (Lindström, 2005) with the purpose of investigating the study environment at the university. A total of 2 123 students participated in the study, whereas 63% were women. The proportion of students reporting to have been badly treated/humiliated, at some point at the university, is 12%. Statistical analysis showed that gender accounted for 36%, 5% because of disabilities, 9% due to religious beliefs, 9% for sexual orientation, 17% because of ethnic background and 50% on other grounds than are not stated in the discrimination act (SFS 2016:828), such as personal attitudes or bad study results.
3.3 Malmö university student health survey
The Malmö university student health survey (Källoff et al. 2015) was conducted in the form of a questionnaire in the spring term of 2013 at Malmö university and is available at the universities web page (https://dspace.mah.se). The aim was to review psychosocial aspects of the study environment (such as how students perceive demands, control and support, and issues concerning equality of
treatment), mental health (stress, anxiety and depression), alcohol and drug habits, and the sexual health of students at Malmö university. The survey was sent
electronically and by post to a sample of 3026 students. The final sample
consisted of 956 students, 703 female students (73.5%), 247 male students (26%) and 6 students identified as trans-, inter- or no gender (0.5%). The average age of the respondents was 27.3 years, and the age group, 18-24 years, held the largest proportion of the respondents. One-fifth of the respondents were born in a non-Nordic country and almost a third of the respondents had at least one parent born in a non-Nordic country. Sixteen percent of the respondents did not have Swedish as their first language and more than half of the respondents had at least one parent with an academic background. Almost one-fifth of the students had
children living at home and only a very small proportion of the respondents (3%) were international students.
The questionnaire consisted of 62 questions in Swedish. The questions were divided into 6 different categories: background, study situation, equal treatment, health and well-being, alcohol- and drug habits, and sexual health. The study situation was analysed using the Demand-Control-Support model and according to this model, a high level of demand combined with low levels of control and support encompass a strain situation, increasing the risk of stress (Karasek and Theorell, 1990). Stress was analysed with the help of Arnetz and Hasson Stress Questionnaire which has been validated by Andersson et al. (2009). Mental health was measured with the help of SCL-8D which is a form that identifies signs of anxiety and depression (psychiatric symptoms) and has been validated in the original study by Fink et al. (1995). Finally, AUDIT-C was used to identify risky drinking behaviour. AUDIT-C is a reduced version of the Alcohol Use Disorders Identification Test developed by the World Health Organization (Babor et al., 2001).
The category of equal treatment was of interest in this report (Källoff et al. 2015), as it forms the basis of the current paper. Equal treatment refers to experiences of being badly treated/ humiliated, harassed or discriminated in the study situation on the grounds of the Swedish Discrimination Act (SFS 2016:828). Almost 25% of the respondents reported having experiences of being badly treated/humiliated, 5% of the respondents reported being harassed at some point and 9% reported being discriminated. This compared to 12% at Lund university (Lindström, 2005), and 50% at Stockholm university (Dnr 40-0789-05). Although, comparisons with different studies may be difficult, since the questions regarding being badly treated/humiliated, harassed or discriminated may be formulated differently. Nevertheless, the report (Källoff et al. 2015) showed that the most common grounds for being badly treated was answered as “other” (factors not included in the discrimination act) by 57%, ethnical background by 12% and gender by 10%. For harassment and discrimination, the factor mostly reported was “other” as well (46%), followed by ethnical background (16%) and gender (13%). Also, 2 % of the respondents reported being sexually harassed. The results also illuminated a few variables that might work on the contrary, hence, serve as protective factors of avoiding being badly treated/ humiliated, harassed or discriminated. The results showed that meaningful leisure time increased the likelihood of the student
feeling they were coping with their studies, and reduced the likelihood of feeling discriminated against and harassed in the study situation. A student who felt their leisure time was meaningful was also less likely to experience mental health problems. Another variable that gave the same decrease in victimization was the experience of high peer support. Peer support decreased both experience of mental health problems and victimization. On the contrary, the results that showed an increase in likelihood of feeling discriminated against and harassed or badly treated in the study situation, might be viewed as risk factors. Ethnic background of parents, high levels of stress and high demands on oneself showed such an increase.
3.4 Bivariate vs. Multivariate analysis
The analysis of the results in the Malmö university report (Källoff et al. 2015) was done through bivariate regression analysis on binary variables. A binary variable is a categorical variable with only two outcomes (e.g. coded as yes/no, dead/alive or male/female) when testing for the dependent variables (Field, 2013:871). A
categorical variable is made up of categories and it names distinct entities, in its simplest form it names just two distinct types of things like: male/female, hence, resulting in a binary variable (ibid:8). Further, a bivariate regression analysis presents a correlation between two variables only (the dependent and the independent), and does not control fort other correlated variables (ibid).
Therefore, it does not provide an explanation for the relationship between the two variables but only a description of only one binary variable at the time (ibid). Multivariate logistic regression is an extension of the bivariate regression in which an outcome is predicted by a linear combination of two or more predictor variables (Field 2013:880). Meaning that multivariate analysis analyses several variables to see if one or more of them are predictive of a certain outcome and thus, introduces other variables to determine the links between dependent and independent variables or to specify the conditions under which the associations takes place (Field 2013:320). This provides a more realistic and richer overall picture than looking at a single variable. Some disadvantages are that the results of multivariate analysis are not always easy to interpret and for multivariate analysis to give meaningful results the need of a large sample of data is crucial otherwise the results are meaningless due to high standard errors (ibid). To sum up, both methods have their advantages and disadvantages. While bivariate analysis gives a clear direct description of a correlation between two variables, it does not provide an explanation for the relationship or control for other correlated variables. On the other hand, multivariate analysis includes several variables to investigate if they are predictive of a certain outcome which introduces other variables to control for the links between the dependent and independent variables or to specify the conditions under which the associations takes place, but the results are not always easy to interpret and the need for a large sample of data is crucial to give meaningful results and avoid high standard errors.
The bivariate regression analysis of the Malmö university report (Källoff et al. 2015) indicated some overlap between the three variables (being badly treated/ humiliated, harassed or discriminated) but also additional variables from the 6 different categories in the questionnaire, mentioned above, that show a connection to experiences of being badly treated/humiliated, harassed and discriminated. Since bivariate regression does not control for other correlated variables, an improved option would be to use a multiple logistic regression to correspond with the complexity of everyday life and make the results more realistic.
Aim and research question
The advantage of the Malmö university student health survey (Källoff et al. 2015), is that it includes a broad range of variables that have a connection with
experiences of being badly treated/humiliated, harassed or discriminated. Since the report is limited because of the results being based on bivariate regression analysis on binary variables and therefore, not controlling for other correlated variables and the analysis does not include a merged model of the three dependent variables; being badly treated/humiliated, harassed or discriminated, as they indicate mutual overlap. Thus, the overall aim of this essay will be to carry out a new analysis on the same material that considers these limitations but with a multiple logistic regression analysis instead.
My research question is:
(1) How will the results of the analysis differ if using multiple logistic regression instead of bivariate regression and, thus, controlling for other correlated variables?
Method
The data used in this essay has been received from the already existing report from Malmö university (Källoff et al. 2015) with the focus on the data that
concerns equal treatment and the variables included in the original analysis which are relevant for the topic of the current thesis. All variables from the original report were included even if they did not show significant correlation between variables, as the new analysis might show different results and, thus, all variables should be included.
1. Ethics
The report from Malmö university has received ethical approval from the regional ethics committee in Lund, DNR 2012/787. The current thesis is included in the ethical approval received as access has only been granted to an anonymised data file that is stored on an USB stick and will be erased after completion and validation of the thesis. Analysis of the data is done on a group level and cannot be traced back to specific individuals.
2. Variables in the analysis
As the aim of this thesis is to carry out a new analysis but with the same variables to see if the results differ. The variables used in the initial report (Källoff et al. 2015) will be reused, but further explained in terms of meaning and the coding into binary variables. The variables will be presented categorically as this will be easier to comprehend and structured to avoid confusion. The coding in IBM SPSS (statistical package for the social sciences) was always done by having 1
signifying yes or a higher score, and 0 signifying no or a lower score depending on the variable. The coding was also replicated off the initial report so that the exact same variables are being included in the new analysis with their exact labels corresponding to facilitate the analysis.
The three dependent variables: badly treated/humiliated, harassment and
discrimination were all coded into simple yes/no answers. A small notice is that two cases of sexual harassment were added to the variable of harassment as the sample was too small to be handled separately but unnecessary to totally dismiss. The background variables consist of gender; age, relationship status, children at home, parents with academic background, disabilities and being born outside of Scandinavia. Gender was coded as male/female with the exclusion of 6 samples identified as trans-, inter- or no gender. This was done because the sample was small, and different from the sexual harassment sample that was included to the
harassment variable, the exclusion of these samples was the easiest solution. The coding of the age variable was done through dividing the sample into individuals over the mean age, which was 27.3 years and those below the mean age. The relationship status was simply coded as single/not single. Children at home refers to individuals with their kids permanently living with them (full custody). This variable was coded as yes/no. Parents with academic background refers to one or both parents having and academic background and is thus coded as yes/no. The disability variable consisted of several options of different disabilities (hearing loss, physical disability, neuropsychological disability, vision impairment that cannot be corrected and/or difficulties reading and writing) and therefore coded as yes if the respondent marked any type of disability and the rest as no. The last background variable is the one considering being “born outside of Scandinavia”. Respondents that had answered that they were born in Sweden or another
Scandinavian country were coded as no and the other as yes.
The academic situation variables consist of; schoolyears, manage studies, more than 30 study hours/week, high control, high demands, high support, employment, meaningful leisure time. The variable of schoolyears refers to how many full academic years the student has attended. The variable was coded as 1 for 2 academic year or more, and 0 for students being on their first academic year. The variable “manage studies” refers to the student’s perceived ability to have
managed their studies with ease thus far. This variable was simply coded as yes/no. The next variable; more than 30 study hours/week, refers to students either spending more or less than 30 hours a week studying, and was subsequently coded as 1 for more than 30 study hours/week and 0 for less than that. High control refers to the student’s level of action and/or decision ability their study situation, hence, they feel in control of their studies. This variable was coded as 1 for high control and 0 for low control. High demand refers to the student’s perception of demands from the studies and study environment and are coded as 1 for high and 0 for low. High support refers to the support the student receives from peers or family and is coded as 1 for high and 0 for low. Employment includes any type of employment that the student has next to their studies, and is coded as yes/no. Meaningful leisure time refers to the student’s own feeling of content with the time spent on their spare time. This variable is also simply coded as yes/no. The next category of variables is considering student’s wellbeing. These include; psychological symptoms, sought help for psychological symptoms and high stress. Psychological symptoms were coded as yes/no and included symptoms such as feeling sad, strained, nervous and worried, anxiousness, hopelessness, and panic and anxiety attacks. Seeking help for any of the above described symptoms was coded as yes/no. High stress was coded 1 for high and 0 for low, and referred to the student’s perceived stress level.
The last category of variables concerns substance use and includes; AUDIT-C risk, illicit drugs/current week and Cannabis/current week. AUDIT-C risk refers to the risky drinking behaviour according to AUDIT-C which is a reduced version of the Alcohol Use Disorders Identification Test (Babor et al., 2001). This
variable is coded as yes if the behaviour is considered risky and no otherwise. “Illicit drugs/current week” is coded as yes/no and refers to any consumption of illicit drugs the week of the answering of the questionnaire. The same applies for “Cannabis/current week”.
Because the initial report showed overlap of the three dependent variables; badly treated/humiliated, harassed and discriminated. The decision was made to merge these variable into one “total” variable to see how the results will be without the overlap. This merged variable was also coded into a binary variable with yes/no option for any perceived experience of being badly treated/humiliated, harassed or discriminated.
3. Multivariate logistic regression
The above-mentioned variables are conducted into four different multivariate logistic regression analyses in IBM SPSS tool. One analysis is done on the dependent variable of being badly treated, one for harassment, one for
discrimination and one for the merged “total” variable. The independent variables were all conducted categorically so that the results organized and easier to
understand. Each analysis of the dependent variables will include the other two, except for the “total” variable where they’re already merged.
Results
The results of the regression analyses on the dependent variables: badly treated, harassed, discriminated and the total merged variable, will be presented in a table (Table 1) to get an overview of the overall results and what variables showed significant values that increase or decrease the probability of feeling badly treated/ harassed or discriminated.
Thereafter, 4 different tables will be presented for each one of the dependent variables including the merged total variable, where the results of the multivariate logistic regression analysis are compared to the results of the initial bivariate regression. This is done to get a better overview when comparing the results of the different analyses. The 4 tables will include all the variables included in the analysis but will only show the results of the variables that showed a significant correlation (P<0.05) presented in table 1. These results will be included in the table together with the results that showed a significant correlation (P<0.05) in the initial bivariate regression, thus, leaving the other spaces in the table blank. This will increase the visual clarity of the differences of the results between the two methods and by that making the results easier to compare and contrast. The tables will also be followed by a brief summation and clarification of the results and state the similarities and differences. The results will be further discussed in the discussion.
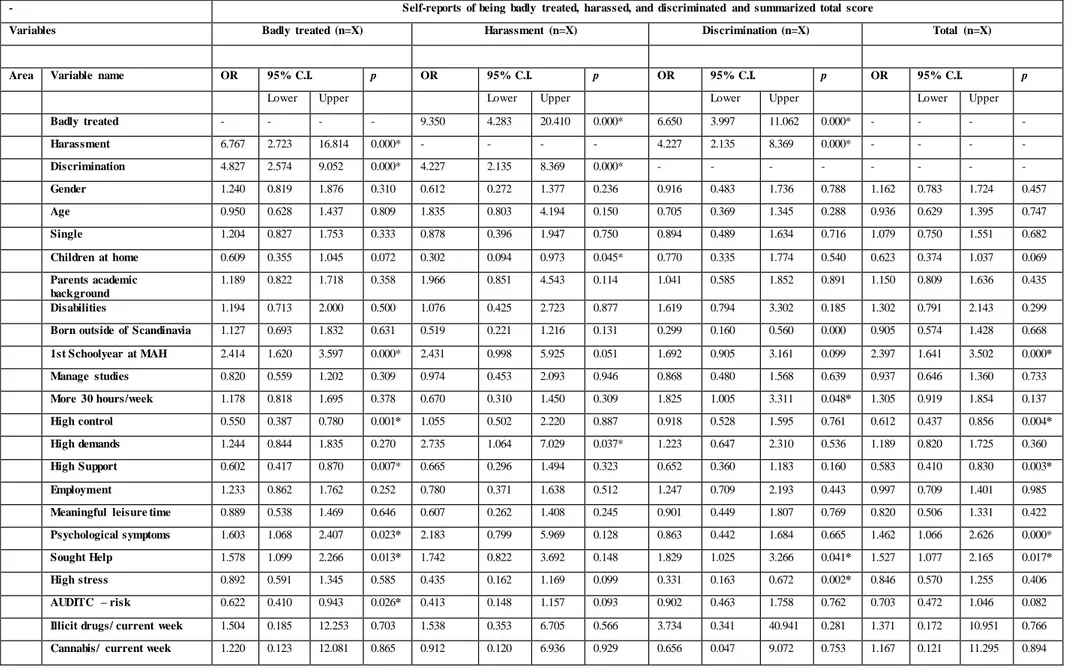
Table 1. Multiple logistic regression analysis including all variables that in the preceding report from the Student Health at Malmö University was related to self-reports of being badly treated,
harassed, and discriminated. The table shows Odds Ratios (OR), Confidence Intervals (CI) and p-values presented for each of the outcome variables, and for a summarized total variable.
- Self-reports of being badly treated, harassed, and discriminated and summarized total score
Variables Badly treated (n=X) Harassment (n=X) Discrimination (n=X) Total (n=X) Area Variable name OR 95% C.I. p OR 95% C.I. p OR 95% C.I. p OR 95% C.I. p
Lower Upper Lower Upper Lower Upper Lower Upper
Badly treated - - - - 9.350 4.283 20.410 0.000* 6.650 3.997 11.062 0.000* - - - - Harassment 6.767 2.723 16.814 0.000* - - - - 4.227 2.135 8.369 0.000* - - - - Discrimination 4.827 2.574 9.052 0.000* 4.227 2.135 8.369 0.000* - - - - Gender 1.240 0.819 1.876 0.310 0.612 0.272 1.377 0.236 0.916 0.483 1.736 0.788 1.162 0.783 1.724 0.457 Age 0.950 0.628 1.437 0.809 1.835 0.803 4.194 0.150 0.705 0.369 1.345 0.288 0.936 0.629 1.395 0.747 Single 1.204 0.827 1.753 0.333 0.878 0.396 1.947 0.750 0.894 0.489 1.634 0.716 1.079 0.750 1.551 0.682 Children at home 0.609 0.355 1.045 0.072 0.302 0.094 0.973 0.045* 0.770 0.335 1.774 0.540 0.623 0.374 1.037 0.069 Parents academic background 1.189 0.822 1.718 0.358 1.966 0.851 4.543 0.114 1.041 0.585 1.852 0.891 1.150 0.809 1.636 0.435 Disabilities 1.194 0.713 2.000 0.500 1.076 0.425 2.723 0.877 1.619 0.794 3.302 0.185 1.302 0.791 2.143 0.299
Born outside of Scandinavia 1.127 0.693 1.832 0.631 0.519 0.221 1.216 0.131 0.299 0.160 0.560 0.000 0.905 0.574 1.428 0.668
1st Schoolyear at MAH 2.414 1.620 3.597 0.000* 2.431 0.998 5.925 0.051 1.692 0.905 3.161 0.099 2.397 1.641 3.502 0.000* Manage studies 0.820 0.559 1.202 0.309 0.974 0.453 2.093 0.946 0.868 0.480 1.568 0.639 0.937 0.646 1.360 0.733 More 30 hours/week 1.178 0.818 1.695 0.378 0.670 0.310 1.450 0.309 1.825 1.005 3.311 0.048* 1.305 0.919 1.854 0.137 High control 0.550 0.387 0.780 0.001* 1.055 0.502 2.220 0.887 0.918 0.528 1.595 0.761 0.612 0.437 0.856 0.004* High demands 1.244 0.844 1.835 0.270 2.735 1.064 7.029 0.037* 1.223 0.647 2.310 0.536 1.189 0.820 1.725 0.360 High Support 0.602 0.417 0.870 0.007* 0.665 0.296 1.494 0.323 0.652 0.360 1.183 0.160 0.583 0.410 0.830 0.003* Employment 1.233 0.862 1.762 0.252 0.780 0.371 1.638 0.512 1.247 0.709 2.193 0.443 0.997 0.709 1.401 0.985
Meaningful leisure time 0.889 0.538 1.469 0.646 0.607 0.262 1.408 0.245 0.901 0.449 1.807 0.769 0.820 0.506 1.331 0.422
Psychological symptoms 1.603 1.068 2.407 0.023* 2.183 0.799 5.969 0.128 0.863 0.442 1.684 0.665 1.462 1.066 2.626 0.000*
Sought Help 1.578 1.099 2.266 0.013* 1.742 0.822 3.692 0.148 1.829 1.025 3.266 0.041* 1.527 1.077 2.165 0.017*
High stress 0.892 0.591 1.345 0.585 0.435 0.162 1.169 0.099 0.331 0.163 0.672 0.002* 0.846 0.570 1.255 0.406
AUDITC – risk 0.622 0.410 0.943 0.026* 0.413 0.148 1.157 0.093 0.902 0.463 1.758 0.762 0.703 0.472 1.046 0.082
Illicit drugs/ current week 1.504 0.185 12.253 0.703 1.538 0.353 6.705 0.566 3.734 0.341 40.941 0.281 1.371 0.172 10.951 0.766
As one can see from table 1, significant results have emerged for badly treated and its association with harassment and discrimination, which shows a statistical significance. This was expected as the initial report showed overlap. Furthermore, being badly treated showed significance with number of academic schoolyears, high control, high support, the presence of psychological symptoms, the seeking of help for psychological symptoms and risky drinking behaviour according to AUDIT-C measures.
Harassment, as expected, was significant to badly treated and discriminated, as well as having custody of children at home and high demands. Discrimination on the other hand did also have a significant association to badly treated and
harassment, but also, on studying more than 30 hours/week, seeking help for psychological symptoms and high stress.
The merged “total” variable, showed interesting new results where there was a strong significance with number of academic schoolyears attended, and student’s perception of having high control and high support. The presence of psychological symptoms and seeking help for such symptoms also showed significant results. Following tables (tables 2-4) will show the results of the four different dependent variables separately and compare the significant results obtained in the multiple logistic regression analysis to the results of the initial study, this is done to get a clear presentation of the similarities and differences between the results of bivariate and multivariate regression analysis. The tables will thus include, significant values in bivariate and multivariate analysis that increase as well as decrease the probability for being badly treated, harassed, discriminated and the results of the “total variable”. This is how the results were presented in the initial report as those variables that showed significance could either increase or
decrease the probability of being badly treated, harassed or discriminated. Table 5 will only show the results of the new merged “total” variable as the variable did not exist in the initial report.
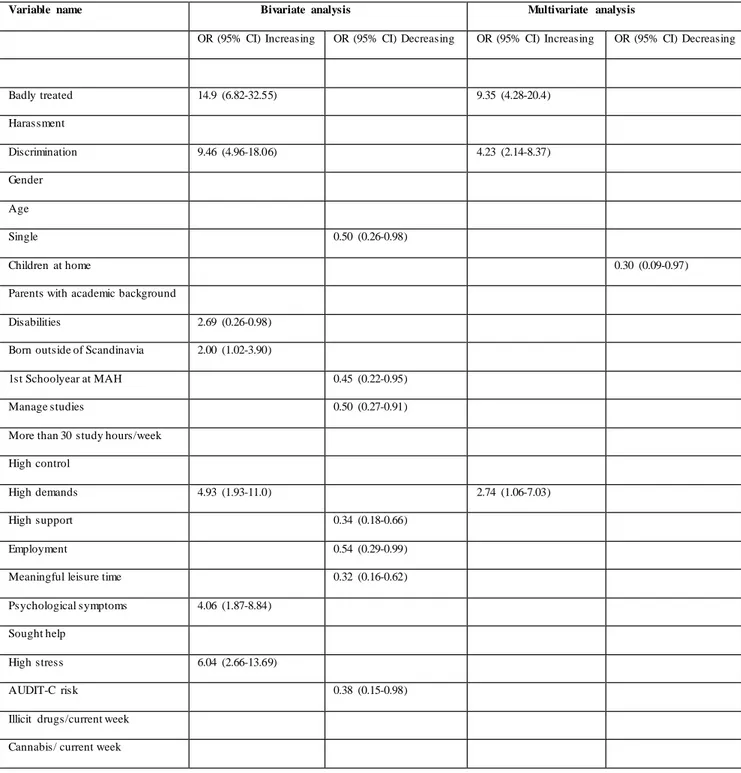
Table 2. In the table, OR (95% CI) is reported for significant variables (* P < 0.05)
in bivariate and multivariate analysis that increase as well as decrease the probability of harassment
Variable name Bivariate analysis Multivariate analysis OR (95% CI) Increasing
OR (95% CI) Decreasing OR (95% CI) Increasing OR (95% CI) Decreasing
Badly treated 14.9 (6.82-32.55) 9.35 (4.28-20.4) Harassment Discrimination 9.46 (4.96-18.06) 4.23 (2.14-8.37) Gender Age Single 0.50 (0.26-0.98) Children at home 0.30 (0.09-0.97)
Parents with academic background
Disabilities 2.69 (0.26-0.98)
Born outside of Scandinavia 2.00 (1.02-3.90)
1st Schoolyear at MAH 0.45 (0.22-0.95)
Manage studies 0.50 (0.27-0.91)
More than 30 study hours/week
High control
High demands 4.93 (1.93-11.0) 2.74 (1.06-7.03)
High support 0.34 (0.18-0.66)
Employment 0.54 (0.29-0.99)
Meaningful leisure time 0.32 (0.16-0.62)
Psychological symptoms 4.06 (1.87-8.84)
Sought help
High stress 6.04 (2.66-13.69)
AUDIT-C risk 0.38 (0.15-0.98)
Illicit drugs/current week
Cannabis/ current week
The results of table 2 show a clear difference in the results of the different
analyses, but also some similarities. Both bivariate and multivariate analysis show that feeling discriminated and badly treated, increased the probability of feeling harassed. But, both increases and decreases in probability of feeling harassed was narrowed down in the multivariate analysis. Here, having custody over children at home showed a decrease in probability of feeling harassed, whereas having high demands showed an increase. The same increase was also seen in the bivariate analysis.
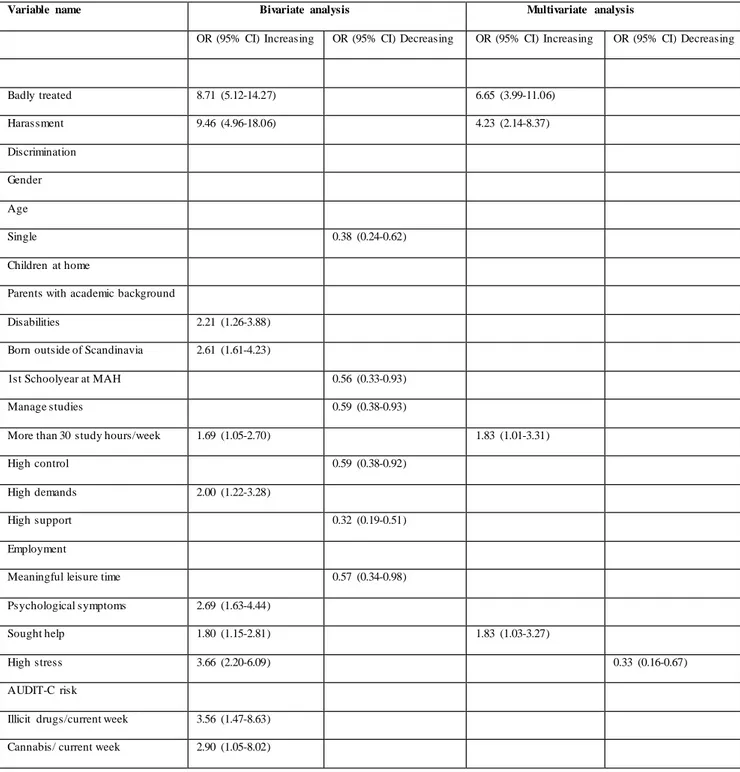
Table 3. In the table, OR (95% CI) is reported for significant variables (* P < 0.05)
in bivariate and multivariate analysis that increase as well as decrease the probability of discrimination
Variable name Bivariate analysis Multivariate analysis OR (95% CI) Increasing
OR (95% CI) Decreasing OR (95% CI) Increasing OR (95% CI) Decreasing
Badly treated 8.71 (5.12-14.27) 6.65 (3.99-11.06) Harassment 9.46 (4.96-18.06) 4.23 (2.14-8.37) Discrimination Gender Age Single 0.38 (0.24-0.62) Children at home
Parents with academic background
Disabilities 2.21 (1.26-3.88)
Born outside of Scandinavia 2.61 (1.61-4.23)
1st Schoolyear at MAH 0.56 (0.33-0.93)
Manage studies 0.59 (0.38-0.93)
More than 30 study hours/week 1.69 (1.05-2.70) 1.83 (1.01-3.31)
High control 0.59 (0.38-0.92)
High demands 2.00 (1.22-3.28)
High support 0.32 (0.19-0.51)
Employment
Meaningful leisure time 0.57 (0.34-0.98)
Psychological symptoms 2.69 (1.63-4.44)
Sought help 1.80 (1.15-2.81) 1.83 (1.03-3.27)
High stress 3.66 (2.20-6.09) 0.33 (0.16-0.67)
AUDIT-C risk
Illicit drugs/current week 3.56 (1.47-8.63)
Cannabis/ current week 2.90 (1.05-8.02)
The results of table 3 demonstrate that both bivariate and multivariate analysis resulted in feeling badly treated and harassed, increased the probability of feeling discriminated. But, both increases and decreases in probability of feeling
discriminated was also narrowed down in this multivariate analysis. Here, high stress had a decreasing probability of feeling discriminated whereas seeking help for psychological symptoms and studying more than 30 hours/ week increased the probability. Thus, having the two last variables corresponding with the bivariate analysis.
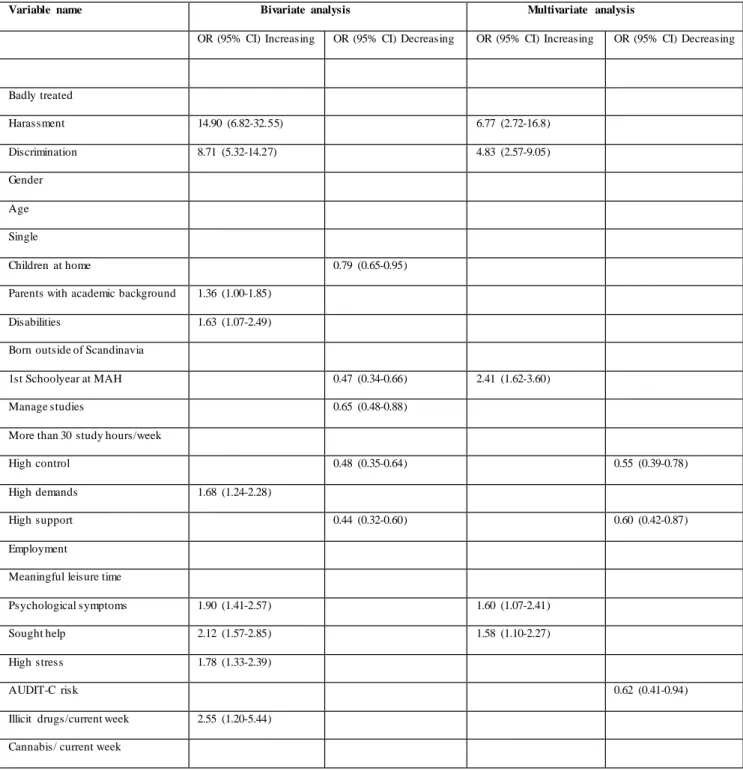
Table 4. In the table, OR (95% CI) is reported for significant variables (* P < 0.05)
in bivariate and multivariate analysis that increase as well as decrease the probability of being badly treated
Variable name Bivariate analysis Multivariate analysis OR (95% CI) Increasing
OR (95% CI) Decreasing OR (95% CI) Increasing OR (95% CI) Decreasing
Badly treated Harassment 14.90 (6.82-32.55) 6.77 (2.72-16.8) Discrimination 8.71 (5.32-14.27) 4.83 (2.57-9.05) Gender Age Single Children at home 0.79 (0.65-0.95)
Parents with academic background 1.36 (1.00-1.85)
Disabilities 1.63 (1.07-2.49)
Born outside of Scandinavia
1st Schoolyear at MAH 0.47 (0.34-0.66) 2.41 (1.62-3.60)
Manage studies 0.65 (0.48-0.88)
More than 30 study hours/week
High control 0.48 (0.35-0.64) 0.55 (0.39-0.78)
High demands 1.68 (1.24-2.28)
High support 0.44 (0.32-0.60) 0.60 (0.42-0.87)
Employment
Meaningful leisure time
Psychological symptoms 1.90 (1.41-2.57) 1.60 (1.07-2.41)
Sought help 2.12 (1.57-2.85) 1.58 (1.10-2.27)
High stress 1.78 (1.33-2.39)
AUDIT-C risk 0.62 (0.41-0.94)
Illicit drugs/current week 2.55 (1.20-5.44)
Cannabis/ current week
The results of table 4 demonstrate that, even here, both bivariate and multivariate analysis resulted in that feeling harassed and discriminated, increased the
probability of feeling badly treated. But, both increases and decreases in
probability of feeling discriminated was also narrowed down in this multivariate analysis. High support and high control was consistent with the results of the bivariate analysis, hence, decreasing probability. The same was demonstrated for psychological symptoms and seeking help, where both multivariate and bivariate showed an increased probability. The only thing that differed was that studying the first academic year at MAH increased the probability of feeling badly treated.
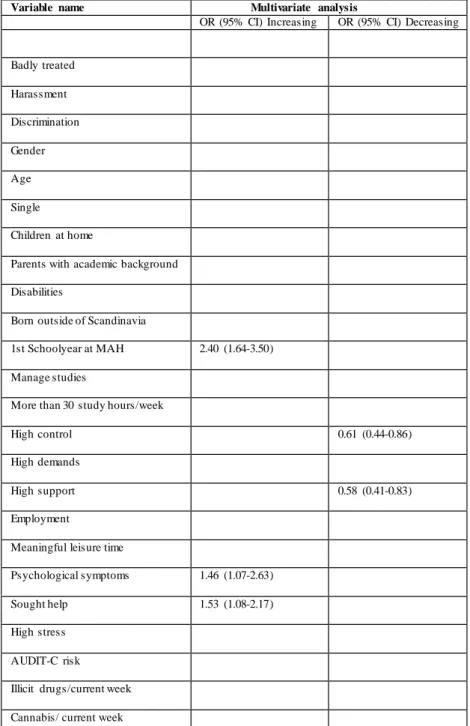
Table 5. In the table, OR (95% CI) is reported for significant variables (* P < 0.05)
in multivariate analysis that increase as well as decrease the probability of experiencing the “total” variable
Variable name Multivariate analysis
OR (95% CI) Increasing OR (95% CI) Decreasing
Badly treated Harassment Discrimination Gender Age Single Children at home
Parents with academic background
Disabilities
Born outside of Scandinavia
1st Schoolyear at MAH 2.40 (1.64-3.50)
Manage studies
More than 30 study hours/week
High control 0.61 (0.44-0.86)
High demands
High support 0.58 (0.41-0.83)
Employment
Meaningful leisure time
Psychological symptoms 1.46 (1.07-2.63)
Sought help 1.53 (1.08-2.17)
High stress
AUDIT-C risk
Illicit drugs/current week
Cannabis/ current week
The new “total variable” also showed consistency with the results of the 3-previous analyses and comparisons (table 2-4). High control and high support decreased the probability of feeling badly treated/humiliated, harassed or discriminated. While, attending the first academic schoolyear at MAH,
psychological symptoms and seeking help for psychological symptoms increased the probability of feeling badly treated/humiliated, harassed or discriminated.
Discussion
The results of the health survey (Källoff et al. 2015) were based on bivariate regression analysis on binary variables and thus, did not control for other
correlated variables which does not correspond with the complexity of everyday life and reality. Furthermore, the analysis in the report did not include a merged model of the three dependent variables; being badly treated/humiliated, harassed or discriminated, as they indicate mutual overlap in the initial report.
The present study sought to improve the results with the help of multivariate logistic regression analysis on binary variables on the same data set and answer the research question: How will the results of the analysis differ if using multiple logistic regression instead of bivariate regression and, thus, controlling for other correlated variables?
The overall findings suggest that using multivariate logistic regression reduces the number of significant variables that either increase or decrease the probability of feeling either badly treated, harassed, discriminated or all three variables merged together. Multivariate logistic regression controls for other correlated variables in the analysis, which corresponds with the complexity of interaction in everyday life. This means that factors affecting an individual’s vulnerability and probability of being badly treated, harassed or discriminated is not just a direct correlation of just two variables, but a variety of factors affecting the individual at the same time. Even if it might also be of interest to study the results of a bivariate analysis as it usually provides a larger variety of variables that influence the probability of being badly treated, harassed or discriminated, as it results in more input and variables to study further. Albeit, the reduced output of variables that results from the analysis of the multivariate logistic regression might be argued as providing a more realistic perception of the interaction as the bivariate analysis only produces a description of the relationship and not an explanation. Whereas, multivariate analysis analyses several variables to see if one or more of them are predictive of a certain outcome and thus provides a more representative and richer overall picture than looking at a single variable.
As expected, the dependent variables (badly treated/humiliated, harassed and discriminated) had huge influence on each other as all the analyses (Tables 2-4) showed increased correlation of the variables when analysed both through bivariate and multivariate regression analysis. This can be linked back to the section in the introduction that introduced the terms: badly treated/humiliated, harassed and discriminated. This section argued that the terms discrimination and harassment were most clearly defined in the Swedish Discrimination Act (SFS 2016:828). Whereas, being badly treated/humiliated was argued to be a broader term, that can be a result of many different behaviours and statements. And to distinguish the three variables can in other words instead be interpreted as different shades of violating the grounds of discrimination through different means and approaches. This might therefore be a possible explanation to why there is a significant overlap in the results of both bivariate and multivariate analysis. Another possible explanation might be that the terms are not really clarified in the initial questionnaire, and students might confuse the terms and their initial meaning and many might not even know that they’ve been badly treated, harassed and/or discriminated which can result in a dark figure that may perhaps have changed the frequencies and the outcome of the analysis.
Another possible explanation of the overlap of the three dependent variables can be interpreted in the way that feelings of already being badly treated, harassed or discriminated puts the individual in a vulnerable position, both intrinsically for the individual him-/herself and the attitude outwards that might show weakness and unease. This could make the individual more prone to further victimization. In this situation, the individual is already seen as victim but become more vulnerable because of the victim characteristics. This can be linked to bullying in school where the bullies pray on the weakness of their victim, as they grow stronger and the victims grows weaker. As mentioned earlier, Sparks (1982) suggests that vulnerability refers to a state in which the victims do nothing to put themselves at special risk but find themselves vulnerable because of the characteristics they possess. Moore & Hansen (2012) state that students as a vulnerable group refers to the great diversity of individuals enrolled in university programs and courses. The classrooms include students of different sexual orientations, ethnic
backgrounds, age, psychological wellbeing, academic performance, religion, recreational habits and so on. Hence, bad treatment, harassment and
discrimination is frequently linked to these different characteristics of the students and therefore also included as variables in the initial study (Källoff et al. 2015). Furthermore, students that have been victimized earlier outside of university or college could automatically be more vulnerable and prone to further victimization.
1. Variables that increased the probability of feeling badly treated, harassed or discriminated
Variables that increased the probability of feeling either badly treated, harassed, discriminated or all three variables merged together into one total variable, were: the two other dependent variables (excluding the variable that is being analysed), high demands, more than 30 study hours/week, psychological symptoms and seeking help for psychological symptoms and attending the first schoolyear at Malmö university.
These results differ from previous international and national reports. At the university of Texas (Hatzenbuehler, Corbin & Fromme, 2011) discrimination due to gender was the most commonly reported, followed by race/ethnicity and 4.40% reported discrimination due to sexual orientation. The results of the Alberta family medicine graduates (Crutcher et al. 2011) showed that the primary basis for experiencing intimidation, harassment and/or discrimination was perceived to be gender, females more frequently than males, followed by ethnicity and culture. The results of a study on social work students and graduates in the UK (Ben Chi -pun Liu, 2016) showed that black female students with learning disabilities had a relatively higher probability in failing the social work program due to
discrimination. Thus, ethnicity and disability were the most common grounds for discrimination. The study at Stockholm university (Dnr 40-0789-05) showed that harassment was most frequently reported due to gender, with the clear majority being women, followed by ethnic belonging and sexual orientation. Interestingly the results further showed that students with children felt more exposed on
campus, with lower peer support and higher competition with other students in the study environment, while the opposite was shown in the current analysis, which will be discussed further below. At Lund university (Lindström, 2005) the results showed that the most common grounds for feeling badly treated/humiliated were;
gender, disabilities, religious beliefs and sexual orientation, ethnic background and other grounds than are not stated in the discrimination act (SFS 2016:828). The initial report (Källoff et al. 2015) also showed differences in the report from the current analysis (but similarities with previous research in both national and international reports). The most common grounds for being badly treated were answered as other factors not included in the discrimination act, which was same as at Lund University. In addition, grounds for experiences of discrimination and harassment were ethnical background which corresponds with previous national and international research. Although, comparisons with different studies may be difficult, since the questions regarding being badly treated/humiliated, harassed or discriminated may be formulated differently in the different studies and perceived differently by the population. The perception might also vary between countries and cultures regarding what is be considered discrimination, bad treatment or harassment. Another consideration might be the method used when conducting the analysis. Even if the studies were based on regression analysis, it was not stated how the analysis was done in terms of coding or using a multivariate or bivariate approach. The initial report of the Malmö university study (ibid) might have corresponded with the previous study done in Lund (Lindström, 2005) because of similarities in their methodology when considering the statistical approach and execution. Methodological approach might also be discussed in terms of the use of qualitative or quantitative method. As mentioned earlier, different countries and cultures might perceive discrimination, bad treatment and harassment different from each other, but also the perception and meaning of these terms might also differ on a national level. Hence, the quantitative approach with the aim of generalizing the results to a wider population might need to be complemented with a qualitative involvement to clarify the meaning that the terms stand for. Also, worth mentioning is that the studies included in this thesis are solely qualitative, as the purpose and aim was to improve the analysis of the initial report. But when discussing the results of the analysis it is inevitable to at least mention that results might differ and maybe even be more precise if
qualitative studies were included since they leave room for further explanation and development for both respondent and researcher.
Further, the variables of high demands and studying more than 30 study hours/week, which increased the probability of feeling either badly treated, harassed, discriminated or all three variables merged together into one total variable, can be discussed together as demands might be linked to having the demand and need of studying more. This might lead to pressure on the individual on himself which makes him or her more vulnerable and weak because of the intimidation it presents to others, hence more prone to victimization. To clarify, for example, feeling the need to perform the best and get the highest grades might be viewed as arrogant and the individual being thought to be seeing themselves as superior which might lead to frictions from other fellow students. This could then result in discriminatory behaviour and bad treatment even if it’s not done on the grounds of the Swedish Discrimination Act (SFS 2016:828). Attending the first schoolyear at Malmö university might also be included here, as the student might not yet feel comfortable in the new environment and by that feeling insecure and vulnerable. They might lack the knowledge of their rights within the academic sphere and campus life which can be taken advantage of by others. They might feel badly treated, harassed and/or discriminated but feel unsure if the grounds for the maltreatment are unjustified or justified and by that do nothing to stop it which
might lead to a loop of continuation of being badly treated, harassed and/or discriminated.
Psychological symptoms and seeking help for these symptoms can be approached from two different ways. First, students that suffer from psychological symptoms to the extent that they need help might be viewed in terms of the deficit placing these individuals at risk for victimization. Even if old age is most commonly associated with victim status (Carrabine et al. 2009), the combination of a younger adult with psychological symptoms to the extent that help is needed can be a reason to turn Carrabine et al.’s (ibid) hierarchy of victimization around, which was mentioned previously in the introduction. Hence, being younger and suffering from psychological symptoms to the extent that they need help can be really stigmatizing especially at an age were an individual is still developing a self-identity (the average age of the respondents was 27.3 years and the age group, 18-24 years, held the largest proportion of the respondents). The other way of
approaching the understanding of the above variables is the difficulty in assessing cause and effect. Previous research has demonstrated that student’s victimization experiences, such as harassment, discrimination and feeling offended, are
associated with various psychological problems (Fan & Dempsey, 2017) mental health problems (Williams, Neighbors & Jackson 2003, Woodford et al. 2014). Here, the cause and effect are a bit diffused, as psychological symptom might lead to vulnerability and proneness to victimization, but also be a consequence
developed after such vulnerability and victimization have occurred.
To sum up this section, the findings of the multivariate analysis on variables increasing the probability of experiences of being badly treated, harassed and/or discriminated do correspond with previous research (Juang et al. 2016) when it comes to psychological symptoms, but fails to show trends of gender and ethnic backgrounds as grounds for discrimination, harassment or being badly treated, which are common variables in most research (Lindström, 2005; Hatzenbuehler, Corbin & Fromme, 2011). Thus, the variation in results might be the result of methodological differences in terms of statistical approaches and the perception of being badly treated, harassed and/or discriminated might differ both nationally and internationally and within different cultures.
2. Variables that decrease the probability of feeling badly treated, harassed or
discriminated
Variables that decreased the probability of feeling either badly treated, harassed, discriminated or all three variables merged together, were: having custody over children at home, high stress, high control, high support, AUDIT-C risk. One explanation of the decrease of probability of feeling either badly treated, harassed, discriminated due to having custody over children at home might be that individuals are viewed as stronger and more mature compared to their fellow students since they’ve entered a stage in their life where they are parents and not just a student. This can be associated with feeling stronger and more mature, and thus give the impression of strength and respect. Another aspect might be that individuals with children might handle bad treatment, harassment and
their rights, as mentioned was a lack earlier for younger students, and might confront any sign of such behaviour before it becomes a bigger issue.
High control and high support might be viewed as a natural factor that decrease of probability of feeling either badly treated, harassed, discriminated. This, because the individual is in control of their surroundings and by that avoiding getting into vulnerable positions that can make them targets for victimization. If victimization occurs or if the individual feels vulnerable, then the support from peer and
surroundings helps the individual to be stronger and to bounce back and be more aware of what can be done to avoid such negative encounters and whom to turn to if it occurs.
High stress is a bit tricky to understand as it might be more naturally associated with victimization and vulnerability which was shown by the initial bivariate analysis. High stress showed significant increase in probability for all dependent variables in the initial analysis but was excluded completely in all multivariate analysis. The explanation may lay in the fact that high support and high control showed significant decrease in the variable of bad treatment and the merged total variable which consists of almost 25% of the respondents compared to 5% of the respondents reported being harassed and 9% reported being discriminated. This is seen in contrast that high stress showed significant decrease for the variable of discrimination which consists of only 9% of the respondents. Thus, as the merged variable also showed a decrease due to high support and control might lead to the assumption that stress under control with high support might instead reduce the probability of being victimized.
Risky drinking behaviour (AUDIT-C) as a variable that decrease the probability of feeling either badly treated, harassed, discriminated is also interesting as it directly violates the trend of previous research which states that victimized students are more prone to develop risky behaviours such as alcohol abuse (Hatzenbuehler, Corbin & Fromme, 2011). No other study that have crossed the process of completing this thesis have mentioned or considered risky drinking behaviour as a decreasing factor, but instead, being a behavioural consequence for the victims of bad treatment, harassment and discrimination. Drinking alcohol may put individuals at risk when drunk, such as being vulnerable and out of control or even becoming aggressive which might lead to discriminatory consequences. Risky drinking behaviour could also be viewed as stigmatizing. But, when looking at table 4, high support and high control are also included in the table as decreasing the probability of feeling either badly treated, harassed, discriminated and might suggest that the drinking behaviour per se might not be a decreasing factor but the fact that the individual has high support and control makes them safer when faced with bad treatment, harassment and/or
discrimination. But then, even here, it could be a matter of difficulty stating which is the cause and which is the effect as regression analyses can go both ways. This might be an interesting topic to look further into and do further research on. To sum up this section, the findings of the multivariate analysis on variables decreasing the probability of experiences of being badly treated, harassed and/or discriminated are logical when it comes to high control and high support. But differs from previous studies when it comes to risky drinking behaviour and high stress. Nevertheless, high support and high control might be viewed as protective and influential factors when considering drinking behaviour and stress since it