A study on nanosized cerium oxides systems
for environmental catalysis
Othon ADAMOPOULOS
Licentiate thesis
The Royal Institute of Technology Dept of Materials Science & EngineeringMaterials Chemistry Division
The Royal Institute of Technology Dept of Materials Science & Engineering Materials Chemistry Division
S-100 44 Stockholm • Sweden
Akademisk avhandling som med tillstånd av Kungl. Tekniska Högskolan framlägges till offentlig granskning för avläggande av teknisk licentiatexamen fredagen den 6 juni 2003 kl 14:00 i konferensrummet 4tr (rumsnummer K408), Institutionen för Materialvetenskap, Brinellvägen 23, Kungl. Tekniska Högskolan, Stockholm. Avhandlingen försvaras på engelska.
ISBN 91-7283-552-4
ISRN KTH/MSE--03/29--SE+CHEM/AVH
Opponent: Emilia BJÖRNBOM, Assoc. Professor The Royal Institute of Technology (KTH) Dept of Chemical Engineering and Technology Chemical Reaction Engineering
ABSTRACT
This thesis concerns a study on the synthesis and characterisation of nanostructured ceria composites aiming at the enhancement of performance and thermal stability. These features are highly demanded in environmental catalysis, an area of great importance. While the worldwide motor vehicle production has been increasing dramatically during the last decades, environment has been contaminated with the exhaust gases of the automobiles, the most common of which are HCs, CO and NOx. With the advent of the three way catalytic converters, these detrimental gases can be simultaneously converted into harmless H2O, N2 and less harmful CO2. Such a conversion should be accomplished in as wide as possible range of air/fuel ratio, the so-called ‘lambda (λ) window’.
This λ-window is mainly provided by ceria (CeO2), one of the main washcoat constitutes of these catalytic converters, due to its specific property of oxygen storage capacity. The performance properties of ceria can be enhanced via doping, i.e. partial substitution by other cations in its crystal lattice to create vacancies, and via nanostructuring to create surface crystal defects for more active sites. However, the performance of ceria deteriorates due to particles growth after extended use of the catalytic converters at high temperature. Therefore, there is a strong demand for an enhanced thermal stability of these materials. In the present study, this has been achieved by coating Al2O3 on the nanosized particles of doped ceria, Ce1-xMexO2-δ.
A new method has been developed for the synthesis of nanosized particles of Zr- and/or Ca-doped ceria, which are coated with Al2O3. The synthesis was accomplished in three major steps: (1) co-precipitation of cerium oxalate and other compounds of doping components, e.g. zirconium and/or calcium, (2) sequential precipitation of Al(OH)3 over the former particles, and (3) calcination of the precipitated precursors to the oxides. Several compositions have been synthesised and their physicochemical properties are compared with commercial state-of-the-art material. In the case of Ca doping, a procedure of simultaneous co-precipitation of all doping components including Al(OH)3 was also tested for comparison. It has been found that the sequential precipitation of Al(OH)3 is advantageous in theformation of Al2O3-coating on the nanosized particles of doped ceria. The Al2O3 coated layer canhinder the particles growth during the heat treatment at high temperatures, thus maintaining the materials with large specific surface area, high oxygen storage capacity and activity.
Moreover, nanosized Ce-Cu-O powders have been synthesised via co-precipitation approach. Detailed XRD study does not show the formation of solid solution, as in the cases of Zr and Ca doping, but the composites consist of two separate oxides. X-ray absorption spectroscopy study revealed a variation of the existence of Cu and Ce in several oxidation states. Copper oxide seems to exist evenly distributed along the surfaces and boundaries of the crystal grains of CeO2. The temperature-programmed reduction indicated that the Ce-Cu-O composite has an enhanced oxygen storage capacity, as well as its increased reactivity at much lower temperature compared to the pure CeO2 alone.
Keywords: catalyst preparation; doping; catalyst characterisation; oxalate co-precipitation; nanosize; ceria; oxygen storage capacity; metal oxide catalyst
LIST OF SUPPLEMENTS
The thesis is based on the following supplements, referred to with the corresponding Roman numerals.
I. Othon Adamopoulos, Eva Björkman, Yu Zhang, Mamoun Muhammed, Tassilo Bog, Lothar Mussmann, Egbert Lox, ‘Nanophase Catalytic Oxides: II. Al2O3-coated nanosized
Ce1-xZrxO2-δ for high temperature resistance applications’, manuscript to be submitted to
‘Applied Catalysis B: Environmental’
II. Othon Adamopoulos, Eva Björkman, Yu Zhang, Mamoun Muhammed, Tassilo Bog, Lothar Mussmann, Egbert Lox, ‘Nanophase Catalytic Oxides: III. Al2O3-coated nanosized
Ce1-x-yCaxZryO2-δ for high temperature resistance applications’, manuscript to be submitted to ‘Applied Catalysis B: Environmental’
III. O. Adamopoulos, Yu Zhang, M. Croft, I. Zakharchenko, T. Tsakalakos, M. Muhammed, ‘The characterisation and reactivity of nanostructured cerium-copper-oxide composites
for environmental catalysis’, Materials Research Society, Symposium Proceedings, ‘Synthesis, Functional Properties and Applications of Nanostructures’, Volume 676, Y8.11, 2001
Supplement I: I have performed the experimental work: synthesis reactor construction,
synthesis of the samples, characterisation analyses performance. I have also written the article.
Supplement II: I have performed the experimental work: synthesis reactor construction,
synthesis of samples, characterisation analyses performance. Moreover, I wrote the article.
Supplement III: I have carried out the synthesis of the samples and their characterisation
analyses, excluding the XAS and the TPR study. Additionally, I wrote most of the article.
Other paper:
IV. O. Adamopoulos, E. Björkman, Yu Zhang and M. Muhammed, ‘Characterization and reactivity of
nanostructured ceria doped with zirconium and manganese’, manuscript
Conference participations:
1) ‘Characterisation and reactivity of nanosized Al2O3-coated CexMe1-xO2-δ for environmental catalysis’, O. Adamopoulos, E. Björkman, Yu Zhang, M. Muhammed, A. Wolf, T. Bog, L. Mussmann, E. Lox, ‘XXXVI. Jahrestreffen Deutscher Katalytiker’, Weimer - Germany, March 19-21 ’03 (poster presentation)
2) ‘Characterisation and reactivity of nanostructured ceria doped with zirconium and manganese’, O. Adamopoulos, E. Björkman, Yu Zhang, M. Muhammed, Sixth International Conference on Nanostructured Materials, Orlando - FL, United States of America, June 16-21 ’02 (poster presentation)
3) ‘The role of copper in nanostructured ceria’, O. Adamopoulos, E. Björkman, Yu Zhang, M. Muhammed, M. Croft, I. Zakharchenko, T. Tsakalakos, Sixth International Conference on Nanostructured Materials, Orlando - FL, United States of America, June 16-21 ’02 (poster presentation)
4) ‘Synthesis of nanostructured CexMe1-xO2-δ for environmental catalysis’, O. Adamopoulos, Yu Zhang, M. Muhammed, Graduate Students Conference 2001, Materials Science & Engineering Dept, The Royal Institute of Technology, Djurönäset - Sweden, 8-9 May ’01 (oral presentation) 5) ‘The characterisation and reactivity of nanostructured Ce-Cu-O composites for environmental catalysis’, O.
Adamopoulos, Yu Zhang, M. Croft, I. Zakharchenko, T. Tsakalakos and M. Muhammed, Materials Research Society Conference, San Francisco - CA, United States of America, April 16-20 ’01 (poster presentation)
Patent application:
‘An Oxygen Storing Material, Process for its Preparation and its Application in a Catalyst’, O. Adamopoulos, E. Björkman, Yu Zhang, M. Muhammed, T. Bog, L. Mussmann, E. Lox, German filed patent application.
LIST OF CONTENTS
1. INTRODUCTION... 1
1.1. Nanomaterials and Catalysis ... 1
1.1.1. Nanomaterials ... 1
1.1.2. Catalytic converters ... 2
1.1.3. Nanomaterials and catalysts ... 2
1.1.4. Three way catalysts ... 4
1.1.5. Ceria... 6
1.1.6. Doping ceria... 7
1.2. Synthesis... 8
1.2.1. Precipitation in solution/stirred reactor ... 8
1.2.2. Basics of nucleation... 9
1.2.3. Homogeneous/heterogeneous precipitation ... 9
1.2.4. Precipitation thermodynamic modelling ... 10
1.3. Objectives of the work ... 11
2. EXPERIMENTAL PART ... 13
2.1. Synthesis... 13
2.1.1. Chemicals and solutions... 13
2.1.2. Synthesis procedure... 13 2.1.3. Synthesis reactor ... 15 2.2. Characterisation... 15 2.2.1. Physicochemical Characterisation ... 16 2.2.1.1. Chemical analysis... 16 2.2.1.2. Thermogravimetric analysis ... 16 2.2.1.3. Crystallographic analysis ... 16
2.2.1.4. Specific surface area measurements... 19
2.2.1.5. Density measurements... 20
2.2.1.6. Particle size measurements... 21
2.2.1.7. Morphology study ... 21
2.2.2. Oxygen storage capacity measurements ... 21
3. RESULTS & DISCUSSION... 25
3.1. System Ce1-xZrxO2-δ·yAl2O3... 25 3.1.1. Effect of doping ... 25 3.1.2. Effect of Al2O3-coating ... 27 3.1.3. Effect of aging ... 28 3.2. System Ce1-xCaxO2-δ·yAl2O3... 29 3.2.1. Effect of doping ... 29 3.2.2. Effect of Al2O3-coating ... 31 3.2.3. Effect of aging ... 31 3.3. System Ce-Cu-O... 32 3.3.1. Crystallographic analysis ... 33 3.3.1.1. XAS study ... 33 3.3.2. Origin of Ce4+ and Cu+... 35 3.3.3. Temperature-programmed reduction ... 36 4. CONCLUSIONS... 39 5. FUTURE WORK ... 41 6. ACKNOWLEDGEMENTS... 43 7. BIBLIOGRAPHY ... 45
Nomenclature
A/F Air to fuel ratio HC Hydrocarbon TWC Three way catalyst CCC Close-coupled catalyst FCC Face centered cubic OSC Oxygen storage capacity
EDTA Ethylene-diamine-tetra-acetic acid EDS Energy dispersive spectroscopy SEM Scanning electron microscopy AAS Atomic absorption spectrophotometry TGA Thermogravimetric analysis
XRD X-ray diffraction
ICDD International center for diffraction data XAS X-ray absorption spectroscopy XANES X-ray absorption near edge structure EXAFS Extended x-ray absorption fine structure BET Brunauer-Emmit-Teller
DLS Dynamic light scattering PSD Particle size distribution
TEM Transmission electron microscopy MS Mass spectrometer
Tign Ignition temperature WL White line
TPR Temperature programmed reduction
Symbols
R Radius of sphere α Lattice parameter θ Diffraction angle
d Crystallographic planes distance K Constant
λ X-ray wave-length
β Pure diffraction line width S Specific surface area
ρ Density
m Mass of a formula unit V Volume of the unit cell
Z Number of formula units per cell Mw Molecular weight
1. Introduction
1.1. Nanomaterials and Catalysis
1.1.1. Nanomaterials
he concept of nanostructured materials has its origin in physics and dates back 20 years -approximately. It is a result of technological developments in instrumentation for production and characterisation of nanostructures, in combination with increased computing power for quantum chemical calculations and development of theoretical models[1]. Nanostructured materials are defined as being assembled of ultra fine particles with a dimension below 100 nm. They exhibit properties that are usually rather different to those of bulk materials and their local solid-state structure is often of prime importance.
The prospective impact of nanomaterials in science and technology is high, and stems from their unique properties, such as novel mechanical and magnetic properties, ordered self-assembly of nanocrystals, size and shape dependent catalytic properties. The various types of nanostructured materials share the three following features [2]:
Atomic domains spatially confined to less than 100 nm
Significant atom fractions associated with less ordered interfacial environments
T
Interactions between their constituent domains.
1.1.2. Catalytic converters
Between 1950-1990, the worldwide annual motor vehicle production increased from eight to 50 million. With the industrialisation of the Third World, the number of automobiles in the world is expected to increase even more dramatically. The impact of automobiles on the environment is huge, and their exhaust pollutants can be divided into four main groups:
1. CO and HCs. The CO and some of the hydrocarbons (HCs) are mainly formed due to incomplete combustion in regions of oxygen deficiency in the engine. There are also HCs emissions due to unburned fuel. The CO is fatal to man in low concentrations, but is mainly a problem in areas of heavy traffic, since CO is eventually converted to CO2
2. NOx (NO and NO2). The NOx is formed through reactions between N2 (from the air and fuel-derived N-containing compounds) and O2 during the combustion. In the presence of HCs, NOx can react to form photochemical smog containing for instance ozone, which damages forests and plants and is unhealthy to humans. The NOx is also an acidification cause
3. SOx (SO2 and SO3). The SOx originates from S in the fuel and in the lubrications oil, which is oxidised in the engine. The SOx causes acidification
4. Greenhouse gases: mainly CO2, but also CH4 and N2O. These gases absorb infrared light, emitted form the earth, and thus are believed to be responsible for the atmospheric air temperature rise. Besides being a greenhouse gas, N2O may reach the stratosphere, where it reacts with ozone and thereby it decreases the ozone layer [3].
1.1.3. Nanomaterials and catalysts
One of the most important applications of nanocrystals has been in catalysis. A larger percentage of surface atoms greatly increases the surfaces activities. The unique surface structure, electronic states, and largely exposed surface area are required for stimulating and promoting chemical reactions. The size-dependent catalytic properties of nanocrystals have been widely studied, while investigations on the shape (facet)-dependent catalytic behaviour are cumbersome [4,5].
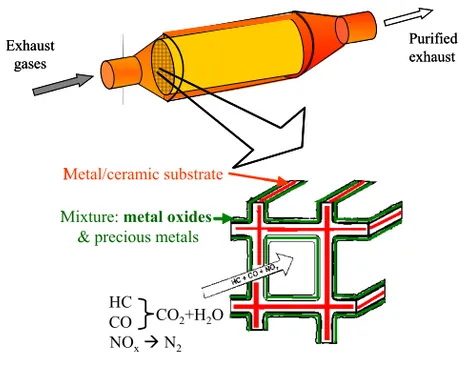
Environmental catalysis is an area of increasing interest [6]. By offering an alternative, less energy demanding, chemical reaction path, the catalyst increases the rate at which the system goes towards thermodynamic equilibrium. Much research is devoted to developing catalytic materials with high activity and high selectivity. A catalyst may be present either in the same phase as the reactants (homogeneous catalysis), or in a different one (heterogeneous). Commercial heterogeneous catalysts often consist of three components: a support, an active phase and a binder [7]. Such an automobile catalytic converter is shown in Fig. 1.
Fig. 1. A substrate cell with deposited washcoat of an automobile catalytic converter.
There are several reasons why nanostructured materials are preferred in catalysis. One of them is the introduction of high-energetic highly mobile surfaces, which is significant, since -at the atomic level- catalysis is a very dynamic process. Moreover, the ultimate goal is to design the active sites of the catalyst by atomically engineering its structure. Nanometer-sized materials are, in fact, not new in catalysis, considering that conventional catalytic materials, developed some 15-55 years ago, were also based on microstructures with particle size in the range of 1-20 nm [8]. Nevertheless, the
Exhaust gases Purified exhaust Exhaust gases Purified exhaust Metal/ceramic substrate
Mixture: metal oxides & precious metals
HC CO NOx N2
CO2+H2O
Metal/ceramic substrate
Mixture: metal oxides & precious metals
Metal/ceramic substrate Metal/ceramic substrate
Mixture: metal oxides & precious metals Mixture: metal oxides
& precious metals
HC CO NOx N2
approach of tailoring the active sites of a catalyst at the molecular level, combined with the nanometer size, is rather new [9].
1.1.4. Three way catalyst
The use of catalysts for an after-treatment of the car-exhaust gases started in the USA in 1974 with the oxidising catalyst, which was able to oxidise HCs and CO, but not the NOx emissions. As a matter of fact, the Three Way Catalysts (TWCs) were commercialised in 1979. This system is capable of simultaneously oxidising CO, HCs and reducing the NOx to about 90% in the exhaust. Using cleaner fuels can diminish SOx group, although the reformulation process that removes S increases the fuel cost somewhat. Actually, the largest problem not solved by the use of catalysts is CO2 in greenhouse gases, an end product in all fossil-fuel combustion [10].
The automotive TWC system operates under the conditions of a certain range of air/fuel (A/F) ratios, which is controlled by an oxygen sensor device. To guarantee this, the A/F mixture is regulated by a closed-loop control electronic injection system in combination with an oxygen sensor (also called lambda-sensor) that is needed to regulate the fuel injection system. Common TWCs consist of precious metals (Pt, Rd, Pd), promoters and supports (c/o Fig. 1) -e.g., γ-alumina. It is known that the addition of CeO2 -as a promoter- results in an improvement in the dynamic performance for the removal of CO, NOx and HCs under condition with rich-lean A/F variation in the automotive exhaust -the so-called oxygen storage capacity (OSC) [11,12,13]. However, thermally severe conditions of use in the automotive engine system had significant degradation, including surface area loss of alumina supports, sintering of supported precious metals and deactivation of added ceria.
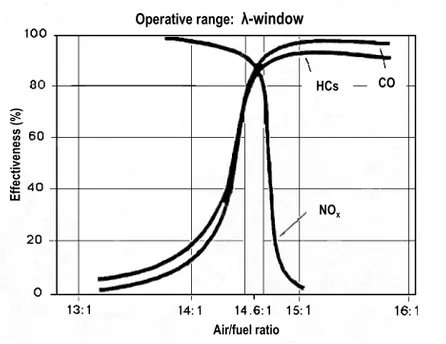
Within a suitable range of air/fuel ratio (the so-called lambda window, λ), the catalyst simultaneously converts the three most harmful components of the exhaust gases, namely NO, CO and unburned HCs into N2, CO2 and H2O, respectively (c/o Eq. 1, Eq. 2, Eq. 3).
NO(g) N2(g) + O2(g) Eq. 1
CxHy(g) + (x+y/4)O2(g) xCO2(g) + y/2H2O(g) Eq. 3
Outside this window (c/o Fig. 2 [14]), the TWC has lower efficiency to convert all three components simultaneously. The oxygen storage capacity of CeO2 is utilised in a TWC to widen the range of the lambda window, and so to extend the efficiency of the catalyst to a wider range of redox conditions [3]. Additionally, recent efforts have been made to increase the oxygen storage capacity of CeO2, its catalytic activity for oxidation of CO and CH4 and for the reduction of SO2 with CO [15,16,17]. Nanoparticles of non-stoichiometric CeO2-δ were found to have higher catalytic activity than the stoichiometric CeO2 [15,18].
Fig. 2. The efficient operation of a TWC is obtained within the λ-window.
The increasing restrictions for the standards of the automotive emissions have set new challenges for the development of the new automotive TWCs. In fact, a major problem of the TWCs is that significant conversions are attained at high temperatures (>380oC). As a result, during the cold-start of the engine, the emissions of the pollutants -particularly the HCs- are quite high until the converter reaches its operating temperature. Accordingly, inclusion of the cold-start in the engine test, and the remarkably low limits requited in the near future for the HCs emissions demanded for
Air/fuel ratio Operative range: λ-window
NOx HCs CO Ef fe ct iv en es s (% ) Air/fuel ratio Operative range: λ-window
NOx HCs CO Ef fe ct iv en es s (% )
the development of the so-called close-coupled catalyst (CCC). These catalysts -being manifold mounted- experience temperatures up to 1000-1100oC, and therefore require an extremely high thermal resistance [19].
1.1.5. Ceria
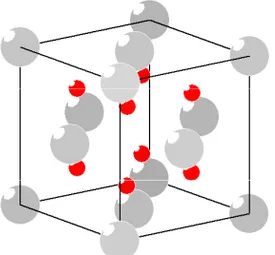
Cerium dioxide or ceria (CeO2), a rare earth oxide, is a stable yellow-white salt with fluorite structure, a face centred cubic (fcc) crystal structure (c/o Fig. 3). The Ce(IV) is both easily and rapidly reduced to Ce(III) by releasing simultaneously oxygen (c/o Eq. 4).
CeO2 CeO2-δ + δ/2O2 Eq. 4
Thereby, a nonstoichiometric oxide (CeO2-δ) is formed with oxygen vacancies in the crystal structure and the Ce(III) is readily reoxidised, making the material suitable for redox related catalytic applications. At fuel rich exhaust conditions, the Ce(III) ion is formed by oxygen release, whereas at lean conditions Ce(IV) is recreated by oxygen uptake. This renders ceria an important component in TWC.
Fig. 3. CeO2 is a stable yellow-white salt
with fluorite structure; a face centred cubic crystal structure. The black and grey spheres denote for the oxygen and cerium atoms in ceria structure –respectively.
A remarkable enhancement on the OSC and potentially catalytic activity of cerium oxide has been observed when the powder is of nanophase dimensions, because of the large number of lattice defects such as oxygen vacancies, which provide a large
number of active sites for gas-solid catalysis [16]. The number of defects can be increased by partial substitution (i.e., doping) of the cerium atoms in the cerium oxide lattice with other metal atoms of lower oxidation state, such as Ca or Nd. Because of these properties, doped cerium nano-oxides can act as catalysts themselves, reducing scientifically the need for noble metals [16,20]. When deposited upon porous ceramic or metallic substrates, such as honeycombs, the whole system can be used for high-temperature catalytic applications.
The CeO2 is currently receiving great interest in the context of the TWC technology for the treatment of car exhausts, since CeO2:
exhibits oxygen storage capacity due to a facile reduction-oxidation (redox) reaction
can promote the oxidation of CO and HCs, employing lattice oxygen
is an active center for the NOx decomposition even in the absence of a noble metal
stores and releases oxygen under lean and rich conditions –respectively favours catalytic activity at the interfacial metal-support sites
can promote the noble metal dispersion and increase their stability promotes the water gas shift and steam reforming reactions [21,22,23].
1.1.6. Doping ceria
By doping CeO2 -i.e., a part of the cerium is substituted with other cations to form a solid solution- its oxygen storage properties may be improved. Doping creates additional structural defects, influences the oxygen storage capacity, the oxygen ion mobility and as a consequence the catalytic properties, affects the phase stability and the ageing properties of CeO2. Quite much work has been carried out and several papers have been published about doped CeO2 with various cations-dopants, such as Ca, Al, Zr, Nd, Pb, Mn, Mg, Cu, Zn, Co, Y, Ba and Sr [16,24,25,26,27,28,29,30,31,32,33,34,35,36,37,38].
The nature of the dopant (e.g., electron affinity, size, valence) affects the features of the created oxygen vacancies, like the size and the chemical moiety. This should make it possible to create a material optimised for catalytic purposes with respect to choice of dopant and its concentration. Particularly, so that CeO2 could be doped with other
dopants and form such an ionic solid, the ionic radii of the metal elements-dopants should be within about 15% of each other, widely speaking. Besides, the crystal structure of the two pure metals should be the same, for this indicated that the directional forces between the two types of atom would be compatible with each other. The cations with radius within about ± 15% compared to that of Ce+4 are: Zr+4, Mg+2, Co+2, Co+3, Zn+2, Pb+4, Mn+2, Mn+3, Y+3, Cu+2, Nd+3, Ca+2, Cu+1 and Ce+3 –in priority order of ionic radii with higher values.
As to the crystal structure of the oxides of the candidate dopants, Mn+2,+3,+4, Mg+2, Co+2, Cu+1, Zr+4, Pb+4, Y+3, Ca+2, Nd+3, Sr+2 and Ba+2 can have fcc structure, i.e. the same as of CeO2; hence these elements have more possibilities to form ionic solid solutions with ceria. The coordination number of some of the candidate dopant-cations in their oxides is also of prime significance. For instance, ZrO2 has exactly the same coordination number of M and O (M:O) as CeO2 -i.e., 8:4.
1.2. Synthesis
1.2.1. Precipitation in solution/stirred reactor
recipitation of a solid from a solution is a common method for the fabrication of fine particles. The general procedure involves reactions in aqueous or non-aqueous solutions containing soluble or suspended salts. Once the solution becomes supersaturated with the product, a precipitate is formed either by homogenous or heterogeneous precipitation. Chemical co-precipitation technique can provide uniform nucleation, growth and aging of the particles throughout the solution. Particles size and morphology can be controlled by changing different reaction parameters. This method is frequently inexpensive and relies on simple bench chemistry to synthesize ‘ideal’ (submicron and monosized) precursor particles, although the process of controlling the precipitation is more complex.
For obtaining the co-precipitate of well-defined stoichiometry of metal ions in bulk solution, the following conditions must be considered:
pH and anion concentration in the mixed solution must provide the highest degree of supersaturation for all dissolved metals simultaneously
appropriate equipment must be used to insure instantaneous and complete mixing of the soluble cation and anion solutions
counter ions must be selected for both solutions which do not interfere with the precipitating process and can be removed via high temperature processing. The formed compound of the precipitating agent should be insoluble in the mother solution and the precipitation kinetics should be fast. Another requirement of the precipitating reagents is that they should be multivalent (organic) compounds capable of coordinating more than one metal ion. Co-precipitation can be accomplished with a variety of precipitating reagents, such as oxalate, carbonate, citrate, polyacrylic acid, oxine and ethylene-diamine-tetra-acetic (EDTA) [39]. In the work presented herein, precipitation with oxalate –mainly- was performed.
1.2.2. Basics of nucleation
In the precipitation process, the salts of various elements are taken in the required proportion and dissolved in water or together with suitable solvents to acquire complete mixing on an atomic scale. A precipitating reagent is added, which results in the precipitation of the components at the required ratio. The precipitate is dried and handled in the same way as the powders apart from that normally there is no need for finer grinding. The separation of solid phase of various ionic species linked with each other by a chemical bond, form liquid phase, is called complete co-precipitation. Simultaneous precipitation refers to the precipitation of ionic species without chemical linkage. Co-precipitation process can result in either a crystalline or an amorphous precipitate [39].
1.2.3. Homogeneous/heterogeneous precipitation
A precipitation phenomenon denotes a relatively rapid formation of a solid product from a solution. Nielsen has published the classic presentation of precipitation, where both nucleation and growth mechanisms are discussed and combined to meaningful ends [40]. Many books and papers have dealt with the precipitation category and there are other reference sources for treating precipitation processes [41]. Homogeneous and heterogeneous nucleation refers to the formation of stable nuclei with or without foreign species, respectively. Precipitation refers to more than a nucleation phenomenon. It does not depend on the presence of solute crystalline matter, and in this respect, it does not involve secondary nucleation. Co-precipitation refers to the precipitation in which several constitutes of the solution are found in the same precipitate. It does not result
from homogeneous or heterogeneous nucleation process. Precipitation implies a dynamic system, composed of two or more phases. If carried out by rapid mixing of reactant, it is mostly subject to homogeneous nucleation-based phase change.
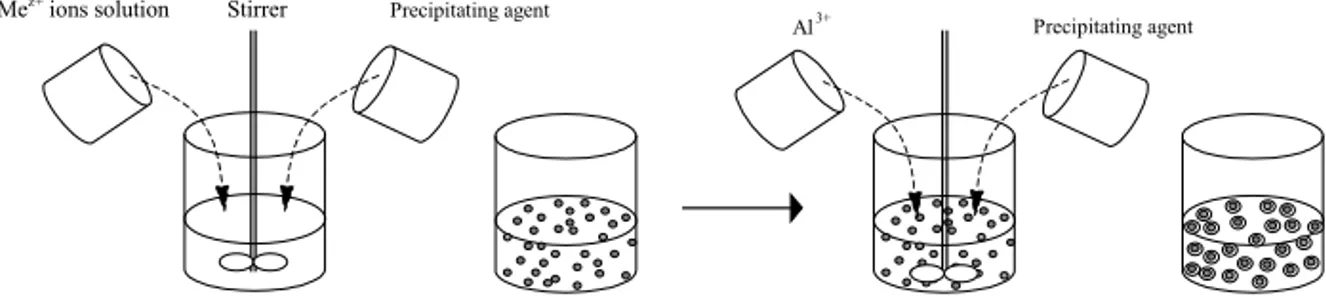
When the catalytic converter operates at high temperatures for a long time, CeO2-based catalyst is subject to severe temperature conditions, which lead to its particles growth and sintering. Therefore, there is a strong demand for maintaining the thermal stability of the CeO2-based catalysts. This is accomplished by coating these particles with Al2O3, which is performed in three parts. First, by the homogeneous precipitation of Ce-Me oxalate particles with high homogeneity under controlled conditions. These particles serve as seeds, and thus the required kinetic energy for the sequential, heterogeneous precipitation of Al(III) on them is lower; thereby, Al(OH)3 covers these seeds particles. Afterwards, the samples are heat treated at proper temperature for predetermined duration to form the corresponding oxide Ce1-xMexO2-δ coated with Al2O3. The schematic presentation of this process is presented in Fig. 4.
Precipitating agent
Al3+ Stirrer
Mez+ ions solution
Precipitating agent
Fig. 4. Schematic representation of the sequential precipitation of Al(III) over the already precipitated
Ce-Me oxalate particles that serve as seeds.
1.2.4. Precipitation thermodynamic modelling
Thermodynamic modelling helps to design suitable operating conditions, under which all the necessary components can be precipitated simultaneously at a required stoichiometry. The resulting powder precursor can be, in a highly homogenous form, a composite salt or at least, a mixture of several compounds evenly distributed at atomic levels. In addition, the morphology of the precipitate powder can easily be controlled. The computer software for modelling of the chemical equilibrium, developed at The Royal Institute of Technology, was used to assist in identifying these conditions. This program, Medusa [42], uses solubility products and formation constants for soluble complexes; details of this modelling have been published elsewhere [43,44]. Suitable conditions of,
e.g., pH, cation- and anion- concentrations, and method of mixing can be obtained using this software.
1.3. Objectives of the work
he objective of the work presented in this thesis is to develop a new method for the synthesis of nanosized Ca- and/or Zr- doped CeO2 coated with Al2O3 for high temperature resistance applications. This method is based on the sequential precipitation of some cations first, to be followed by the sequential precipitation of Al(III) over the already formed precipitates under controlled conditions. The synthesised materials are heated at the right temperature, and characterised with a variety of techniques. Their properties are analysed, evaluated and investigated in terms of their OSC and thermal stability, and compared with commercial state-of-the-art material. Another objective was to study the role of Cu in nanosized, non-miscible, mixed Ce-Cu oxides in terms of its oxidation state, position in ceria crystal structure and effect on the OSC.
2. Experimental part
2.1. Synthesis
2.1.1. Chemicals and solutions
anophase powders of CexMe1-xO2-δ·yAl2O3 were synthesised at room temperature via co-precipitation of Ce(NO3)3, Ca(NO3)2, Cu(NO3)2 with (NH4)2C2O4,Zr(NO3)4 or Al(NO3)3 dependent upon the composition of each material to be synthesised. State-of-the-art commercial Ce-Zr oxide with 30% wt Zr and 70% wt Ce, ZrO2 powder and Zr(NO3)4 solution with concentration of 30% wt ZrO2 were also used. Diluted solutions of NH4OH and HNO3 were used for the pH adjustment during the synthesis to maintain the pH values within the desired limits. Once the addition of the solutions was terminated, the precipitate was filtered off using water pump.
2.1.2. Synthesis procedure
Few systems have been studied: Ce1-x-yCaxMeyO2-δ·Al2O3, Ce1-xZrxO2-δ·zAl2O3 and Ce-Cu-O. Therefore, several samples with different chemical compositions have been
synthesised. To simplify the way of presenting the chemical composition of the samples, a nomenclature/identification has been used, according to which the first two letters denote the element, and the number next to it denotes the chemical composition (mol %) of its corresponding oxide in Ce1-xMexO2-δ. For example, Ce90Ca10 means that this compound consists of 90% CeO2 and 10% CaO. The abbreviations -or combination of them- in parenthesis denote for: (lit) literature, (p): precursor, (comm): commercial, (ppt): precipitation, (a): aged, (sim): simultaneous, (seq): sequential.
The time required for the completion of the synthesis with the desired composition was studied. Thereby, we could get aware of the time after which, the co-precipitation of Ce-Zr-Ox would be completed, and then the addition of Al3+ and its precipitation over the surface of Ce-Zr-Ox should be accomplished. Therefore, during the synthesis, small portions of samples were periodically removed from the synthesis reactor and analysed.
The homogeneity of synthesised materials, in terms of its chemical composition, was studied by EDS/SEM. Energy dispersive spectrometry (EDS, Oxford Link GEM) was used for the compositional and the elemental mapping analysis of the doped cations. The chemical analysis of several different points (5-10) on each sample was performed. Each measurement with the EDS last 3 min and the scanning area of the powder was in a few micros scale. For the homogeneity study, the ratio of the relative atomic concentration of each metal over the total metals atomic concentration for several points has been calculated. Then, the inhomogeinity is determined as the ratio of the standard deviation (sd) for each dopant over the average value (av) of each dopant.
The synthesised powders were dried and heated with rapid heating rate (ca. 10oC/min) up to 400oC where they remained for 2h in air (most of the samples), to confirm the full decomposition of the oxalate precursors, and then cool down to room temperature. Some samples were also calcined at higher temperature, i.e., 600oC for 3h. The conditions for the thermal treatment of the calcined samples (aging conditions) were further heating the samples with same heating rate up to 650oC where they remained for 4h in air, and then cooling down to room temperature. Most of the samples were synthesised at least three times under the same experimental conditions, and subsequently analysed. After achieving an acceptable reproducibility, large batches of each sample (approximately 45-75 g calcined material) were synthesised and subject to the same characterisation analysis techniques.
2.1.3. Synthesis reactor
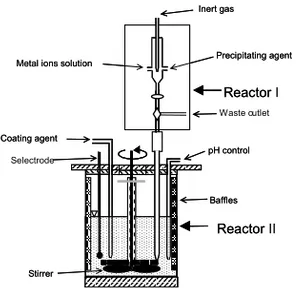
Large quantities of powders had to be synthesized -e.g., ca. 80g of calcined material, which is ca. 160g of the corresponding precursor. Therefore, a ‘laboratorial-scaled synthesis
reactor’ was constructed for the synthesis of such large batches of nanosized CexMe1-xO2-δ. Its schematic illustration is given in Fig. 5, where the 3-L reactor made of plexi-glass is shown. The mixed metal ions solution was added drop-wise with the oxalate solution simultaneously and automatically with the aid of peristaltic pumps of controlled speed. The addition of the solutions was accomplished at a rate of 5 ml·min-1 in the synthesis reactor under vigorous mechanical stirring at a suitable constant pH, where the desired co-precipitates formed.
Fig. 5. The synthesis reactor.
2.2. Characterisation
he characterisation of the different samples -i.e., filtrate liquor, precursor, calcined and aged material- were carried out using several techniques. An overview of the samples processing is schematically illustrated in Fig. 6, where
T
Selectrode Metal ions solution
Inert gas Reactor Precipitating agent pH control Reactor Stirrer Coating agent Waste outlet Baffles Metal ions solution
Inert gas Reactor II Precipitating agent pH control Reactor I Stirrer Coating agent Baffles 0.5 m
different characterisation techniques are indicated.
Fig. 6. The characterization flow-chart.
2.2.1. Physicochemical Characterisation
2.2.1.1. Chemical analysis
The chemical analysis of the filtrate, and the precursor or the calcined material was determined by atomic absorption spectrophotometry (AAS). The concentrations of Ca and Al were measured with the aid of AAS, SpectrAA-200, Varian. The chemical analysis of the powder samples was also performed with the aid of EDS/SEM.
2.2.1.2. Thermogravimetric analysis
The decomposition process and the weight loss of the precursor material as a function of the temperature were recorded under O2-N2 atmosphere by thermogravimetric analysis apparatus (Thermogravimetric Analyser, TGA 7, Perkin-Elmer Instr. Inc.). The heating and flow rates were 10oC·min-1 and 20 ml·min-1, respectively.
2.2.1.3. Crystallographic analysis
XRD study. X-ray diffraction (XRD) is by far the most important experimental tool in
the investigation of crystal structure of solids. A collimated x-ray beam with wavelength λ~0.5-2Å, is incident on a specimen and is diffracted by its crystalline phases. The
Metal ions solution Oxalate solution
Chemical analysis Filtrate Chemical analysis Thermogravimetric analysis Crystallographic analysis N2-sorption
Density, particle size distribution Electron microscopy
Oxygen storage capacity Nano-powder
Liquid/solid separation Synthesis Thermodynamic modelling
average crystallite size of a poly-crystalline material can be evaluated from measuring the broadening of the Bragg peaks that the material causes in an X-ray diffractogram. The average crystalline diameter (d111) is obtained from Eq. 5 (Scherrer’s equation [45,46,47]):
d111= θ β λ cos 111 K Eq. 5
where (K) is a constant depending on the particle shape and the line indices (herein K=0.9); (λ) is the X-ray wave-length; (β) is the pure diffraction line width which is corrected for Ka X-ray doublet separation and instrumental broadening and is expressed in radians in terms of (2θ); and (θ) is the Bragg angle [45].
In order to study if the desired oxides were obtained, the analysis of their crystallinity, phase identification and constituents of the powders was performed using a Philips PW 1012/20 X-ray diffractometre, equipped with a monochromatised X-ray beam employing the nickel-fitlered CuKα radiation (λ=1.5418 Å), operating at 35 kV and 25 mA. The data was compared to reference data form the International Centre for Diffraction Data (ICDD). Spectra were taken from 2θ=5-75o, with a 0.05o step size and a counting time of 0.5 sec. The lattice parameters were calculated for the ceria phase, based on the reported data of its four main peaks.
XAS study. X-ray absorption spectroscopy (XAS) is a family of spectroscopy
techniques for the determination of the oxidation states of metals in complex materials. It consists of two spectroscopy techniques: the x-ray absorption near edge structure (XANES) –or NEXAFS alternatively- and the extended x-ray absorption fine structure (EXAFS) -or SEXAFS alternatively. The XANES and the EXAFS involve the measurements of the X-ray photoabsorption of a selected element as a function of the energy below and above its core-shell electron binding energy, respectively. Therefore, the XAS provides structural information such as chemical bonding information, bond distances, coordination numbers, local structure of bulk solids, even with powder samples -crystalline or amorphous. The schematic setup of a typical EXAFS experiment at a synchrotron radiation facility is presented in Fig. 7 [48].
Fig. 7. The schematic setup of a typical EXAFS experiment at a synchrotron radiation facility.
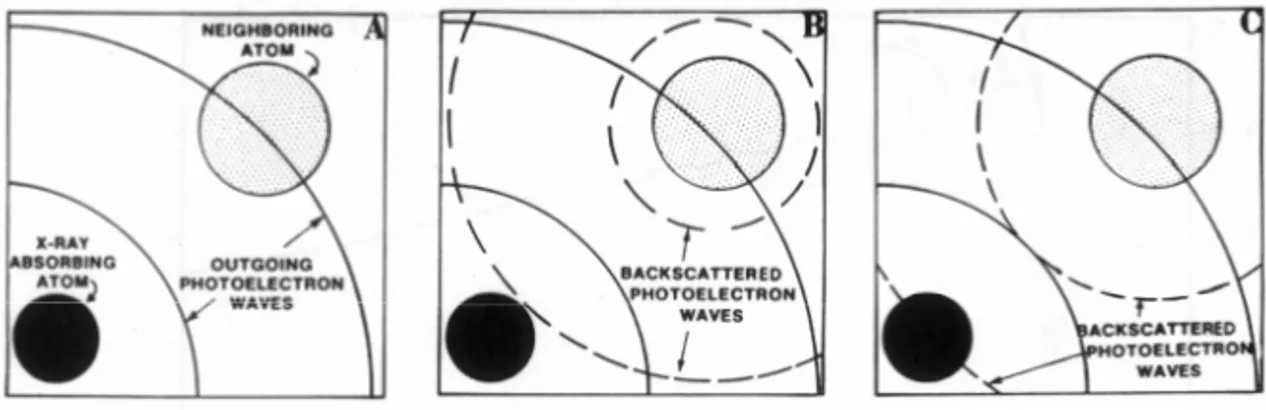
For X-ray energies greater than the binding energy, the absorption process leads to the excitation of the core electron to the ionization continuum. The resulting photoelectron wave propagates from the X-ray absorbing atom and is scattered by the neighboring atoms, as illustrated in Fig. 8 [48]. The EXAFS spectrum results from the constructive and destructive interference between the outgoing and incoming photoelectron waves at the absorbing atom. The interference gives rise to the modulatory structure –i.e., peaks and valleys- of the ray absorption versus incident X-ray energy, as in Fig. 9. This process also makes EXAFS unique –i.e, the absorbing atom acts as both the source and detector of the interference; that is the EXAFS phenomenon.
Fig. 8. The EXAFS spectrum results from the constructive and destructive interference between the
The XAS analysis was performed on the samples of the Ce1-xCuxO2 system. The measurements were performed in the fluorescence modes [13,14] on beam lines X-19A and X-18B at the Brookhaven National Synchrotron Light Source of the United States of America, using Si(111) double crystal channel cut monochromaters respectively. A standard was run simultaneously with all measurements for precise calibration. All spectra were normalized to unity step in the absorption coefficient from well below to well above the edge.
Fig. 9. Molybdenum K-edge X-ray spectrum for Molybdenum metal foil.
2.2.1.4. Specific surface area measurements
The particles specific surface area, SBET, of the samples was analysed using instrument based on the Brunauer-Emmett-Teller (BET) method (Gemini 2370 Surface Area Analyzer, Micromeritics Instrument Co.). The SBET was determined by N2(g) adsorption at a single- and multi-point partial pressures of N2(g). Prior to the physisorption measurements, the samples were outgassed for at least 30 min at 120oC under He.
The instrument uses a flowing-gas technique, in which the analysis gas flows into both the sample and blank tubes at the same time. The delivery rate of the gas into the sample tube is controlled by the rate, at which the sample can adsorb the gas onto the surface; the rate of flow into the balance tube is controlled to give the same pressure. As the sample adsorbs gas, the pressure tends to drop in the sample tube. A rapid response pressure balancing system continuously restores the pressure balance between the tubes
Energy (E) in eV 0.2 0.4 0.6 0.8 1.0 1.2 0.0 ln (Io /It ) Energy (E) in eV 0.2 0.4 0.6 0.8 1.0 1.2 0.0 ln (Io /It )
by admitting more gas into the sample side. The result is that the instrument maintains the pressure constant over the sample, while varying the rate of gas delivery to match the adsorption rate.
2.2.1.5. Density measurements
Pycnometer AccuPyc 1330, Micromeritics, Norcross – GA 30093-1877 was used for the study of the samples density. This is a fully automatic gas displacement pycnometre, which determines the density and the volume by measuring change of He in a calibrated volume. Furthermore, the particle size ( d ) of 1 g can be calculated from the Eq. 6, in conjunction with the results of the specific surface area (S) and density (ρ); provided that each particle is spherical and without any porosity.
d = 2
ρ
S
r= 6 Eq. 6
Additionally, the ‘x-density’ (ρ) may be calculated from the Eq. 7 [49,50], where (m) is the mass of a formula unit, (V) the volume of the unit cell, (Z) the number of formula units per cell, (Mw) the molecular weight of the chemical substance (g · mole-1), (a) the unit cell dimension and (NA) is 6.022*1023 (mole-1).
A w N a ZM V m 3 = = ρ Eq. 7
In the case of mixture of oxides, the density (ρ) was calculated from Eq. 8, where (X1) and (X2) are the atomic concentration of the mixed oxides, (ρ1) and (ρ2) their respective theoretical densities.
2 2 1 1 1 ρ ρ ρ X X + = Eq. 8
2.2.1.6. Particle size measurements
The particle size analysis of the powders has been performed with the aid of Dynamic Light Scattering (DLS) particle sizer (BI-90 Particle Size Analyser, Brookhaven Instrument Co.). This method has been proved both fast and reliable for obtaining reproducible results (in the range of between 3 nm-3 µm) of the average particle size and the particles size distribution. The de-agglomeration of the particle in suspension was first performed by adding small amount of the samples and few drops of surfactant Dispex A40 into de-ionised H2O. Afterwards, the dispersion of the solution took place for 1 min in a laboratorial ultrasonic bath (Vibrator, vibra–cell, Sonics & Materials Inc. Downbury – Connecticut).
2.2.1.7. Morphology study
The morphology characterisation, along with the elemental distribution and homogeneity, of the synthesised materials were carried out via scanning electron microscopy (SEM, JEOL JSM-25SII and JEOL JSM-880) operated at 20 kV. Electron micrographs were obtained when dispersed samples were gilded on SEM stubs (JEOL Ion Sputter JEE – 4B/4C). Additionally, EDS (Oxford Link GEM) was used for the compositional analysis and for the distribution analysis of the doped cations. Furthermore, transmission electron microscopy (TEM) observations were carried out using a Jeol 2000 EX instrument. The microscope was equipped with a LINK probe LZ-5 EDSX detector for EDS spectroscopy analysis, and was working at 200 kV.
2.2.2. Oxygen storage capacity measurements
The OSC of the samples has been investigated using a Micromeritics TPD/TPR 2900 Chemisorption Analyser, as well as a home-built temperature-programmed reduction (TPR) system. In the former case, the TPR analysis was performed on the samples of the Ce-Cu-O system, using 10% H2 in Ar as a reducing gas at a heating rate of 10oC/min.
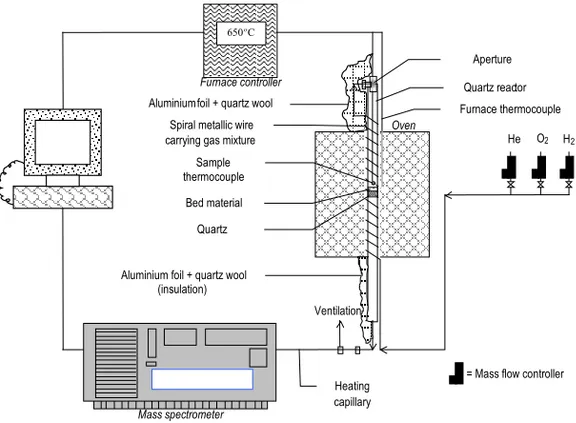
Set-up of home-built TPR system. A schematic representation of the home-built TPR
system is given in Fig. 10. It is computerised and consists of:
1. three digital mass flow controllers connected with gas flasks (H2(g), O2(g), He(g)) 2. a furnace with the cylindrical quartz reactor, and
3. the mass spectrometer apparatus (MS) as a detector.
Fig. 10. Schematic representation of the home-built TPR system.
An MS is an apparatus where a mixture of gaseous ions is separated according to the ratio mass/charge –i.e, m/e. A plot of the relative consecrations of gaseous ions as a function of m/e is a mass spectrum. The main components of a mass spectrometer are: an inlet system, an ion source, a mass analyser and a detector, all enclosed in a high vacuum chamber. The signals from the detector are processed and a readout or display of the spectrum is obtained. The sample has to be first vaporised in a heated inlet and part of the vapour or part of a gaseous sample reaches the ionising part, where ionisation is induced by electron bombardment, thermally or by using electric arcs or sparks. A magnetic field is usually applied in the analyser to separate ions of different m/e ratios [51]. In the present work, a quadropole mass spectrometer Mini Lab LM80/Spectra was used. Ventilation Oven He O 2 H 2 Sample thermocouple Bed material Quartz Spiral metallic wire carrying gas mixture
Aperture
Mass spectrometer
Heating capillary
= Mass flow controller Furnace controller
650 o C
Quartz reactor Furnace thermocouple
Aluminium foil + quartz wool (insulation) Aluminium foil + quartz wool
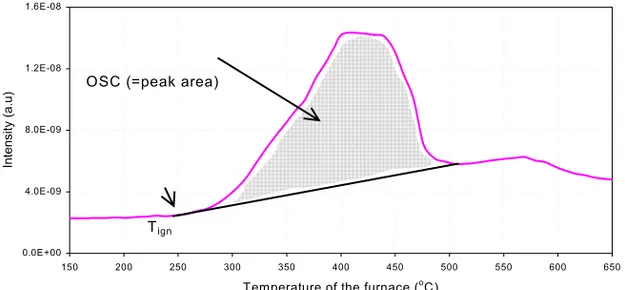
The OSC has been estimated from the area under the plots that show the H2O(g) production signal -as that has been recorded by the MS- as a function of the furnace temperature; an example is given in Fig. 11.
0.0E+00 4.0E-09 8.0E-09 1.2E-08 1.6E-08 150 200 250 300 350 400 450 500 550 600 650
Temperature of the furnace (oC)
In
te
ns
ity (a
.u
) OSC (=peak area)
Tign
Fig. 11. The OSC was estimated as the area below the peak of doped CeO2.
Experimental procedure. 0.10g of each sample was properly positioned inside the
TPR reactor, after pelletising, crushing, and sieving it to diameters between 0.075-0.500 mm. The samples were first oxidized during heating up to 500oC with a heating rate of 20oC·min-1 under 70 ml·min-1 total flow rate of He(g) (N47, Air Liquid) mixed with 10% O2(g) (N48, Air Liquid). Then, the sample was cooled down to room temperature under 50 ml·min-1 He(g). Afterwards, gas mixture with 70 ml·min-1 total flow rate of He(g) with 15% H2(g) (N48, Air Liquid) was introduced into the system at room temperature, until constant signal of H2(g) and stable temperatures of both the thermocouple above the sample and the furnace. Later, the sample was reduced up to 650oC with 10oC·min-1 where it remained for 1 min, to be afterwards cooled down to room temperature under 50 ml·min-1 He(g).
Data treatment. During a TPR measurement, both the temperature of the furnace and
the thermocouple, which was placed just above the sample, were recorded. On the surface of the bed material hydrogen is combusted to produce water, which is a highly exothermic reaction. The ignition temperature (Tign) was chosen to be presented instead of the maximum temperature (Tmax), because once an exothermic reaction has started, it
keeps going on since the energy required is automatically supported by the reaction itself. Furthermore, Tmax is dependent on several experimental conditions such as the OSC and the flow rate of gas. Particularly, a high OSC gives a high Tmax since more oxygen is available for the combustion of hydrogen, and a high flow rate decreases the Tmax since energy is transported out from the reaction zone. The Tign is defined as the temperature when the thermocouple above the bed indicated that the exothermic reaction has set off, by showing higher increasing rate for the temperature above the bed compared to the increasing rate of the temperature measured by thermocouple located inside the furnace walls –i.e., 150-250oC (c/o Fig. 11).
3. Results & discussion
3.1. System Ce
1-xZr
xO
2-δ·yAl
2O
3anoparticles of Ce1-xZrxO2-δcoated with Al2O3 with average crystallites size 6-20 nm have been synthesized by chemistry method under controlled conditions. Their synthesis has been accomplished in three major steps: (1) co-precipitation of cerium oxalate and zirconium oxide, (2) sequential precipitation of Al(OH)3 over the former particles, and (3) calcination of the precipitated precursors to the oxides. Several compositions have been synthesised and their physicochemical properties are compared with commercial state-of-the-art material. The Al2O3-coating hinders the particles growth at high temperatures, resulting in materials with a large specific surface area and a restrain in the decrease of the oxygen storage capacity, as a result of aging.
3.1.1. Effect of doping
Most of the Ce1-xZrxO2-δ·yAl2O3 samples consist of a single phase of CeO2, indicating that Zr was incorporated into the ceria lattice forming solid solution. No Al2O3–related peaks could be observed, probably because Al2O3 was x-ray amorphous. The four main XRD
peaks of ceria phase –i.e., (111), (200), (311) and (200)- of the calcined and aged samples have been used for the calculation of its lattice parameter (a). The results indicated that the doped samples retain the fluorite structure of ceria, with slightly distorted lattices. On the other hand, the XRD patterns of the sample Ce80Zr20(ZrO2) –i.e., synthesised by precipitation of Ce2(C2O4)3 with ZrO2 powder- not only did it have a phase of ceria, but an additional phase of ZrO2. Doping ceria with zirconium enhances its thermal stability. In particular, introducing Zr to the ceria lattice decreases the specific surface area of the calcined materials, while it increases the specific surface area of the aged ones (c/o Fig. 12). This observation agrees also with the literature data, according to which doping ceria with Zr enhances its thermal stability [52,53,54].
0 40 80 120 160 200
CeO2 Ce80Zr20 Ce63Zr37(comm) Ce80Zr20Al20 Ce80Zr20Al40
SBET
(m
2/g)
calcined aged
Fig. 12. The specific surface area of the calcined and aged synthesised materials.
When introducing Zr to the ceria lattice, its OSC is enhanced as shown in Fig. 13, where the relative OSC of the calcined and aged Ce1-xZrxO2-δ samples compared with the
CeO2 (i.e., calcined at 400oC for 2h) is presented –i.e., the ratios [OSC of Ce1-xZrxO2]/[OSC of CeO2] and [OSC of Ce1-xZrxO2-δ (a)]/[OSC of CeO2], respectively.
The commercial sample, though with the highest percentage of Zr content, i.e., 37 mol%, showed the lowest OSC compared to all other synthesised by co-precipitation samples. Additionally, introducing Zr to ceria lattice results in decrease of its Tign.
0.0 0.5 1.0 1.5 2.0
CeO2 Ce80Zr20 Ce63Zr37(comm) Ce80Zr20Al20 Ce80Zr20Al40
Relative OSC
calcined aged
Fig. 13. The effect of doping of ceria on its OSC is demonstrated by the ratios [OSC of
Ce1-xZrxO2-δ]/[OSC of CeO2-δ] and [OSC of Ce1-xZrxO2-δ (a)]/[OSC of CeO2-δ].
3.1.2. Effect of Al2O3-coating
The Al2O3-coating results in increase of the specific surface area of the calcined materials: the higher the Al2O3-coating, the higher the specific surface area, as shown by the comparison of the specific surface area of the calcined and aged samples Ce80Zr20, Ce80Zr20Al20 and Ce80Zr20Al40 (c/o Fig. 12). In particular, 20% and 40% Al2O3 -coating over the Ce80Zr20 sample resulted in 50% and 65% further increase of the specific surface area, respectively. The higher surface area of the Al2O3-coated materials indicates that Al2O3 was added as a layer around the particles, which suppressed the sintering effect on the particles growth during the heat treatment of the samples. The addition of Al2O3-coating over the Ce80Zr20 particles affected the OSC and increased the Tign, as well. In particular, in the case of the Ce80Zr20Al20 sample, addition of Al2O3-coating decreases the OSC 12%, and the Tign increases 21%. The addition of more Al2O3-coating on Ce80Zr20Al20 -i.e., Ce80Zr20Al40 sample- increases the OSC and the Tign 34% and 13%, respectively.
3.1.3. Effect of aging
As the XRD patterns of the calcined and the aged samples reveal, the heat-treatment increases the crystallinity in most of the cases, judging by the peak narrowing. On the other hand, the specific surface area of pure ceria decreases more than 80% after aging. Although not very remarkably, Zr-doping reduced the aging effect on the specific surface area, e.g., to a drop of 70% for Ce80Zr20(a) and 65% for Ce63Zr37(comm-a) compared to the corresponding calcined/fresh materials (c/o Fig. 12). However, the Al2O3-coating has shown a significant improvement for the maintenance of the specific surface area after aging. For instance, the specific surface area of Ce80Zr20Al40(a) sample is three times larger than that of Ce80Zr20(a). These results reveal that Al2O3–coating prevents the particles growth at high temperature, maintaining the particles separated from each other, and consequently hinders the decrease of the specific surface area.
The aging results in decrease of the OSC and Tign of all samples -either coated with Al2O3 or not. The decrease in OSC can be attributed to the particles growth during the aging, resulting in the subsequent decrease of the specific surface area of the samples. The state-of-the-art Ce63Zr37(comm) has the lowest OSC, even when compared with the aged ones. Decrease of the crystallites size results in increase of the OSC of the samples synthesised by co-precipitation. This occurs likely due to the increase of the active sites of Ce1-xZrxO2-δ, when the crystallites size decreases and consequently the specific surface area to volume ratio increases.
After aging, the OSC of the samples CeO2, Ce80Zr20, Ce80Zr20Al20 and Ce80Zr20Al40 decreased 6%, 11%, 25% and 6%, respectively. However, compared to that of CeO2(a) sample, the OSC of the last three aged samples is 12%, -15% and 54% higher (c/o Fig. 13). The last sample, Ce80Zr20Al40 had the highest OSC after aging. The Tign also decreased during aging: in particular the Tign of the samples CeO2-δ, Ce80Zr20, Ce80Zr20Al20 and Ce80Zr20Al40 decreased 0%, 11%, 26% and 16%, respectively. A low Tign indicates a more active surface on the material, which can release the buffered oxygen at lower temperature.
3.2. System Ce
1-xCa
xO
2-δ·yAl
2O
3anoparticles of Al2O3-coated Ce1-x-yCaxZryO2-δwith average crystallite size 7-20 nm have been synthesized by chemical method under controlled conditions. Samples have been synthesised with two procedures: (1) simultaneous co-precipitation of all the cations, and (2) sequential precipitation where some of the cations have been co-precipitated separately, followed by the subsequent precipitation of Al(OH)3 (c/o Fig. 14). The Al2O3-coating over Ce1-x-yCaxZryO2-δ results in materials with higher specific surface area and enhanced oxygen storage capacity, due to its limitation of the particles growth at high temperatures.
Fig. 14. The principles of the simultaneous co-precipitation (a), and the sequential precipitation of Al(III)
coating process (b).
3.2.1. Effect of doping
The doping of ceria with Ca enhances its OSC (c/o Fig. 15), which is also in agreement with earlier studies [16]. In particular, the sample Ce90Ca10 calcined at 600oC for 3h has
N
higher OSC and lower Tign than pure CeO2, –i.e., calcined at 400oC for 2h. Besides, comparing CeO2 and Ce90Ca10 samples both calcined at 600oC for 3h, it is evident that Ca-doping in ceria altered neither the specific surface area nor the density. Doping ceria with Ca decreased its crystallite size (dXRD), but has a little influence on the lattice parameter (c/o Paper II, Table 4).
0.0 0.2 0.4 0.6 0.8 1.0 1.2 Ce90Ca10 Ce90Ca10Al50(seq-b) Ce90Ca10Al50(sim-b) Ce90Ca10Al50(seq-r) Ce70Ca10Zr20Al20 CeO2 Relative OSC
Calcined at 600oC for Calcined at 400oC for
Fig. 15. Histograms showing the ratios [OSC Ce1-x-yCaxZryO2-δ·zAl2O3/OSC CeO2-δ]. Note the
first group of Ce1-x-yCaxZryO2-δ·zAl2Osamples has been calcined at 600oC for 3 h, while the second
group and CeO2-δ at 400oC for 2 h.
The ionic radii of Ce(IV), Ce(III), Ca(II) and Zr(IV) are 0.97 Å, 1.143 Å, 1.12 Å and 0.84 Å [55] respectively, in their corresponding oxides with the same coordination number as of Ce around O in CeO2 lattice -i.e., 8:4. The crystal structure of CaO is cubic, and of ZrO2 can be cubic as well. That is to say, these metal cations are expected to be miscible in CeO2 lattice and can be the substitution for Ce(IV) cations. That was confirmed by the XRD data, which indicated the formation of a single phase of ceria. The Ca-doping of ceria results in the formation of a non-stoichiometric compound containing oxygen vacancies and structural defects; the OSC enhancement is likely attributed to these vacancies and defects. The doping of ceria with both Zr and Ca seems not to affect the crystallite size dXRD, whilst it does change the lattice parameter of
the mixed oxide, which indicates the prompting distortion due to formation of structural defects in the CeO2 lattice.
3.2.2. Effect of Al2O3-coating
The effect of Al2O3-coating through the subsequent precipitation of Al(III) on the preformed precursor has been studied. The sequential precipitation of Al(OH)3 results in the formation of materials with higher Tign and 15% lower OSC compared to the simultaneously co-precipitated materials. A possible explanation is that during the sequential precipitation, more active sites are covered by Al(OH)3, resulting in a lower catalytic activity.
Furthermore, the specific surface area of the sequentially precipitated sample, no matter as a precursor, calcined or aged, is more than double compared to that of the simultaneously co-precipitated sample, manifesting the effect of Al2O3-coating (c/o Paper II, Table 4). The Al2O3–coating seems to prevent the particles growth when heated at high temperature, by maintaining the ceria particles separated from each other, thereby having high specific surface area even after aging. This is also verified by the comparison of the SBET of the samples of CeO2 and Ce90Ca10 both calcined at 600oC for 3h, which is the same, whilst the SBET was increased by 60% in the case of the sequential precipitation –i.e., Ce90Ca10Al50(seq-b) sample. This can be a result of the high SBET of Al2O3 itself and by the role of Al2O3-coating to prevent the growth of the Ce-Ca-oxalate particles. As to the crystal structure, Al2O3-coating does not seem to affect the single phase formation of ceria. No Al2O3–related peaks could be observed, probably because Al2O3 is x-ray amorphous at the temperature where the samples have been heat-treated.
3.2.3. Effect of aging
The XRD profiles of the calcined and aged samples show that the thermal treatment increases the crystallinity, as seen from the increase of the XRD peak heights and narrowing. The effect of aging on the physicochemical properties is shown by comparing the SBET of CeO2-δ calcined at 400oC for 2h, at 600oC for 3h and aged at 650oC for 4h, where the SBET of the last two samples decreased more than 50% and 80% respectively, due to the particles growth effect (c/o Paper II, Table 4). Furthermore, the Tign of most of the samples decreased after aging. The lower Tign, the better, since
Ce1-x-yCaxZryO2-δ·zAl2O3 can buffer oxygen at lower temperature, thus in that case, the amount of the produced toxic gases can be treated at lower temperatures.
Besides, aging results in a decrease of the SBET due to particles growth, but this drop is restrained by the Al2O3-coating. For instance, the SBET of the Ce90Ca10 sample decreased 24%, whilst the SBET of the Ce90Ca10Al50(seq-b) sample decreased 18% after aging. This significant effect of the Al2O3-coating on the SBET of the calcined and the aged samples is revealed in Fig. 16, where the relative decrease in specific surface area of aged and calcined materials is described by the ratio [100*SBET (aged)/SBET (calcined)].
0 20 40 60 80 100
Ce90Ca10 Ce90Ca10Al50(seq-b) Ce90Ca10A50(sim-b) Ce90Ca10Al50(seq-sr) Ce70Ca10Zr20A20 CeO2
100*SB ET ag ed /SB ET calcin e d ( % ) Calcined at 600
oC for 3h Calcined at 400oC for 2h
Fig. 16. The ratio [100*SBET (aged)/SBET (calcined)] of several Ce1-x-yCaxZryO2-δ·zAl2O3 samples is
presented. Note the first group of samples has been calcined at 600oC for 3 h, whilst the second at 400oC
for 2 h.
3.3. System Ce-Cu-O
anophase Ce-Cu-O powders have been synthesised via co-precipitation approach, whereas computer-assisted thermodynamic modelling was used to predict the optimum experimental criteria. The properties of Ce-Cu-O composites (10 mol% CuO) have been extensively investigated. The obtained materials show different morphology compared to other doped ceria oxides, with uniform distribution of Ce and Cu throughout the powder. Hardly does detailed XRD study show the formation of solid solution, but the composites consist of two separate metal oxides. X-ray absorption spectroscopy study shows a variation of the existence of Cu
and Ce in several oxidation states. Copper oxide seems to exist evenly distributed along the surfaces and boundaries of the crystal grains of CeO2 on the nanoscale. The temperature-programmed reduction indicated that Ce-Cu-O composite has an enhanced oxygen storage capacity compared to CeO2 or pure copper oxide.
3.3.1. Crystallographic analysis
The precipitated Ce:Cu oxalate is x-ray amorphous, while the oxalate precipitation of either Ce or Cu alone is a crystalline powder. This indicates that the precipitated Ce-Cu oxalate is metastable and the mixing of the Ce, Cu and oxalate on the atomic scale is probably the reason for the disordering of the powder. The lattice parameter (a) of the calcined materials (both CeO2 and Ce-Cu-O) is the same, indicating that Cu is probably not dissolved in the ceria phase. By careful analysis of the XRD data of the sample calcined at 600oC for 2h, it is seen that two weak peaks, characteristic of CuO, appear. Due to the low concentration of Cu in the sample, it is difficult to clearly identify these two peaks. Therefore, x-ray diffraction data using a strong radiation source has been collected.
3.3.1.1. XAS study
In order to investigate the Ce-Cu-O system, a detailed study using XAS has been undertaken.
Ce-L3 XAS. The Ce-L3 edges of the precursor and the calcined samples are presented in Fig. 17. The R-L3 edges are dominated by a sharp "white line" (WL) feature, due to 2p to 5d atomic like transitions. Unstable valence rare earth elements can support f-configurations, which differ by one 4f electron. The XAS spectrum of mixed valence rare earths manifest separate fn+1 and fn WL features split by 7-10 eV. The relative strengths of the fn and fn+1 related WL XAS features scale with the weights of these states in the initial configurations. The Ce-Cu oxalate spectrum manifests a single robust WL feature at the edge, typical of a pure Ce3+-4f1 state. By contrast, the Ce-Cu-O WL (c/o Fig. 17 and inset) exhibits a couple of distinct peaks (i.e., A and B) associated with the Ce4+-4fo and Ce3+-4f1 configurations.
The extended spatial character of the Ce-4f orbital leads to strong hybridisation/co-valency effects and to substantial f1 weight in Ce4+ compounds. Specifically, note in Fig. 17 the large f1 related feature (i.e., B
1-B2 in the inset), despite the formally Ce4+ state of CeO
manifested by the admixture of the 4f1L configuration (where the L refers to a ligand - O hole) into the Ce electronic configuration [56]. After this convention, the B1-B2 feature of the Ce-Cu-O is labelled with 4f1L. The strongly bimodal (A-B) WL feature of the Ce-Cu-O spectrum is clearly an indicator of the formally Ce4+ state. Since insulating Ce3+ compounds also exhibit their first WL-peak at the energy of the precursor peak, the pronounced chemical shift to higher energy of the Ce-Cu-O sample spectrum is also a signature of the formally Ce4+ state.
0 0.4 0.8 1.2 1.6 2 2.4 2.8 3.2 5.71 5.72 5.73 5.74 5.75 5.76 5.77 5.78 Energy (eV) Ce-L 3 edge [f1L] [f0] W L D [f1] C2 C C1 Ce4+ Ce3+ Ce3+ Ce:Cu-oxalate (9:1) coprecipitate Ce-O:Cu-O (9:1) 600 C 0 0.4 0.8 1.2 1.6 -200 -100 0 100 200 300 400 500 5.715 5.72 5.725 5.73 5.735 5.74 E = Energy (eV) Ce-L 3 edge [f1L] [f0] D A /(A 1-A2) B 2 B1 Ce-O:Cu-O (9:1) 600 C
Fig. 17. The Ce-L3 edges of Ce-Cu precursor and Ce-Cu-O calcined at 600oC samples. The inset
figure presents the derivative of the absorption coefficient (µ) with respect to energy dµ/dE for the Ce-L3 edge spectra of the Ce-Cu-O calcined at 600oC for two hours.
Cu-K XAS. Fig. 18 shows the Cu-K edges of the Ce-Cu oxalate, the Ce-Cu-O calcined
at 500oC and 600oC, and few standard compounds. Although weekly broadened, the spectra of the Ce-Cu-O oxides clearly coincide spectral-feature-for-spectral-feature and in chemical shift precisely with the CuO spectrum. Therefore, it is deduced that Cu in these materials occurs as CuO with other components being below the detection level. The spectrum of Ce-Cu oxalate is clearly strongly shifted to lower energy compared to that of CuO.