Seven years of experimental warming and nutrient addition causes decline of bryophytes and 1
lichens in alpine meadow and heath communities 2
3
Authors: Juha M. Alataloa*, Annika K. Jägerbrandb and Ulf Molauc 4
a Department of Ecology and Genetics, Uppsala University, Campus Gotland, SE-621 67 5
Visby, Sweden; b VTI, Swedish National Road and Transport Research Institute, Box 55685, 6
102 15 Stockholm, Sweden; c Department of Biological and Environmental Sciences, 7
University of Gothenburg, PO Box 461, SE-405 30 Gothenburg, Sweden. 8
9
*Corresponding author: E-mail: juha.alatalo@ebc.uu.se 10
11
Keywords: Arctic, climate change, cryptogams, dominant species, environmental change, 12
global change, meadow, heath, mosses, polar region, tundra 13 14 15
P
re
P
rin
ts
Abstract
16
Global change is predicted to have large and rapid impact on polar and alpine regions. 17
Bryophytes and lichens increase their importance in terms of biomass, carbon/nutrient 18
cycling, cover and ecosystem functioning at higher latitudes/altitudes. Here we report from a 19
seven year factorial experiment with nutrient addition and warming on the abundance of 20
bryophytes and lichens in an alpine meadow and heath community. Treatments had 21
significant negative effect on relative change of total abundance bryophytes and lichens, the 22
largest decline to the nutrient addition and the combined nutrient addition and warming 23
treatments, bryophytes decreasing most in the meadow, lichens most in the heath. Nutrient 24
addition, and the combined nutrient addition and warming brought rapid decrease in both 25
bryophytes and lichens, while warming had a delayed negative impact. Of sixteen species that 26
were included the statistical analyses, we found significant negative effects on seven species. 27
We show that impact of simulated global change on bryophytes and lichens differ in in time 28
and magnitude among treatments and plant communities. Our results underscore the 29
importance of longer-term studies to improve the quality of climate change models, as short-30
term studies are poor predictors of longer-term responses of bryophytes and lichens, similar to 31
what have been shown for vascular plants. Species-specific responses may differ in time, and 32
this will likely cause changes in the dominance structures of bryophytes and lichens over 33 time. 34 35
P
re
P
rin
ts
Introduction
36
Global change is affecting large areas of the globe through increased climate variability as 37
well as increased nutrient deposits. Both factors are mainly driven by deposits and emissions 38
from anthropogenic activities (Grandy et al. 2008; IPCC 2013; Clark et al. 2013). For 39
example, in China that has among the richest biodiversity in the world (Zhang et al. 2014), 40
climate change have been predicted to have great impact on wide variety of ecosystems in 41
priority areas of biodiversity conservation (Wu et al. 2014), and extinction risk of protected 42
plants is predicted to increase (Zhang et al. 2014). Climate change is also thought to have the 43
potential to rapidly affect polar and alpine regions. As the same regions are often nutrient 44
limited (Chapin et al. 1995; Mack et al. 2004), a combination of climate change and 45
increasing nutrient levels can be expected to have large impact on their ecosystems. The 46
number of studies on climate change has increased substantially and the pace seem to be 47
increasing (Andrew et al. 2013; Shen & Ma 2014). Some of the changes that have been 48
detected in a number of ecosystems around the world have been attributed to global change, 49
either as response to nutrient deposition or existing climate warming trend. The changes 50
include changes in species richness, composition of plant communities, poleward or upward 51
movement of species (Post et al. 2009; Maskell et al. 2010; Callaghan et al. 2011; Stöckli et 52
al. 2011; Pauli et al. 2012; Clark et al. 2013). However, the causes behind shifts in species
53
distributions can be difficult to pinpoint as a study on northward movement of vascular plants 54
in Great Britain using data from 1978 to 2011 found (Groom 2013). The results indicated that 55
the significant northward movement of plants was likely not due to climate warming, instead 56
the reason was likely due to other changes resulting from anthropogenic activities (Groom 57
2013). Global change can also have contrasting effects on species richness depending on the 58
nutrient status of the ecosystem (Chalcraft et al. 2008), and it is likely that the combination of 59
increased nutrient levels and warming can have interactive effects in cold and nutrient limited 60
P
re
P
rin
ts
ecosystems in polar and high alpine regions (Chapin et al. 1995; Mack et al. 2004). A 61
worrying example of how increased nutrient level can potentially impact climate change 62
comes from an experiment with 20 years of nutrient addition in Alaskan tundra where they 63
showed that increased nutrient availability caused a net ecosystem loss of carbon which could 64
lead to a positive feed back to climate warming (Mack et al. 2004). Other studies have 65
reported contrasting short and medium term responses, revealing non-linear responses to 66
treatments over time, indicating that longer-term responses may be difficult to predict 67
(Alatalo & Little 2014; Alatalo et al. 2014b). 68
Bryophytes and lichens tend to make up larger part of the cover and biomass on 69
higher altitudes and latitudes as the environment becomes harsher, this is partly an effect of 70
that the vascular plants become smaller in stature (Longton 1984; Jägerbrand et al. 2006). At 71
the same time their relative importance in the high altitude/latitude ecosystems increases due 72
to their influence on factors such as recruitment of vascular plants (Soudzilovskaia et al. 73
2011), permafrost stability (Harden et al. 2006; Romanovsky et al. 2010; Turetsky et al. 74
2012), water, carbon and nitrogen cycling (Turetsky 2003; Turetsky et al. 2012). Many of the 75
bryophyte and lichen species found in polar regions exhibits wide distributions, some being 76
circumpolar, making them important parts of ecosystem functioning even on global scale. 77
Recent research also show that migratory birds can transfer bryophyte diaspores bilpolary, 78
supporting bryophyte long range dispersal (Lewis et al. 2014). Bryophytes and lichens also 79
fill important roles in biological soil crusts in deserts world wide (Zhang 2005; Li et al. 2013). 80
Yet the number of experimental global change studies on bryophytes and lichens is small 81
compared to the number of studies on vascular plants in these severe environments, at least 82
when it comes to having a resolution at the species level, or community responses that include 83
bryophyte and lichen diversity (Potter et al. 1995; Alatalo 1998; Molau & Alatalo 1998; 84
Jägerbrand, Molau & Alatalo 2003; Jägerbrand et al. 2006, 2009; Klanderud 2008; Lang et al. 85
P
re
P
rin
ts
2009, 2012; Bjerke et al. 2011; Olsen & Klanderud 2014; Alatalo, Jägerbrand & Molau 86
2014a). In most cases when bryophytes are included in experimental global change studies, 87
they are grouped as “mosses” or “lichens” (Graglia et al. 2001; Hill & Henry 2011). This is 88
likely due to that ecologist commonly have problems to identify bryophytes and lichens to 89
species level (Turetsky et al. 2012). It is unsatisfactory that modeling studies on the impact of 90
climate change often seem to lack data on bryophytes and lichens as their predictions will be 91
of less value for high altitude, polar and desert regions due to their increasing importance in 92
severe environments. 93
Here we report on the impact of a seven-year factorial study with experimental 94
nutrient addition and warming on total community and individual species abundances of 95
dominant bryophytes and lichens in two contrasting alpine plant communities in subarctic 96
Sweden. 97
98
Material and Methods
99
Study area
100
Fieldwork took place at the Latnjajaure Field Station (LFS) in northern Sweden, at 1000 m 101
elevation in the valley of Latnjavagge (68°21´N, 18°29´E). Continuous climate data were 102
provided from the early spring of 1992 onwards. Climate is classified as sub-arctic (Polunin 103
1951) with snow cover for most of the year, cool summers, and relatively mild, snow-rich 104
winters. Mean annual temperatures ranged from –2.0 to –2.7°C between 1993 and 1999, with 105
winter minima of –27.3 to –21.7°C. Mean annual precipitation during this time period was 106
808 mm, with individual years ranging from a low 605 mm in 1996 up to 990 mm in 1993. 107
The warmest temperatures come in July, which had mean temperatures ranging from + 5.4°C 108
in 1992 to +9.9°C in 1997. Physical conditions in the valley vary from dry to wet and poor 109
P
re
P
rin
ts
and acidic to base-rich, with a variety of plant communities to match (Molau & Alatalo 1998; 110
Lindblad, Nyberg & Molau 2006; Alatalo et al. 2014b). 111
112
Experimental design
113
In July 1995, 20 plots (1 x 1 m) with homogenous vegetation cover were chosen in both the 114
meadow and heath plant communities and randomly assigned to treatments in a factorial 115
design. There were 8 control (CTR) plots and 4 plots for each of the experimental treatments 116
in each plant community: warming (T for temperature enhancement), nutrient addition (N) 117
and combined warming and nutrient addition (TN). Warming was induced by Open Top 118
Chambers (OTCs) that increase temperature by 1.5 to 3°C compared to control plots with 119
ambient temperature (Marion et al. 1997; Molau & Alatalo 1998). Nutrient addition consisted 120
of 5 g of nitrogen (as NH4NO3) and 5 g of phosphorus (P2O5) per m2, dissolved in 10 L of 121
meltwater. In 1995 all plots were analyzed with a point–frame method (Walker 1996) to 122
determine the species occurrences under natural conditions before implementing the 123
experimental treatments. The OTCs were then left on plots with warming treatments year-124
around, and nutrient addition was applied directly after the initial vegetation analyses in 1995 125
and a few days after snow melt in the subsequent years (1996-2001). The nutrient treatments 126
were then terminated after 2001. 127
128
Measurements
129
The majority of bryophytes and lichens in the plots were identified to the species level (with 130
help from experienced bryophyte taxonomist Sven Franzén), and cover of each species was 131
assessed using a 1 x 1 m frame with 100 grid points (Walker 1996) in the middle of the 1995, 132
1999, and 2001 growing seasons. To ensure accuracy and reproducibility, the same grid frame 133
was used for each measurement, and fixed points at the corner of each plot allowed the frame 134
P
re
P
rin
ts
to be placed in the same position within the plot at each different measuring point. This 135
method has been shown to be accurate in detecting changes in tundra vegetation (May & 136 Hollister 2012). 137 138 Data analysis 139
From the point-frame data, we summed the number of touches to pins within each plot to 140
produce plot-level abundance measures for each species. This was then used to calculate 141
relative changes in abundances. We included only the most dominant species in the analyses, 142
i.e. excluding those with less than 100 hits from the point framing (Table 1). For responses in 143
relative changes of total abundances of the most dominant bryophytes and lichens, GLM 144
(general linear model) was used to analyze significant responses of sites and treatments (both 145
as fixed factors) and their interactions. Species abundance was highly skewed and therefore 146
did not meet assumptions of normality, so instead of GLM we used nonparametric tests. 147
Kruskal-Wallis Test was used for analyzing the effect of all treatments as group on relative 148
changes of species specific abundances. When significant, Mann-Whitney U Test was used to 149
analyze the effect between treatments. All analyses were executed in SPSS version 19 (IBM). 150
151
Results
152
Impact on total abundance of the most dominant bryophytes and lichens
153
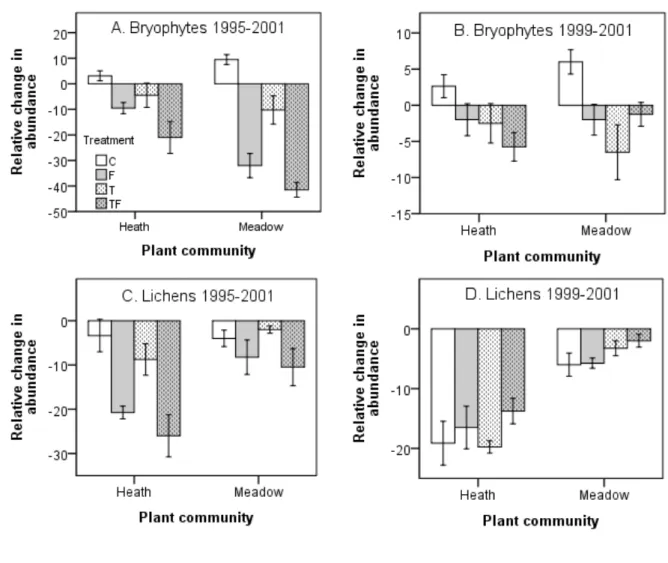
Total abundances of the most dominant bryophytes declined among years in response to the 154
treatments, with the largest decline found to the nutrient addition and the combined nutrient 155
addition and warming treatments (Figure 1, Tables 2, 3). The decline in bryophytes was 156
significantly larger in the rich meadow than in the poor heath community (Figure 1, Tables 2, 157
3). The treatments had somewhat different responses over time, nutrient addition and the 158
combined nutrient addition and warming causing a rapid decrease that then did not fall much 159
P
re
P
rin
ts
further between 1999 and 2001. In contrast warming had larger negative impact in the 160
meadow (but not in the heath) between 1999 and 2001, exhibiting a more delayed response 161
pattern compared to the nutrient addition (Figure 1). Bryophytes in control plots tended to 162
increase in both communities, with the increase extending though the whole period (Figure 1). 163
Total abundance of the most dominant lichens declined among years in response 164
to all treatments in the poor heath, the nutrient addition and combined nutrient addition and 165
warming having the largest negative impact (Figure 1, Tables 2, 3). This negative impact of 166
nutrient addition and the combined nutrient addition and warming extended throughout the 167
whole period. In the heath, treatments had no significant effect in the later period (1999 – 168
2001), when lichens decreased significantly in all treatments at the heath compared to the 169
meadow community (Figure 1, Tables 2, 3). The decline of lichens was significantly larger in 170
the poor heath compared to the rich meadow in both periods; 1995-2001 and 1999-2001 171
(Figure 1, Tables 2, 3). 172
173
Species specific responses of bryophytes and lichens
174
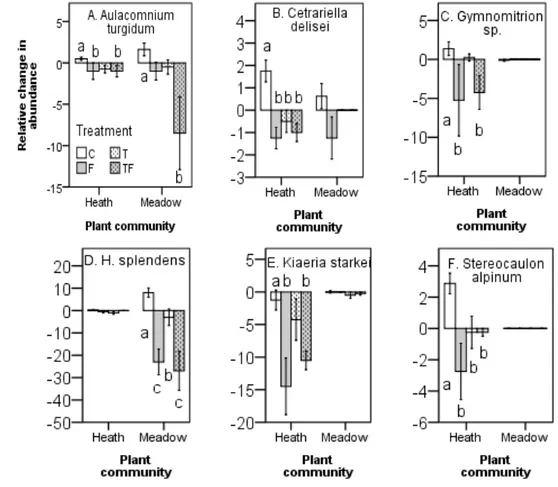
Out of sixteen most dominant species that had more 100 hits from the point framing and thus 175
included the statistical analyses, we found significant negative effects of treatments on seven 176
species; Aulacomnium turgidum (Wahlenb.) Schwägr. (acrocarpous bryophyte), Cetrariella 177
delisei (Bory ex Schaer.) Kärnfelt & A. Thell (lichen), Gymnomitrion sp. (liverwort), Kiaeria
178
starkei (F. Weber & D. Mohr) I. Hagen (acrocarpous bryophyte), Stereocaulon alpinum
179
Laurer (lichen), Hylocomium splendens (Hedw.) Schimp. (pleurocarpous bryophyte), 180
Cladonia arbuscula (Wallr.) Flot. (lichen). All significant treatment responses were negative
181
when found, regardless if in the rich meadow or the poor heath community, with nutrient 182
addition and the combined nutrient addition and warming having the largest negative effect 183
on relative change of abundance among years (Figures 2, 3, Table 4). In control plots, most 184
P
re
P
rin
ts
species tended to slightly increase in relative abundance between both 1995-2001 and 1999-185 2001. 186 187 Discussion 188
Previous studies have shown highly heterogenic response patterns for experimental nutrient 189
addition and warming. For example, a long-term study in Alaska and subarctic Sweden, 190
combined nutrient and warming was shown to have significant negative effect on lichens and 191
bryophytes, in the same study nutrient addition alone caused significant decrease in lichens 192
biomass but had no significant effect on bryophytes, while warming caused no significant 193
responses (Van Wijk et al. 2003). Experimental nutrient addition has been shown to have 194
positive effect on bryophytes (Jonasson 1992; Robinson et al. 1998), and lichens in open high 195
artic and alpine vegetation (Jonasson 1992), decrease of both bryophyte and lichens to nine 196
years if nutrient addition in a subarctic birch forest (Richardson et al. 2002). Likewise, 197
warming has been shown to cause arbitrary impact on bryophytes and lichens, with no 198
responses of bryophytes (Chapin et al. 1995; Van Wijk et al. 2003; Lang et al. 2009; 199
Jägerbrand et al. 2009; Alatalo et al. 2014a), negative effect on bryophytes (Press et al. 1998; 200
Lang et al. 2012; Sistla et al. 2013), no effect on lichens (Jägerbrand et al. 2009; Alatalo et al. 201
2014a), negative effect on lichens (Press et al. 1998; Lang et al. 2012; Sistla et al. 2013), and 202
positive effect on lichens (Chapin et al. 1995; Alatalo 1998; Biasi et al. 2008; Jägerbrand et 203
al. 2009). The contrasting response patterns have been hypothesized to be caused by
204
competitive interactions between cryptogams and vascular plants, and also to be attributed to 205
how well the cryptogams are adapted to light competition (Alatalo 1998). Bryophyte species 206
have been shown to have different responses to shading effects (Jägerbrand & During 2005). 207
In sites with existing dense canopies the bottom layer cryptogam communities are thought to 208
be dominated by shade-tolerant species while cryptogams in more open canopies are thought 209
P
re
P
rin
ts
to be dominated by shade-intolerant species, an increase in canopy closure due to warming 210
and/or increased nutrient levels is hypothesized to affect the shade-intolerant species most 211
(Alatalo 1998). Therefore, cryptogams in sites with more developed vascular plant canopies 212
are expected to be more resistant to global change with increased temperature and nutrient 213
levels. Experimental support for the hypothesis has been found in a cross continental study on 214
macro-lichens that included more southern parts of arctic where the vegetation canopy was 215
more dense compared to vegetation with more open canopy in high arctic or arctic alpine sites 216
(Cornelissen et al. 2001), and in a study in alpine subarctic Sweden on the effect of 217
neighboring vascular plants on bryophytes in contrasting plant communities (Jägerbrand et al. 218
2012). However, our results from the present study show that after seven years both the 219
nutrient and warming treatments had significant negative effect in both the rich meadow and 220
the poor heath community, thus not supporting the hypothesis. Bryophytes decreased the most 221
in the meadow and the lichens decreased most in the heath, which is in accordance with 222
previous findings (Jägerbrand et al. 2006). Nutrient addition and the combined nutrient 223
addition and warming caused a more rapid response compared to the more delayed response 224
of warming per se. Thus, it might be that long term warming will cause other shifts in the 225
environment such as an increased accumulated thickness of litter that may have a more 226
detrimental effect than live canopy. An increased production of litter could lead to that 227
cryptogams get “covered” while live canopy cover will still leave “space” for the cryptogams. 228
This could potentially be an artifact of using OTCs that may hinder litter to disperse outside 229
the OTCs. Optimally, new experiments would include litter removal as one of the factors 230
together with warming and nutrient addition in factorial set up. That long-term warming can 231
cause drastic shifts in cryptogam communities is evident after two decades of experimental 232
warming in Alaska which caused lichens to decrease by 99% and bryophytes by 63% (Sistla 233
et al. 2013). However, the time needed for the negative effects to be expressed may differ
234
P
re
P
rin
ts
among species and plant communities, as is shown in our study. After seven years of warming 235
seven out of sixteen species included in the statistical analyses in our study were negatively 236
affected. When we compare this to a previous study in the same sites on the impact of five 237
years of warming, there were no significant effects from warming on bryophyte and lichens at 238
the community level, in fact only one lichen species Cetraria nivalis, displayed a significant 239
negative response to warming in the heath (Jägerbrand et al. 2009). These results point out the 240
importance of longer-term studies to improve the quality of climate change models. Our 241
results indicate that short-term studies are poor predictors of longer-term responses of 242
bryophytes and lichens, similar as have been shown for vascular plants (Alatalo & Little 243
2014; Alatalo et al. 2014b). The results also show that species specific responses may differ 244
in time, and that this will likely cause changes in the dominance structures of bryophytes and 245
lichens over time. The potential role of litter for cryptogam development also need to be 246
studied in controlled experiments to determine if canopy development or litter accumulation 247
are the main driving forces behind the decrease of cryptogams found in longer-term global 248 change experiments. 249 250 References 251
Alatalo, J. (1998) Climate Change: Impacts on Structure and Biodiversity of Subarctic Plant 252
Communities. Göteborg University, Sweden.
253
Alatalo, J.M., Jägerbrand, A.K. & Molau, U. (2014a) Climate change and climatic events: 254
community-‐, functional-‐ and species-‐level responses of bryophytes and lichens to 255
constant, stepwise, and pulse experimental warming in an alpine tundra. Alpine 256
Botany, 124, 81–91.
257
Alatalo, J.M. & Little, C.J. (2014) Simulated global change: contrasting short and medium 258
term growth and reproductive responses of a common alpine/Arctic cushion plant 259
to experimental warming and nutrient enhancement. SpringerPlus, 3, 157. 260
Alatalo, J.M., Little, C.J., Jägerbrand, A.K. & Molau, U. (2014b) Dominance hierarchies, 261
diversity and species richness of vascular plants in an alpine meadow: contrasting 262
short and medium term responses to simulated global change. PeerJ, 2, e406. 263
Andrew, N.R., Hill, S.J., Binns, M., Bahar, M.H., Ridley, E.V., Jung, M.-‐P., Fyfe, C., Yates, M. & 264
Khusro, M. (2013) Assessing insect responses to climate change: What are we 265
testing for? Where should we be heading? PeerJ, 1, e11. 266
Biasi, C., Meyer, H., Rusalimova, O., Hämmerle, R., Kaiser, C., Baranyi, C., Daims, H., 267
P
re
P
rin
ts
Lashchinsky, N., Barsukov, P. & Richter, A. (2008) Initial effects of experimental 268
warming on carbon exchange rates, plant growth and microbial dynamics of a 269
lichen-‐rich dwarf shrub tundra in Siberia. Plant and Soil, 307, 191–205. 270
Bjerke, J., Bokhorst, S., Zielke, M., Callaghan, T., Bowles, F. & Phoenix, G. (2011) 271
Contrasting sensitivity to extreme winter warming events of dominant sub-‐Arctic 272
heathland bryophyte and lichen species. Journal of Ecology, 99, 1481–1488. 273
Callaghan, T.V., Tweedie, C.E., Åkerman, J., Andrews, C., Bergstedt, J., Butler, M.G., 274
Christensen, T.R., Cooley, D., Dahlberg, U., Danby, R.K., Daniёls, F.J.A., Molenaar, J.G. 275
de, Dick, J., Mortensen, C.E., Ebert-‐May, D., Emanuelsson, U., Eriksson, H., Hedenås, 276
H., Henry, G.H.R., Hik, D.S., Hobbie, J.E., Jantze, E.J., Jaspers, C., Johansson, C., 277
Johansson, M., Johnson, D.R., Johnstone, J.F., Jonasson, C., Kennedy, C., Kenney, A.J., 278
Keuper, F., Koh, S., Krebs, C.J., Lantuit, H., Lara, M.J., Lin, D., Lougheed, V.L., Madsen, 279
J., Matveyeva, N., McEwen, D.C., Myers-‐Smith, I.H., Narozhniy, Y.K., Olsson, H., 280
Pohjola, V.A., Price, L.W., Rigét, F., Rundqvist, S., Sandström, A., Tamstorf, M., 281
Bogaert, R.V., Villarreal, S., Webber, P.J. & Zemtsov, V.A. (2011) Multi-‐Decadal 282
Changes in Tundra Environments and Ecosystems: Synthesis of the International 283
Polar Year-‐Back to the Future Project (IPY-‐BTF). AMBIO, 40, 705–716. 284
Chalcraft, D.R., Cox, S.B., Clark, C., Cleland, E.E., Suding, K.N., Weiher, E. & Pennington, D. 285
(2008) Scale-‐dependent responses of plant biodiversity to nitrogen enrichment. 286
Ecology, 89, 2165–2171.
287
Chapin, F.I., Shaver, G., Giblin, A., Nadelhoffer, K. & Laundre, J. (1995) Responses of arctic 288
tundra to experimental and observed changes in climate. Ecology, 76, 694–711. 289
Clark, C.M., Morefield, P.E., Gilliam, F.S. & Pardo, L.H. (2013) Estimated losses of plant 290
biodiversity in the United States from historical N deposition (1985–2010). 291
Ecology, 94, 1441–1448.
292
Cornelissen, J.H.C., Callaghan, T.V., Alatalo, J.M., Michelsen, A., Graglia, E., Hartley, A.E., 293
Hik, D.S., Hobbie, S.E., Press, M.C., Robinson, C.H., Henry, G.H.R., Shaver, G.R., 294
Phoenix, G.K., Gwynn Jones, D., Jonasson, S., Chapin, F.S., Molau, U., Neill, C., Lee, J.A., 295
Melillo, J.M., Sveinbjornsson, B. & Aerts, R. (2001) Global change and arctic 296
ecosystems: is lichen decline a function of increases in vascular plant biomass? 297
Journal of Ecology, 89, 984–994.
298
Graglia, E., Jonasson, S., Michelsen, A., Schmidt, I.K., Havström, M. & Gustavsson, L. 299
(2001) Effects of environmental perturbations on abundance of subarctic plants 300
after three, seven and ten years of treatments. Ecography, 24, 5–12. 301
Grandy, A.S., Sinsabaugh, R.L., Neff, J.C., Stursova, M. & Zak, D.R. (2008) Nitrogen 302
deposition effects on soil organic matter chemistry are linked to variation in 303
enzymes, ecosystems and size fractions. Biogeochemistry, 91, 37–49. 304
Groom, Q.J. (2013) Some poleward movement of British native vascular plants is 305
occurring, but the fingerprint of climate change is not evident. PeerJ, 1, e77. 306
Harden, J., Manies, K., Turetsky, M. & Neff, J. (2006) Effects of wildfire and permafrost on 307
soil organic matter and soil climate in interior Alaska. Global Change Biology, 12, 308
2391–2403. 309
Hill, G.B. & Henry, G.H.R. (2011) Responses of High Arctic wet sedge tundra to climate 310
warming since 1980. Global Change Biology, 17, 276–287. 311
IPCC. (2013) Climate Change 2013: The Physical Science Basis. Contribution of Working 312
Group I to the Fifth Assessment Report of the Intergovernmental Panel on Climate
313
Change. Cambridge University Press, Cambridge.
314
Jägerbrand, A.K., Alatalo, J.M., Chrimes, D. & Molau, U. (2009) Plant community 315
responses to 5 years of simulated climate change in meadow and heath ecosystems 316
P
re
P
rin
ts
at a subarctic-‐alpine site. Oecologia, 161, 601–610. 317
Jägerbrand, A.K. & During, H.J. (2005) Effects of Simulated Shade on Growth, Number of 318
Branches and Biomass in Hylocomium splendens and Racomitrium lanuginosum. 319
Lindbergia, 30, 117–124.
320
Jägerbrand, A.K., Kudo, G., Alatalo, J.M. & Molau, U. (2012) Effects of neighboring 321
vascular plants on the abundance of bryophytes in different vegetation types. Polar 322
Science, 6, 200–208.
323
Jägerbrand, A.K., Lindblad, K.E.M., Björk, R.G., Alatalo, J.M. & Molau, U. (2006) Bryophyte 324
and Lichen Diversity Under Simulated Environmental Change Compared with 325
Observed Variation in Unmanipulated Alpine Tundra. Biodiversity and 326
Conservation, 15, 4453–4475.
327
Jägerbrand, A.K., Molau, U. & Alatalo, J.M. (2003) Responses of bryophytes to simulated 328
environmental change at Latnjajaure, northern Sweden. Journal of Bryology, 25, 329
163–168. 330
Jonasson, S. (1992) Plant Responses to Fertilization and Species Removal in Tundra 331
Related to Community Structure and Clonality. Oikos, 63, 420. 332
Klanderud, K. (2008) Species-‐specific responses of an alpine plant community under 333
simulated environmental change. Journal of Vegetation Science, 19, 363–372. 334
Lang, S.I., Cornelissen, J.H.C., Hölzer, A., ter Braak, C.J.F., Ahrens, M., Callaghan, T.V. & 335
Aerts, R. (2009) Determinants of cryptogam composition and diversity in 336
Sphagnum -‐dominated peatlands: the importance of temporal, spatial and 337
functional scales. Journal of Ecology, 97, 299–310. 338
Lang, S.I., Cornelissen, J.H.C., Shaver, G.R., Ahrens, M., Callaghan, T.V., Molau, U., Ter 339
Braak, C.J.F., Hölzer, A. & Aerts, R. (2012) Arctic warming on two continents has 340
consistent negative effects on lichen diversity and mixed effects on bryophyte 341
diversity. Global Change Biology, 18, 1096–1107. 342
Lewis, L.R., Behling, E., Gousse, H., Qian, E., Elphick, C.S., Lamarre, J.-‐F., Bêty, J., Liebezeit, 343
J., Rozzi, R. & Goffinet, B. (2014) First evidence of bryophyte diaspores in the 344
plumage of transequatorial migrant birds. PeerJ, 2, e424. 345
Lindblad, K.E.M., Nyberg, R. & Molau, U. (2006) Generalization of heterogeneous alpine 346
vegetation in air photo-‐based image classification, Latnjajaure catchment, northern 347
Sweden. Pirineos, 161, 74–79. 348
Li, X., Zhang, Z., Huang, L. & Wang, X. (2013) Review of the ecohydrological processes 349
and feedback mechanisms controlling sand-‐binding vegetation systems in sandy 350
desert regions of China. Chinese Science Bulletin, 58, 1483–1496. 351
Longton, R. (1984) The role of bryophytes in terrestrial ecosystems. J Hattori Bot Lab, 352
55, 147–163.
353
Mack, M.C., Schuur, E.A.G., Bret-‐Harte, M.S., Shaver, G.R. & Chapin, F.S. (2004) Ecosystem 354
carbon storage in arctic tundra reduced by long-‐term nutrient fertilization. Nature, 355
431, 440–443.
356
Marion, G., Henry, G.H.R., Freckrnan, D.W., Johnstone, I., Jones, G., Jones, M.H., Levesque, 357
E., Molau, U., Molgaard, P., Parsons, A.N., Svoboda, J. & Virgina, R.A. (1997) Open-‐ 358
top designs for manipulating field temperature in high-‐latitude ecosystems. Global 359
Change Biology, 3, 20–32.
360
Maskell, L.C., Smart, S.M., Bullock, J.M., Thompson, K. & Stevens, C.J. (2010) Nitrogen 361
deposition causes widespread loss of species richness in British habitats. Global 362
Change Biology, 16, 671–679.
363
May, J.L. & Hollister, R.D. (2012) Validation of a simplified point frame method to detect 364
change in tundra vegetation. Polar Biology, 35, 1815–1823. 365
P
re
P
rin
ts
Molau, U. & Alatalo, J.M. (1998) Responses of Subarctic-‐Alpine Plant Communities to 366
Simulated Environmental Change: Biodiversity of Bryophytes, Lichens, and 367
Vascular Plants. Ambio, 27, 322–329. 368
Olsen, S.L. & Klanderud, K. (2014) Exclusion of herbivores slows down recovery after 369
experimental warming and nutrient addition in an alpine plant community. Journal 370
of Ecology.
371
Pauli, H., Gottfried, Dullinger, S., Abdaladze, O., Akhalkatsi, M., Alonso, J.L.B., Coldea, G., 372
Dick, J., Erschbamer, B., Calzado, R.F., Ghosn, D., Holten, J.I., Kanka, R., Kazakis, G., 373
Kollár, J., Larsson, P., Moiseev, P., Moiseev, D., Molau, U., Mesa, J.M., Nagy, L., Pelino, 374
G., Puşcaş, M., Rossi, G., Stanisci, A., Syverhuset, A.O., Theurillat, J.-‐P., Tomaselli, M., 375
Unterluggauer, P., Villar, L., Vittoz, P. & Grabherr, G. (2012) Recent Plant Diversity 376
Changes on Europe’s Mountain Summits. Science, 336, 353–355. 377
Polunin, N. (1951) The real arctic: suggestions for its delimitation, subdivision, and 378
characterization. Journal of Ecology, 39, 308–315. 379
Post, E., Forchhammer, M.C., Bret-‐Harte, M.S., Callaghan, T.V., Christensen, T.R., Elberling, 380
B., Fox, A.D., Gilg, O., Hik, D.S., Høye, T.T., Ims, R.A., Jeppesen, E., Klein, D.R., Madsen, 381
J., McGuire, A.D., Rysgaard, S., Schindler, D.E., Stirling, I., Tamstorf, M.P., Tyler, N.J.C., 382
Wal, R. van der, Welker, J., Wookey, P.A., Schmidt, N.M. & Aastrup, P. (2009) 383
Ecological Dynamics Across the Arctic Associated with Recent Climate Change. 384
Science, 325, 1355–1358.
385
Potter, J., Press, M., Callaghan, T. & Lee, J. (1995) Growth responses of Polytrichum 386
commune and Hylocomium splendens to simulated environmental change in the 387
sub-‐arctic. New Phytologist, 131, 533–541. 388
Press, M., Potter, J., Burke, M., Callaghan, T. & Lee, J. (1998) Responses of a subarctic 389
dwarf shrub heath community to simulated environmental change. Journal of 390
Ecology, 86, 315–327.
391
Richardson, S.J., Press, M.C., Parsons, A.N. & Hartley, S.E. (2002) How do nutrients and 392
warming impact on plant communities and their insect herbivores? A 9-‐year study 393
from a sub-‐Arctic heath. Journal of Ecology, 90, 544–556. 394
Robinson, C., Wookey, P., Lee, J., Callaghan, T.V. & Press, M. (1998) Plant community 395
responses to simulated environmental change at a high arctic polar semi-‐desert. 396
Ecology, 79, 856–866.
397
Romanovsky, V., Drozdov, D., Oberman, N., Malkova, G., Kholodov, A., Marchenko, S., 398
Moskalenko, N., Sergeev, D., Ukraintseva, N., Abramov, A., Gilichinsky, D. & Vasiliev, 399
A. (2010) Thermal state of permafrost in Russia. Permafrost and Periglacial 400
Processes, 21, 136–155.
401
Shen, Z. & Ma, K. (2014) Effects of climate change on biodiversity. Chinese Science 402
Bulletin, 59, 4637–4638.
403
Sistla, S.A., Moore, J.C., Simpson, R.T., Gough, L., Shaver, G.R. & Schimel, J.P. (2013) Long-‐ 404
term warming restructures Arctic tundra without changing net soil carbon storage. 405
Nature, 497, 615–618.
406
Soudzilovskaia, N., Graae, B., Douma, J., Grau, O., Milbau, A., Shevtsova, A., Wolters, L. & 407
Cornelissen, J. (2011) How do bryophytes govern generative recruitment of 408
vascular plants? New Phytologist, 190, 1019–1031. 409
Stöckli, V., Wipf, S., Nilsson, C. & Rixen, C. (2011) Using historical plant surveys to track 410
biodiversity on mountain summits. Plant Ecology & Diversity, 4, 415–425. 411
Turetsky, M. (2003) The role of bryophytes in carbon and nitrogen cycling. The 412
Bryologist, 106, 395–409.
413
Turetsky, M.R., Bond-‐Lamberty, B., Euskirchen, E., Talbot, J., Frolking, S., McGuire, A.D. & 414
P
re
P
rin
ts
Tuittila, E.-‐S. (2012) The resilience and functional role of moss in boreal and arctic 415
ecosystems. The New phytologist, 196, 49–67. 416
Walker, M.D. (1996) Community baseline measurements for ITEX studies. ITEX Manual 417
(2nd ed.) (eds U. Molau & P. Miolgaard), pp. 39–41. Danish Polar Centre,
418
Copenhagen, Denmark. 419
Van Wijk, M.T., Clemmensen, K.E., Shaver, G.R., Williams, M., Callaghan, T.V., Chapin, 420
F.S.I., Cornelissen, J.H.C., Gough, L., Hobbie, S.E., Jonasson, S., Lee, J.A., Michelsen, A., 421
Press, M.C., Richardson, S.J. & Rueth, H. (2003) Long-‐term ecosystem level 422
experiments at Toolik Lake, Alaska, and at Abisko, Northern Sweden: 423
generalizations and differences in ecosystem and plant type responses to global 424
change. Global Change Biology, 10, 105–123. 425
Wu, X., Lin, X., Zhang, Y., Gao, J., Guo, L. & Li, J. (2014) Impacts of climate change on 426
ecosystem in Priority Areas of Biodiversity Conservation in China. Chinese Science 427
Bulletin, 59, 4668–4680.
428
Zhang, Y. (2005) The microstructure and formation of biological soil crusts in their early 429
developmental stage. Chinese Science Bulletin, 50, 117–121. 430
Zhang, Y., Wang, Y., Zhang, M. & Ma, K. (2014) Climate change threats to protected plants 431
of China: an evaluation based on species distribution modeling. Chinese Science 432 Bulletin, 59, 4652–4659. 433 434 435
P
re
P
rin
ts
Figure 1. Relative changes in total abundances (mean ± 1 SE) of bryophytes and lichens to
436
experimental manipulations in a poor heath and rich meadow, at Latnjajaure, subarctic 437
Sweden. A) Change in relative total abundance of bryophytes between 1995-2001, B) change 438
in relative total abundance of bryophytes between 1999-2001, C) change in relative total 439
abundance of lichens between 1995-2001, D) change in relative total abundance of lichens 440
between 1999-2001. Treatments: C = control, T = temperature treatment, F = fertilizer 441
treatment, TF = temperature and fertilizer treatments. N = 4 for T, F and TF, N = 8 for C. 442 443 444 445
P
re
P
rin
ts
Figure 2. Relative changes in species specific abundances (mean ± 1 SE) for bryophytes and 446
lichens between 1995-2001 to experimental manipulations in a poor heath and rich meadow, 447
at Latnjajaure, subarctic Sweden. Treatments: C=control, T=temperature treatment, 448
F=fertilizer treatment, TF = temperature and fertilizer treatments. Different letters indicate 449
significant differences analyzed by Mann-Whitney U-test. N = 4 for T, F and TF, N = 8 for C. 450 451 452 453 454 455
P
re
P
rin
ts
Figure 3. Relative changes in species specific abundances (mean ± 1 SE) for bryophytes and 456
lichens between 1999-2001 to experimental manipulations in a poor heath and rich meadow, 457
at Latnjajaure, subarctic Sweden. Treatments: C = control, T = temperature treatment, F = 458
fertilizer treatment, TF = temperature and fertilizer treatments. Different letters indicate 459
significant differences analyzed by Mann-Whitney U-test. N = 4 for T, F and TF, N = 8 for C. 460 461 462 463 464
P
re
P
rin
ts
Table 1. The most dominant species of bryophytes and lichens at two the different plant
465
communities (heath and meadow) at Latnjajaure, Northern Sweden. 466
Species Group
Aulacomnium turgidum (Wahlenb.) Schwägr. Bryophyte
Cetrariella delisei (Bory ex Schaer.) Kärnfelt & A.
Thell Lichen
Cladonia arbuscula (Wallr.) Flot. Lichen
Cladonia furcata (Huds.) Schrad. Lichen
Cladonia uncialis (L.) F. H. Wigg. Lichen
Dicranum groenlandicum Brid. Bryophyte
Flavocetraria cucullata (Bellardi) Kärnefelt & A.
Thell Lichen
Flavocetraria nivalis (L.) Kärnefelt & A. Thell Lichen
Gymnomitrion sp. Bryophyte
Hylocomium splendens (Hedw.) Schimp. Bryophyte
Kiaeria starkei (F. Weber & D. Mohr) I. Hagen Bryophyte
Ochrolechia frigida (Sw.) Lynge Lichen
Polytrichum juniperinum Hedw. Bryophyte
Ptilidium ciliare (L.) Hampe Bryophyte
Sphaerophorus globosus (Huds.) Vain. Lichen
Stereocaulon alpinum Laurer Lichen
467 468
P
re
P
rin
ts
Table 2. Test of model effects of the generalized linear model (GLM) on responses in relative
469
abundance of bryophytes and lichens between 1995 - 2001, and between 1999 - 2001, to 470
experimental manipulations at two different plant communities at Latnjajaure, Northern 471
Sweden. Only the most dominant species were included, see Table 1. 472 Source Wald chi-squar e df P Bryophytes 1995-2001 Intercept 131.7 1 <0.0001 Plant community 21 1 <0.0001 Treatments 181 3 <0.0001 Plant community * Treatments 32 3 <0.0001 Bryophytes 1999-2001 Intercept 3.9 1 0.048 Plant community 0.5 1 0.5 Treatments 31.1 3 <0.0001 Plant community * Treatments 5.2 3 0.16 Lichens 1995-2001 Intercept 88.9 1 <0.0001 Plant community 14.8 1 <0.0001 Treatments 33 3 <0.0001 Plant community * Treatments 9.7 3 0.02 Lichens 1999-2001 Intercept 138.4 1 <0.0001 Plant community 50.7 1 <0.0001 Treatments 3.9 3 0.28 Plant community * Treatments 1.2 3 0.75 473 474
P
re
P
rin
ts
475
Table 3. Results of generalized linear model (GLM) explaining the responses in relative
476
abundance of bryophytes and lichens between 1995 - 2001, and between 1999 - 2001, to 477
experimental manipulations at two different plant communities at Latnjajaure, Northern 478
Sweden. Only significant variables are shown. Coefficient (B), SE = standard error and P, 479 significance levels. 480 481 482 483 484 485 Variable Coefficient SE P Bryophytes 1995-2001 Intercept -41.5 3.5 <0.0001 Heath 20.5 4.9 <0.0001 Control 51.0 4.3 <0.0001 Temperature 31.3 4.9 <0.0001 Heath * Control -26.9 6.1 <0.0001 Heath * Temperature -14.8 7.0 0.035 Bryophytes 1999-2001 Control 7.3 2.7 0.006 Heath * Temperature 8.5 4.3 0.05 Lichens 1995-2001 Intercept -10.5 3.4 0.002 Heath -15.5 4.7 0.001 Heath * Control 16.1 5.8 0.005 Lichens 1999-2001 Heath -11.8 3.9 0.003
P
re
P
rin
ts
Tab le 4 . M ann -W hi tne y U -te sts f or s pe cie s s pe cif ic a bunda nc es of bryophyt es a nd l ic he ns be tw ee n t re atm ent s, a m ong ye ars in t he he ath a nd m ea dow c om m uni tie s. S igni fic anc e va lue s ( P < 0.05) i n bol d. C = Cont rol pl ot s; T = w arm ing (O T C); T F = c om bi ne d w arm ing a nd nut ri ent addi tion. S pe cie s: A t = A ul ac om ni um tur gi dum (W ahl enb.) S chw ägr. (a croc arpous bryophyt e), Ce td = Ce trar ie lla de lis ei (Bory e x S cha er.) K ärnf elt & A . T he ll (l ic he n), G ym = G ym nom itr ion s p. (l ive rw ort ), K ia s = Ki ae ria s tar ke i (F . W ebe r & D . M ohr) I. H age n (a croc arpous bryophyt e), S te a = St er eoc aul on al pi num L aure r (l ic he n), H S = H yloc om ium s pl ende ns (H edw .) S chi m p. (pl euroc arpous bryophyt e), Cl dof = Cl adoni a ar bus cul a (W all r.) F lot . (l ic he n). S pe cie s a bbre vi ati ons w ith a num be r 2 a tta che d (e xa m pl e A t2) m ea ns tha t t he M ann -W hi tne y U -test w ere pe rf orm ed f or di ffe re nc es be tw ee n 1999 a nd 2001, s pe cie s a bbre vi ati ons w ithout a num be r m ea ns tha t t he M ann -W hi tne y U -te st w as pe rf orm ed on di ffe re nc e be tw ee n 1995 -2001 HEATH At Ce td G ym Kias Stea At2 Stea2 C T 0,048 0,011 0,48 0,49 0,03 0,035 0,158 C F 0,11 0,007 0,029 0,033 0,006 0,18 0,008 C TF 0,048 0,007 0,024 0,008 0,006 0,176 0,257 T F 0,74 0,27 0,1 0,083 0,24 0,127 0,017 T TF 0,88 0,35 0,076 0,19 0,74 0,127 0,169 F TF 0,74 0,65 0,88 0,25 0,12 1 0,017 MEADOW At Hs Cl dof 2 C T 0,172 0,013 1 C F 0,093 0,006 0,014 C TF 0,005 0,006 0,29 T F 0,66 0,043 0,04 T TF 0,08 0,043 0,32 F TF 0,14 0,56 0,011