Traffic Violations and Insurance Data
- a note on the role of age, gender, annual mileage and vehicle brand
Sara Arvidsson – Swedish National Road and Transport Research Institute (vti)CTS Working Paper 2011:3
Abstract
Risky driving behavior is regarded as being one of the best predictors of traffic accidents. Traffic violations certainly signal risky driving behavior, but the analysis of the linkage of traffic violations, individual and vehicle characteristics and annual mileage has so far been hampered by the difficulty of gaining access to appropriate disaggregate data. The contribution of this paper is that it sets out and explores a rich data set in order to study traffic violations, including both accident-involved and accident-free individuals. The data set comprises all insurance policies from Sweden’s largest automobile insurance company covering several years, in total 9.3 million observations, as well as information on fines and convictions for traffic violations. This implies that the methodological issues associated with self-reported violations and only accident-involved individuals are disused. The first purpose is to establish the role of age and gender in traffic violations. The second purpose is to make a first attempt to establish whether vehicle owners of status brands are more likely to commit traffic violations. The results support previous findings as well as confirm the association between owners of status brands and traffic violations. The main conclusion is that insurance data provides a viable option when studying behavior, but it also raises new methodological issues.
Keywords: Insurance, asymmetric information, accidents, traffic violations, automobile brand
JEL Codes: D82
*Swedish National Road and Transport Research Institute (VTI) Box 920, 781 29 Borlänge.
sara.arvidsson@vti.se
**Centre for Transport Studies, Royal Institute of Technology Teknikringen 78 B, 100 44 Stockholm.
Acknowledgements: I wish to thank Länsförsäkringar AB for the insurance data, the Swedish National Police Board (RPS) and National Council of Crime Prevention (BRÅ) for data on
Traffic Violations and Insurance Data
– a note on the role of age, gender, annual mileage and
vehicle brand
Sara Arvidsson VTI*/CTS**
Abstract: Risky driving behavior is regarded as being one of the best
predictors of traffic accidents. Traffic violations certainly signal risky driving behavior, but the analysis of the linkage of traffic violations, individual and vehicle characteristics and annual mileage has so far been hampered by the difficulty of gaining access to appropriate disaggregate data. The contribution of this paper is that it sets out and explores a rich data set in order to study traffic violations, including both accident-involved and accident-free individuals. The data set comprises all insurance policies from Sweden’s largest automobile insurance company covering several years, in total 9.3 million observations, as well as information on fines and convictions for traffic violations. This implies that the methodo-logical issues associated with self-reported violations and only accident-involved individuals are disused. The first purpose is to establish the role of age and gender in traffic violations. The second purpose is to make a first attempt to establish whether vehicle owners of status brands are more likely to commit traffic violations. The results support previous findings as well as confirm the association between owners of status brands and traffic violations. The main conclusion is that insurance data provides a viable option when studying behavior, but it also raises new methodological is-sues.
Introduction
Traffic accidents are among the largest health care problems worldwide causing the deaths of approximately 1.2 million people annually (Peden et al.; 2004). Predictions show that by 2020 road traffic injuries will have become the third leading contributor to the global burden of disease and injury (Wallén-Warner and Sandin; 2010). Risky behavior, such as violations of driving regulations, is one of the best predictors of accident risk (Parker et al.; 1995, Forward; 2006, 2008).Traffic violations also in-crease the probability of the vehicle owner reporting an at-fault accident to the insurance company (Arvidsson; 2010). It is therefore policy relevant to establish the characteristics that are associated with risky driving behavior.
There is a huge literature addressing this issue, much of it using survey data on self-reported accidents and traffic violations or data on individuals involved in accidents; moreover, the data analysis is often based on small samples. The drawback of only using accident-involved individuals is that it obstructs inference since we lack information on traffic violations of the population at large, that is, accident-free individuals. The disadvantage of self-reported violations and accidents is that individuals – consciously or unconsciously – under-report accident history and traffic violations.
The contribution of this study is that we set out and explore richer data than used by previous literature. The data consists of approximately 9.3 million observations of insurance policies containing characteristics of the vehicle owner and the vehicle, as well as annual mileage. In addition to insurance data we have added register data on traffic violations of individuals who reported an accident and individuals that did not. Due to restricted availability of these kinds of data our dataset provides, to the best of our knowledge, a unique opportunity to study traffic violations.
The first purpose of this paper is to study the relation between traffic violations, age and gender. More observations and access to a comprehensive set of insurance buyers will give us the opportunity to establish the relationship between age, gender and traffic violations. A second purpose is to include more explanatory variables such as characteristics of the vehicle (brand and age) and annual mileage. The intention is to establish a first step towards a common understanding of the fact that certain vehicle brands are associated with risk-taking behavior. We test the hypothesis that owners of status brands are more likely to commit traffic violations compared to owners of family-related brands. We define three vehicle brands as being more family orientated (Volvo, Saab and Volkswagen) and three as being associated with higher status (BMW, Porsche and Lamborghini).
We divide the analysis in to two steps since there tend to be methodologi-cal issues with the use of explanatory variables that are not exogenously given in the model (Angrist and Pischke; 2010). While age and gender are exogenously given in our model, vehicle characteristics and annual mileage are more or less endogenous; the choice of vehicle and how much you drive may increase the probability of receiving an on-the-spot-fine or conviction for a violation. The police may further be biased and stop certain vehicles that are often associated with traffic violations, such as fast sport vehicles or vehicles driven by young individuals. In the latter case age and gender may be endogenous as well. How to resolve these methodological issues is beyond the scope of this paper and we settle for separating the analysis into two steps. We believe that the nature of this data makes it possible to learn more about what increases the probability of a traffic violation and that it provide a good source for future research. We emphasize the fact that the use of insurer data also raises new methodological issues. All in all,
this study provides a first methodological step to study violations with a data source other than previously used.
Our results from the first part of the analysis are consistent with previous findings in that males are more likely to commit traffic violations com-pared to females. For both genders the probability of having convictions increases up to middle-age, while older vehicle owners are less likely to have convictions. Speeding follows a similar pattern; the probability of getting a speeding ticket increases with age until the 30s, while older vehi-cle owners are less likely to get speeding tickets. The probability of fines for traffic offences other than speeding decreases with age, suggesting that younger drivers are more inclined to take risks. Since fines for other traffic offences can be vehicle-related, another explanation is that younger indi-viduals, due to some budget restrictions, own older vehicles, which are more likely to have flaws than newer vehicles. If young individuals are more likely to own “bad quality” vehicles, they are also more likely to be fined for vehicle flaws.
The second part of the analysis suggests that owners of status vehicles are more likely to be fined, especially for speeding, while owners of family orientated cars are less likely to be fined. The results regarding convictions for traffic safety violations are more ambiguous. Only BMW-owners are more likely to get at least one conviction. The difference between fines and convictions may thus be explained by the fact that they represent different social and financial costs.
Our findings also suggest that the probability of getting speeding tickets increases if annual mileage increases, while traffic violations and convic-tions are more likely for individuals with lower annual mileage. This im-plies that the majority of drivers with fines and convictions for traffic
vio-lations drive in the lower kilometer classes. Owners of older vehicles are more likely to be fined and convicted for traffic offences, but less likely get speeding tickets. Violations further increase the probability of reporting an at-fault claim, which is consistent with previous findings.
Our main conclusion is that insurance data is a viable source for analyzing accident risk, the primary reason being that it consists of many observa-tions and contains detailed information. Besides, it enables us to combine accident analysis with economic predictions, since it contains information on payments (premium) and loss indemnity (costs), which provide us with the possibility of making economic inferences for future research.
The paper is organized in the following way. Section 2 provides an over-view of related accident literature. Section 3 describes the empirical frame-work including predictions, econometric approach, data and descriptive statistics. Section 4 presents the results, while section 5 concludes the pa-per.
2. Related Literature
Several studies emphasize the importance of driving behavior for accidents; Rumar (1985), using British and American crash reports, indicates that 57 percent of crashes were due to driver factors, 27 percent to combined roadway and driver factors and 6 percent to combined vehicle and driver factors. The remaining 11 percent were due to other combinations of these factors. Furthermore, Lum and Reagan (1995) report that British and American crash data reveals that 93 percent of the road crashes may be attributed to driver errors, drunk driving and other human factors. Age generally correlates negatively with aggressive driving. Relative to older drivers, younger drivers have higher violation rates and underestimate the
risk of various violations (Groeger and Brown; 1989). Besides, they also have a lower motivation to comply with traffic laws (Yagil; 1998). This implies that driving characteristics are an important accident predictor.
Risky behavior, such as violations of existing driving regulations, is one of the best predictors of accident risk (Boyer et al.; 1991 and Stradling et al.; 2000). Individuals with violations are also more likely to report an accident at fault to the insurance company (Arvidsson; 2010). Erlier, Ross (1960) discussed this topic and argued that traffic law violations were a folk crime. Among violations, speeding is well established in the traffic safety literature (Aarts and van Schagen; 2006, Nilsson; 2004). Speeding is associated with higher accident risk and often pointed out as the most frequent violation (Nallet et al; 2010). This implies that the perceived risk of speeding tends to be low: even though the risk is evident at an aggregate level, individuals rarely experience the consequences of speeding. Rather, the perceived time gain is larger than the risk increase from speeding. Traffic-psychologists also stress the importance of social norms when engaging in risky behavior such as speeding. In Sweden, as in several other countries, speeding is more acceptable compared to, for instance, drunken driving (See Forward; 2008 and Åberg; 1993 for a review).
Previous research has furthermore established demographic differences in risk and why drivers commit violations. In general, women and older drivers tend to commit violations less frequently compared to men and young drivers. On the other hand women and older drivers seem to make more errors compared to men and young drivers (Åberg and Rimmö; 1998, Bener et al; 2008). According to psychologists these behavioral differences are due to that men being more inclined to be sensation seekers and undertake unsafe driving actions, such as speeding and driving while intoxicated (Jonah; 1997). Moreover, violations are often attributed to
psychological factors such as overestimation of skills (Weinstein; 1999, Walton; 1999). One reason may be that drivers rate themselves to be better than the average driver (McKenna et al.; 1991). One example is that 90 percent of the automobile drivers in Sweden consider themselves as above average (Svenson; 1981). Numerous studies on road safety have found that people think their driving abilities are better, or that their vulnerability to road accidents is lower than for other drivers. This lowers the likelihood of adopting safe behavior and undermines the efficiency of educational efforts (Delhomme et al.; 2009).
Annual mileage is another important accident predictor (Peck and Kuan; 1983, Massie et al.; 1997) related to traffic violations. Being regarded as a high risk increases with annual mileage (exposure), which implies that it is important to control for annual mileage when studying differences in gender, for instance. The reason is that males generally drive more than females. Previous literature has shown that, when considering risk per mile driven, high-mileage drivers have a lower accident risk per mile, compared to low-mileage drivers (Maycock; 1985; Janke; 1991). Driven distance, however, calls for a remark since distance traveled can have an ambiguous effect on accident risk; increasing distance traveled per year increases exposure, which increases the accident probability, but also increases driving experience, which reduces the accident risk.
Benfield et al (2006) use several measures for driver and vehicle and the results suggest that these driver and vehicle measures are correlated with several indexes of aggressive driving tendencies. In some cases the vehicle measures used predicted aggressive driving better than the driver personality measures, suggesting that vehicle attributes may generate a selection of individuals with risk-taking behavior, which possibly implies that certain vehicles are associated with risky behavior.
3. The empirical framework
As mentioned in the introduction, there are methodological issues associ-ated with endogenous variables that obstruct inference of the causal effect. We therefore divide the analysis into two separate steps. In the first part we establish the role of age and gender in traffic violations. In the second part we include more explanatory variables to study the interrelationship of traffic violations, annual mileage and vehicle characteristics. Compared to age and gender, which are exogenous to the model, the variables in the second step are more or less endogenous since they are dependent on the individuals’ choices. Nonetheless, age and gender may be discriminating factors when stopped by the police. This implies that young individuals and males in particular may be stopped and fined more often compared to other groups. If this is the case, age and gender will tend to be endogenous as well.
We separate fines and convictions, since we expect that there may be dif-ferences in observed violations. The reason is that fines and convictions represent different degrees of sanctions, different levels of social acceptabil-ity and different costs. The financial loss associated with a speeding ticket is lower and the social acceptability is higher, compared to a conviction that may be associated with heavy fines or prison and lower acceptance levels.
3.1 Econometrical approach
A. Part I: establishing the effect of age and gender
We start the analysis by testing the relation between traffic violations and the age and gender of the vehicle owner. We expect that young individualsare riskier and that women are less likely to commit violations compared to males.
Prob(Speeding ticket(s)=1)= Φ (1gender+2age+3(age)2+4age·gender)=Φ(.)1 (1)
Prob(Traffic offence(s)=1)=Φ(1gender+2age+3(age)2+4age·gender)= Φ(.)2 (2)
Prob(Convictions(s)=1)=Φ(1gender+2age+3(age)2+4age·gender)= Φ(.)3 (3)
The dependent variable of equations (1) – (3) takes the value one if the individual has at least one-on-the-spot fine for traffic offences, at least one on-the-spot-fine for speeding and at least one conviction for traffic safety violations respectively. If not the dependent variable is zero. Explanatory variables are the age and gender of the vehicle owner. We furthermore include age squared and an interaction term between age and gender. The results are presented in Table 4 below.
B. Part II: Including endogenous variables
In the second step we provide a first step to empirically investigate the statement that high risk individuals are associated with status cars and that the more family orientated cars are less likely to be associated with high risk. According to Statistics Sweden, more luxurious cars such as Jeep, Mercedes and Porsche tend to have disproportionately many parking tickets. A possible explanation is that it is relatively less costly for owners of expensive vehicles to pay a parking fine than to search for a parking lot. Furthermore, more family orientated vehicles, such as some Toyota models, are not among the top fined vehicles, even though they are expensive. This possibly suggests that the vehicle may represent more than just a means of transport. That is, the choice of vehicle reflects the owners
self-image in terms of own status concerns, as well as status concerns of others.
We use Volvo, Saab and Volkswagen as proxies for family orientated vehi-cles, as these are among the ten most common vehicles in Sweden (Statis-tics Sweden, 2008). We moreover define BMW, Porsche and Lamborghini to be vehicle brands associated with higher status. We do not distinguish between vehicle models, cc and capacity, which implies that our definition of status and family cars is a rather broad generalization.1
Prob(Speeding ticket(s)=1)= Φ(1X+ 2B) (4)
Prob(Traffic offence(s)=1)= Φ(1X+ 2B) (5)
Prob(Conviction(s)=1)= Φ(1X+ 2B) (6)
The vector X includes age and gender of the vehicle owner, vehicle age and annual mileage. The vector B consists of dummy variables that take the value one if the individual owns a Volvo, Saab, Volkswagen, BMW, Por-sche or Lamborghini. The brand indicator variable takes the value zero for all other brands in the data. The results are shown in Tables 6-9 below.
3.2 Data
Each observation includes the insurers’ information about the individual, vehicle and contract characteristics.2 The data set comes from an
automo-bile insurance provider with 24 regional subsidiaries located in all Swedish counties. Data covers three years (2006-2008) and is not censored, which
1 Considering different vehicle and year models would likely provide small, or even
empty data cells.
2 Appendix A provides a detailed list of the information included in each
implies that we observe contracts that expire in 2006 at least from their starting date.
Data on on-the-spot fines comes from the RIOB register of the Swedish National Police Board (RPS). Fines are divided into speeding and other traffic offences such as running red lights, overtaking at crossings, and other offences due to risky behavior or vehicle flaws. Data on the number of convictions for traffic safety violations is registered by the Swedish Na-tional Council for Crime Prevention (BRÅ). Convictions are sanctions car-ried out by an attorney, and example including convictions for driving while intoxicated or driving carelessly.
Data in respect of on-the-spot fines and convictions has been merged with the insurance and claim files by BRÅ and we have also merged the insur-ance file, the risk classification file and claim files and cleaned the data.
3.3 Pros and cons of using insurance data
All in all, the majority of previous studies are based on survey data of self reported violations, crash data, or before and after studies of road crashes associated with change in speed limits, for instance. The number of obser-vations range from hundreds to, in some cases, hundreds of thousands. Despite the number of observations the robustness of the estimates may be insufficient, the reason being that accident data does not include accident-free drivers and that survey data suffers from measurement problems. A convenient option is therefore insurance data that contains driver and vehi-cle characteristics, annual mileage and driver behavior of both accident-involved and accident-free individuals. Another benefit is that it also comes in large data sets. Obviously all traffic violations do not result in fines or
convictions, but the data is likely to capture repeat offenders since the probability of being observed and fined, or convicted, increases with frequencies of violations. Since the data is obtained from insurance policies, uninsured drivers are not included. The number of uninsured vehicle owners in Sweden is low: approximately one percent of vehicle owners are uninsured, according to the Swedish motor insurers.
In addition the current data contains information about the vehicle owner’s habitual driving style (traffic violations). Due to the nature of the data we do not have the problems associated with self reports, or a selection of accident-involved drivers only, since individuals themselves reveal their type. In total there are 565 836 females and 930 573 males in the data, which sum up to about 1.5 million individuals (policyholders or vehicle owners). Furthermore, there are approximately 2.4 million contract-ids and when including a contract-id with a new time period, which is a re-peated contract, we have approximately 9.3 million observations of poli-cyholders and their contracts.
The complexity of insurance data calls for a remark. First of all it consists of four dimensions; individual-id, contract-id, vehicle-id and time period. This implies that it is problematic to treat data as a panel for two reasons: first an individual may own several vehicles (vehicle-id), and several vehi-cles owned by the same individual can have the same or different contract-ids. Generally all vehicles should have their own contract id, even if they are owned by the same individual. This implies that it is problematic to create a panel-id that is consistent. Second, even if a unique panel-id was to be created in a consistent matter, it would most likely appear more than once during the same time period, which generally is not allowed within a panel. Duplicate observations may result if two or more accidents occur
during the same time period, but these should not be interpreted as dupli-cate observations since they are separate accidents.
The number of observations of an individual further depends on how many periods the individual has been a client of the insurer, how many vehicles he or she owns and how many changes are made to the contract. Exam-ples of contract changes include; changing deductible, moving, registering or de-registering the vehicle. This is equivalent to a change in risk that requires an updated contract. For every change that is made the contract receive a new time period (a repeated contract) and appears as a new ob-servation. Hence, if an individual owns several vehicles and makes several changes in the contracts, he or she will appear in as many observations, see Table 1.
Finding an econometric approach best first the data is beyond the scope of this paper. We do, however, consider the dependency between observations of the same individuals by using a probit model with cluster robust stan-dard errors with respect to individual-id. This implies that we allow for dependency between observations of the same individual, while observa-tions between different individuals are treated as independent. In this way we also allow for dependency between contracts that are owned by the same individual.
Table 1. Number of observations per individual over 18 years old.
Number of observations per individual
Females Males
Percent Frequency Percent Frequency
1 17.64 565 704 15.33 930 151 5 10.9 349 473 9.95 603 766 10 1.84 59 102 2.75 167 065 15- 1.23 51 626 4.93 299 085 Number of observations: 3 206 627 (34.58%) 6 066 651 (65.43%) Total number of observations: 9 273 278
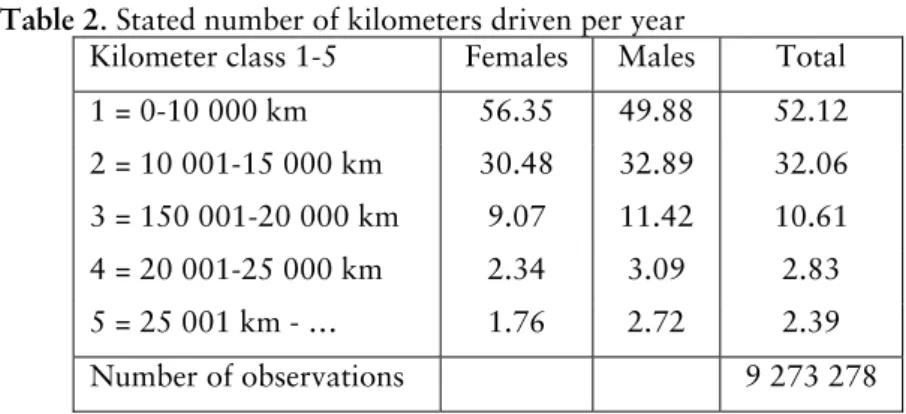
Table 2 provides descriptive statistics of self-reported number of kilometers driven per year. There are reasons to believe that some policyholders' un-der-report the actual number of kilometer driven per year since this lowers the premium. We note this as a potential caveat with these data. Number of kilometers is divided into five risk classes, where 1 is the lowest and 5 the highest exposure. The table illustrates that the majority of contracts are in the two lowest distance classes. A higher share of females report that they drive in the lowest kilometer class, while a higher share of males re-port that they drive in the higher kilometer classes.
Table 2. Stated number of kilometers driven per year
Kilometer class 1-5 Females Males Total 1 = 0-10 000 km 56.35 49.88 52.12 2 = 10 001-15 000 km 30.48 32.89 32.06 3 = 150 001-20 000 km 9.07 11.42 10.61 4 = 20 001-25 000 km 2.34 3.09 2.83 5 = 25 001 km - … 1.76 2.72 2.39 Number of observations 9 273 278
Notes: 1 mile= 1.6 kilometer.
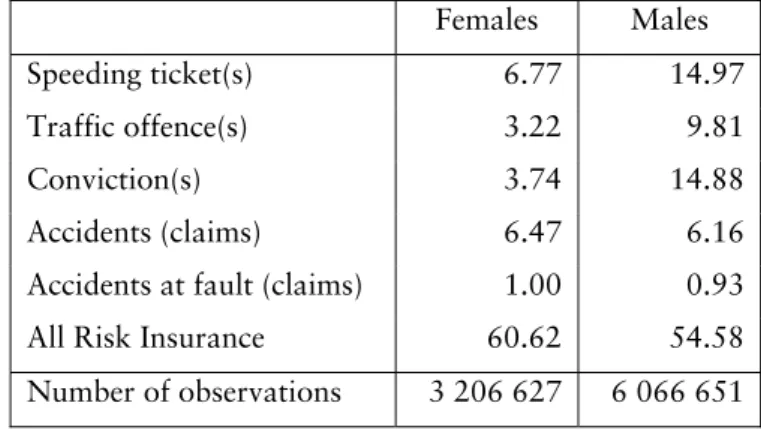
Table 3 illustrates that females have a lower share of fines and convictions compared to males. According to previous findings a higher share of males is involved in fatal accidents compared to women, while woman have higher rates of involvement in injury and police reported crashes (Massie et al.). Table 3 also shows that women have a higher share of claims com-pared to males, which is consistent with previous findings since smaller accidents are more common than fatal accidents. It should be noted, how-ever, that a higher share of females have All Risk Insurance (full coverage) compared to males. The reason is that higher coverage is likely to increase the incentives to report a claim.
Table 3. On the spot fines, convictions, accidents and coverage for females
and males respectively.
Females Males
Speeding ticket(s) 6.77 14.97 Traffic offence(s) 3.22 9.81 Conviction(s) 3.74 14.88 Accidents (claims) 6.47 6.16 Accidents at fault (claims) 1.00 0.93 All Risk Insurance 60.62 54.58 Number of observations 3 206 627 6 066 651
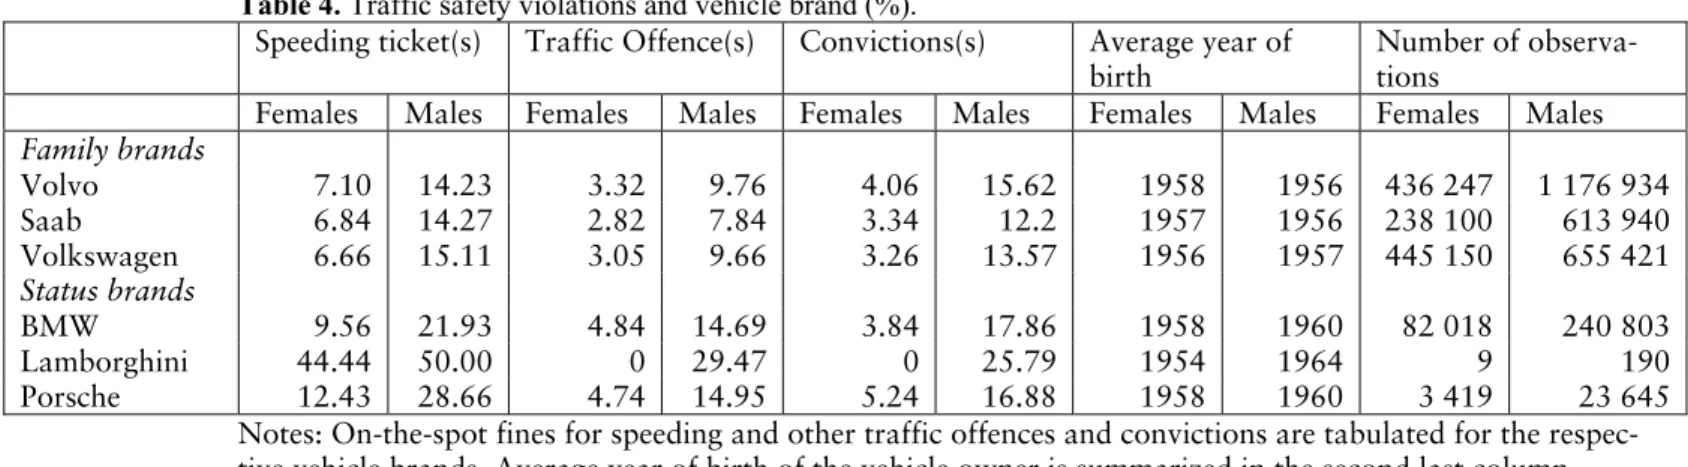
Table 4 provides descriptive statistics of traffic safety violations and vehicle brand for females and males respectively. Again females have a lower share of violations compared to males. The table further illustrates that owners of family cars have a lower share of fines and convictions compared to owners of status vehicles, which is true for both genders. This may be an indication that owners of status vehicles are slightly more inclined to take risks compared to owners of more family orientated cars. As we can see the average year of birth is about the same for owners of status and family brands. This implies that the higher share of observed traffic safety viola-tions is probably not related to age.3
3The probability of being observed as a certain type increases with age. If the
status vehicle owners had a lower average year of birth, their age could be one explanation of the higher share of observed traffic safety violations.
Table 4. Traffic safety violations and vehicle brand (%).
Speeding ticket(s) Traffic Offence(s) Convictions(s) Average year of birth
Number of observa-tions
Females Males Females Males Females Males Females Males Females Males
Family brands Volvo 7.10 14.23 3.32 9.76 4.06 15.62 1958 1956 436 247 1 176 934 Saab 6.84 14.27 2.82 7.84 3.34 12.2 1957 1956 238 100 613 940 Volkswagen 6.66 15.11 3.05 9.66 3.26 13.57 1956 1957 445 150 655 421 Status brands BMW 9.56 21.93 4.84 14.69 3.84 17.86 1958 1960 82 018 240 803 Lamborghini 44.44 50.00 0 29.47 0 25.79 1954 1964 9 190 Porsche 12.43 28.66 4.74 14.95 5.24 16.88 1958 1960 3 419 23 645
Notes: On-the-spot fines for speeding and other traffic offences and convictions are tabulated for the respec-tive vehicle brands. Average year of birth of the vehicle owner is summarized in the second last column, while the total number of observations is in the last column.
4. Results
4.1 Traffic violations, age and gender
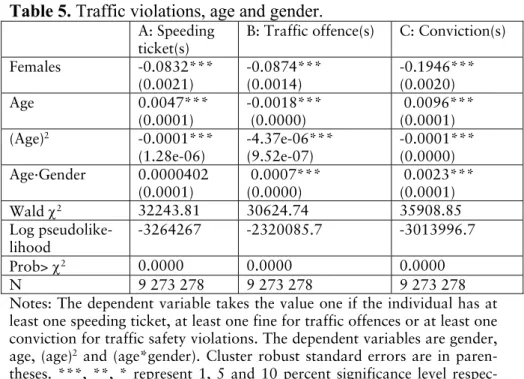
Table 5 contains the results of a probit estimation of equations (1) to (3), where dependent variables represent different traffic violations. From col-umn A-C in Table 5 it is possible to calculate the marginal effects of age and gender, which are reported in Table 6.
Table 5. Traffic violations, age and gender.
A: Speeding
ticket(s)
B: Traffic offence(s) C: Conviction(s) Females -0.0832*** (0.0021) -0.0874*** (0.0014) -0.1946*** (0.0020) Age 0.0047*** (0.0001) -0.0018*** (0.0000) 0.0096*** (0.0001) (Age)2 -0.0001*** (1.28e-06) -4.37e-06*** (9.52e-07) -0.0001*** (0.0000) Age·Gender 0.0000402 (0.0001) 0.0007*** (0.0000) 0.0023*** (0.0001) Wald 2 32243.81 30624.74 35908.85 Log pseudolike-lihood -3264267 -2320085.7 -3013996.7 Prob> 2 0.0000 0.0000 0.0000 N 9 273 278 9 273 278 9 273 278 Notes: The dependent variable takes the value one if the individual has at least one speeding ticket, at least one fine for traffic offences or at least one conviction for traffic safety violations. The dependent variables are gender, age, (age)2 and (age*gender). Cluster robust standard errors are in
paren-theses. ***, **, * represent 1, 5 and 10 percent significance level respec-tively. See main text for more details.
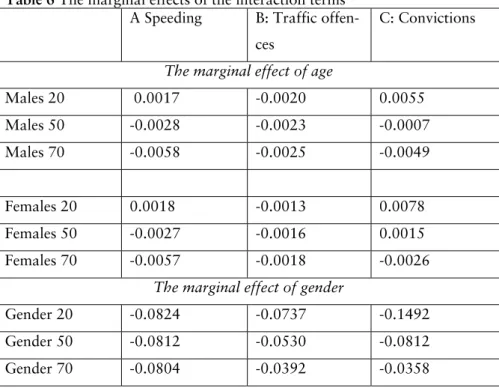
Speeding increases for younger groups, up to the early 30s, and decreases when the individual becomes older, for both genders.4 Males are more
likely to get speeding tickets compared to females. Fines for other traffic offences are less likely the older an individual is, and males are more likely to be fined for other traffic offences compared to females.5 This suggests
that younger individuals and males are riskier compared to older individu-als and females. Younger individuindividu-als are more likely to have convictions compared to older individuals and males are more likely to have convic-tions than females. 6 More precisely, the probability of convictions
in-creases up to age 46.5 for males and age 57.5 for females and dein-creases for older vehicle owners7. Females below the age of 86 have fewer convictions
compared to males, for females over 86 the relation is the reverse, indicat-ing that females have more convictions compared to males.8
4-β
2/2β3= 0.00470612/2(0.0000747) = 31.5 is the breakeven age for males and
-β3=-0.0018414/2(-0.00000437)= 210.69 is the break-even age for males. (β2+
(β2+ β4)/2β3=-(0.00470612+0.0000402)/2(-0.0000747) = 31.77 is the break-even
age for females (Marginal probit estimates from equation (1) in column A in Table 5).
5β 2/2
β4)/2β3=(-0.0018414+0.0006894)/2(-0.00000437)= 131.8 is the break-even age
for females. Marginal probit estimates from equation (2) are in column B in Table 5.
6 Note of caution: there is a difference between fines and convictions since fines are
available from 2004-2007 while convictions are available from 1973-2007. This implies that the probability of having a conviction is more likely to increase with age compared to fines. The fact that the probability of having conviction decreases with age may partially be due to the fact that data on convictions is accessible from 1973: with the result that individuals aged 50 and over may not have convictions from their youth included in the data. Note that an individual aged 60 in year 2006 was aged 27 in 1973, which is the first year of our register data of convictions. From hereon this is not commented on further.
7-β
2/2β3=0.0096234/2(0.0001034)= 46.53 is the breakeven age for males and
-(β2+ β4)/2β3=-(0.0096234+0.0022697)/2(-0.0001034)= 57.51 is the break-even age
for females (Marginal probit estimates from equation (3) in column C in Table 5).
8 -β
1/β4 =-(-0.1946331)/0.0022697=85.75 (Marginal probit estimates from eq (3),
Table 6 The margi the int
A Speeding raffic offen- C: Convictions nal effects of eraction terms
B: T ces
The marginal effect of age
Males 20 0.0017 -0.0020 0.0055 Males 50 -0.0028 -0.0023 -0.0007 Males 70 -0.0058 -0.0025 -0.0049 Females 20 0.0018 -0.0013 0.0078 Females 50 -0.0027 -0.0016 0.0015 Females 70 -0.0057 -0.0018 -0.0026
The marginal effect of gender
Gender 20 -0.0824 -0.0737 -0.1492 Gender 50 -0.0812 -0.0530 -0.0812 Gender 70 -0.0804 -0.0392 -0.0358
Since males report that they drive more per year (see Table 2), we perform a sensitivity analysis by including the stated number of kilometers per year and estimate equations (1) – (3). The results in Tables 1 and 2 in the Ap-pendix show the same pattern as when not controlling for annual mileage. Females below the age of 89 have fewer convictions than males when trolling for annual mileage, which is slightly higher compared to not con-trolling for annual mileage. As before, the probability of fines for traffic offences decreases with age. The break-even age is, however, lower com-pared to not controlling for annual mileage. The probability of being fined for speeding increases up to the early 30s and thereafter decreases, as be-fore. The probability of convictions increases up to the age of 47 for males and 57 for females, which is slightly higher for both genders compared to not controlling for stated annual mileage. Still males are more likely to have a fine or conviction compared to females.
4.2 Including more explanatory variables
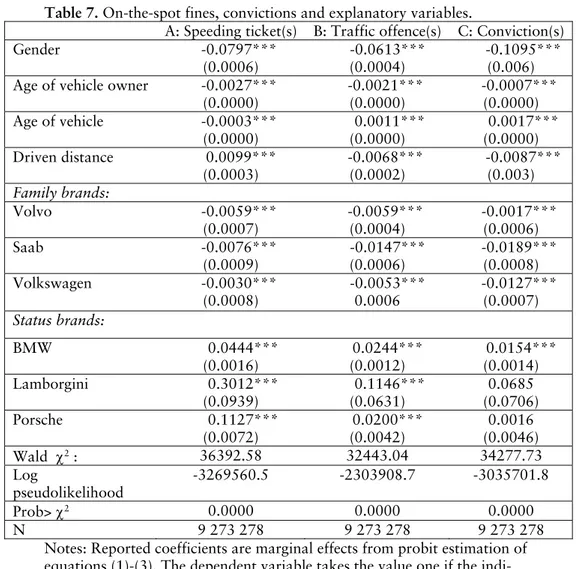
In this section we include more explanatory variables. Apart from age and gender, we also include annual mileage, age of vehicle and indicator vari-ables for six vehicle brands. Table 7 contains the results of a probit estima-tion of equaestima-tions (4) to (6), where the dependent variables represent differ-ent traffic violations. More specifically, column A represdiffer-ents at least one fine for traffic offences other than speeding, column B represents at least one speeding ticket and column C represents at least one conviction. All explanatory variables are illustrated in the table.
Gender has a negative effect on traffic violations suggesting, as before, that males are more likely to be fined or convicted for traffic violations com-pared to females. Older vehicle owners are less likely to have traffic viola-tions; this suggests that younger vehicle owners are more risky. Further-more, owners of older vehicles are less likely to get speeding tickets, but more likely to have at least one ticket for other traffic offences and at least one conviction.
Observed annual driven distance follows the same pattern as vehicle age, which suggests that individuals that are convicted for traffic violations or fined for traffic offences other than speeding drive in the lower kilometer classes, while individuals with speeding tickets state that they drive in some of the more exposed kilometer classes.
Moreover, owners of family orientated vehicles (Volvo, Saab, and Volks-wagen) are less likely to be fined and convicted for traffic violations, while owners of status vehicles (BMW, Porsche and Lamborghini) are more likely to be fined for speeding and other traffic safety violations.9
9 We performed a sensitivity analysis on the first observation of each
Table 7. On-the-spot fines, convictions and explanatory variables.
A: Speeding ticket(s) B: Traffic offence(s) C: Conviction(s) Gender -0.0797*** (0.0006) -0.0613*** (0.0004) -0.1095*** (0.006) Age of vehicle owner -0.0027***
(0.0000) -0.0021*** (0.0000) -0.0007*** (0.0000) Age of vehicle -0.0003*** (0.0000) 0.0011*** (0.0000) 0.0017*** (0.0000) Driven distance 0.0099*** (0.0003) -0.0068*** (0.0002) -0.0087*** (0.003) Family brands: Volvo -0.0059*** (0.0007) -0.0059*** (0.0004) -0.0017*** (0.0006) Saab -0.0076*** (0.0009) -0.0147*** (0.0006) -0.0189*** (0.0008) Volkswagen -0.0030*** (0.0008) -0.0053*** 0.0006 -0.0127*** (0.0007) Status brands: BMW 0.0444*** (0.0016) 0.0244*** (0.0012) 0.0154*** (0.0014) Lamborgini 0.3012*** (0.0939) 0.1146*** (0.0631) 0.0685 (0.0706) Porsche 0.1127*** (0.0072) 0.0200*** (0.0042) 0.0016 (0.0046) Wald 2 : 36392.58 32443.04 34277.73 Log pseudolikelihood -3269560.5 -2303908.7 -3035701.8 Prob> 2 0.0000 0.0000 0.0000 N 9 273 278 9 273 278 9 273 278 Notes: Reported coefficients are marginal effects from probit estimation of equations (1)-(3). The dependent variable takes the value one if the indi-vidual has had at least one on-the-spot fine for traffic offences, at least one on-the-spot-fine for traffic offences and at least one conviction for a traffic safety violation. Independent variables are age of vehicle owner, vehicle age, driven distance (owners stated number of kilometers per year), and dummy variables for vehicle brand. *, **, *** represents the 10%, 5% and 1% significance level. Cluster robust standard errors are in parenthe-ses. See main text for more details.
5. Conclusions
This paper contributes to previous findings on traffic violations in the acci-dent literature by setting out and exploring richer data on traffic violations. Our findings confirm previous results in the accident literature in that males have a higher share of fines and convictions, compared to females. Furthermore, young individuals, especially males, have a higher share of fines, compared to older individuals. This result also holds when control-ling for (stated) annual mileage driven per year. This suggests that males, and especially young males, are more inclined to take risk than females. Our descriptive analysis shows that a slightly higher share of women make claims compared to males. This may be a consequence of the fact that a higher share of women has All Risk Insurance compared to men; with higher coverage there are incentives to make a claim. This, however, needs further empirical (econometrical) analysis to provide robust conclusions.
Our findings also indicate a difference between speeding and other traffic violations with respect to annual driven distance and vehicle age: The re-sults suggest that speeders drive newer vehicles and longer distances per year, while individuals with on the spot fines for traffic offences other than speeding are more likely to drive shorter distances and older vehicles.
Furthermore, we provide a first attempt at testing the prediction that own-ers of status vehicles are more likely to speed and engage in risky behavior. The results suggests that owners of status vehicle brands are more likely to have to pay on-the-spot-fines, especially for speeding, while owners of family orientated vehicle brands are less likely to have traffic violations. We do not know, however, if risky types purchase status vehicles, or if drivers become risky while driving these vehicles. This implies that we can-not distinguish between adverse selection and moral hazard. An adverse selection prediction is that a certain type buys a certain vehicle, while a
moral hazard prediction is that an individual becomes a certain type after buying (driving) the vehicle. It is reasonable to expect that individuals be-have differently in different types of vehicles; an individual may take less risk in a family orientated vehicle and more risk in a status vehicle or on a motorcycle. One reason is that risk taking is likely dependent on the con-text, age and family status. This is reflected in the way insurers generally treat the insurance contracts: a motorcycle, family vehicle and status vehi-cle are viewed as different risks, even if the objects are owned by the same individual. With the available data, however, it is not possible to observe in which vehicle an individual drove when committing the traffic violation, which rules out testing the hypothesis that people behave differently in different vehicles.
The methodological issues associated with insurer data need further analy-sis. Besides the debated problems of endogenous and exogenous variables, insurer data also challenges methodology. Our primary conclusion is that insurer data provides a viable alternative in studying risky behavior. One main advantage is that it is possible to study the behavior of both accident-free and accident-involved individuals. The large numbers of observations also provide an opportunity to study different subgroups over several time periods and for different vehicles. Insurer data further enables a combina-tion of accident analysis and economic theory, since it generally contains information about payments (premiums) and loss indemnity (costs). This implies that it is possible to study risky behavior and financial outcomes using the same set of individuals and data source.
References
Aarts, L. and I. van Schagen: 2006, ”Driving speed and the risk of road crashes: A review”. Accident analysis and prevention 38(2), 215-24.
Angrist, J., D. and J-S. Pischke: 2010, “The credibility revolution in em-pirical economics: how better research design is taking the con out of econometrics”. The Journal of Economic Perspectives 24(2), 3-30.
Arvidsson, S: 2010 “Does private information affect the insurance risk? Evidence from the automobile insurance market” Swopec workingpaper No. 2010:1.
Bener, A., T. Özkan and T. Lajunen: 2008, ”The driver behavior question-naire in Arab Gulf countries: United Arab Emirates and Quatar”. Accident
analysis and prevention 40(4), 1411-1417.
Benfield, J.A., W.J. Szlemko and P.A. Bell: 2006, “Driver personality and anthropomorphic attributions of vehicle personality relate to reported ag-gressive driving tendencies”. Personality and Individual Differences, 42(2), 247-258.
Boyer, M., Dionne G. and Vanasse C: 1991 “Infractions au code de la sécurité routière, infractions au code criminal et gestion optimale de la sécurité routière”. L’Actualité Économique, Revue d’Analyse Èconomique, 67(3).
Delhomme, P., Dobbeleer, W., S. Forward., A. Simões, G. Adamos, A. Areal, J. Chappé, C. Eyssartier, P. Loukopoulos, T. Nathanail, S. Nord-bakke, H. Peters, R. Phillips, M. Pinto, M-F. Ranucci, G.M. Sardi, J.Trigoso, T. Vaa, K. Veisten and E. Walter: 2009 Campaigns and
Aware-ness Raising Strategies in Traffic Safety (CAST). Manual for designing, implementing, and evaluating road safety communication campaigns.
Bel-gian Road Safety Institute BIVV, Brussels.
Forward, S: 2006 “The intention to commit driving violations – A qualita-tive study”. Transportation Research part F, 9(6), 412-426.
Forward, S: 2008, “Driving violations investigating forms of irrational rationality”. Digital comprehensive summaries of Uppsala dissertations from the faculty of social sciences 44. Uppsala University.
Groegor, J.A. and I.D. Brown: 1989, “Assessing one's own and others driving ability: Influences of sex, age, and experience”. Accident Analysis
and Prevention 21(2), 155-168.
Janke, M.K: 1991, “Accidents, mileage, and the exaggeration of risk”.
Accident Analysis and Prevention 23(2-3), 183-188.
Jonah, B.A: 1997, “Sensation seeking and risky driving: a review and syn-thesis of the literature”. Accident Analysis and Prevention 29(5), 651-655.
Jonah, B.A.: 1997. “Sensation seeking and risky driving: a review and syn-thesis of the literature”. Accident Analysis and Prevention 29, 651–665.
Lum, H. and J.A. Reagan: 1995, “Interactive Highway Design Model: Accident Predictive Module. Available at:
http://www.tthrc.gov/pubrds/winter95/p95wil4.htm. Public Roads Maga-zine.
Massie, D.L., K.L. Campbell and A.F. Williams: 1994, “Traffic Accident involvement rates by driver age and gender”. Accident Analysis and
Pre-vention 27(1), 73-87.
Massie, D.L., P.E. Green and K.L. Campbell: 1997 “Crash involvement rates by driver gender and the role of average annual mileage”. Accident
Analysis and Prevention 29(5), 675-685.
Maycock, G: 1985, “Accident liability and human factors-researching the relationship”. Traffic Engineering and Control 26, 330-335.
McKenna, F.P., R.A. Stanier and C. Lewis: 1991, Factors underlying illu-sory self-assessment of driving skill in males and females. Accident Analysis
and Prevention, 23(1), 45-52.
Nallet, N, M. Bernard and M. Chiron: 2010, “Self reported road traffic violations in France and how they have changed since1983”. Accident
Analysis and Prevention (in press).
Nilsson, G: 2004, “Traffic Safety Dimensions and the Power Model to Describe the Effect of Speed on Safety”. PhD Thesis, Lund Institute of Technology and Society, Traffic Engineering, Lund, Sweden.
Parker, D., J.T, Reason, A.S.R. Manstead and S.G. Stradling: 1995, “Driv-ing error, driv“Driv-ing violations and accident involvement”. Ergonomics 38(5), 1036-1048.
Peck, R.C. and J. Kuan,: 1983, “A statistical model of individual accident risk prediction using driver record, territory and other biographical fac-tors”. Accident Analysis and Prevention 15(5), 371-393.
Peden, M, R. Scurfield, D. Sleet, D. Mohan, A.A. Hyder and E. Jarwan et al (Eds): 2004, “World report on road traffic injury prevention summary” World Health Organization. Geneva, Switzerland. Available at: http://www.who.int/violence_injury_prevention/publications/road_traffic/w orld_report/summary_en_rev.pdf
Rumar, K: 1985, “The Role of Perceptual and Cognitive Filters in Ob-served Behavior” in Human Behavior and Traffic Safety, L. Evans and R.C. Schwing, eds. New York: Plenum Press.
Ross, H.L: 1960, “Traffic law violation: a folk crime” Social Problems 8(3), 231-241.
Statistics Sweden: 2010, “Vanligaste personbilsmärken” [The most com-mon vehicle make], statistics available at:
http://www.scb.se/Pages/ProductTables____10516.aspx.
Stradling, S.G., M.L. Meadows and S. Beatty: 2000, “Driving as part of your work may damage your health.” In G.B. Crayson (Ed.), Behavioral
Svenson, O: 1981, “Are we all less risky and more skilful than our fellow drivers?”. Acta Psychologica 98, 1253-1269.
Wallén- Warner H. and J. Sandin: 2010, “The intercoder agreement when using the Driving Reliability and Error Analysis Method in road traffic accident investigations”. Safety Science 48(5), 527-536.
Walton, D: 1999, “Examining the self-enhancement bias: Professional truck drivers' perceptions of speed, safety, skill and consideration”.
Trans-portation Research Part F, 2, 91-113.
Weinstein, N. D:1999, “What does it mean to understand a risk? Evaluat-ing risk Comprehension”. Journal of the National Cancer Institute, Mono-graph 25, 15-20.
Yagil, D: (1998). “Gender and age-related differences in attitudes toward traffic laws and traffic violations”. Transportation Research Part F: Traffic Psychology and Behaviour 1(2), 123-135.
Åberg, L: 1993, “Drinking and driving: intentions, attitudes and social norms of Swedish
male drivers”. Accident Analysis and Prevention 25(3), 289-296.
Åberg, L. and Rimmö P.A: 1998, “Dimension of aberrant driver behav-ior”. Ergonomics 41, 39-56.
Appendix A
Description of the information included in each observation:
1. Demographic characteristics of the policyholder: individual id-number, year of birth, gender, home district and self-reported number of kilometers driven per year.
2. Residential area risk classification: the actuarial predicted risk in the neighborhood where the policyholder lives.
3. Car characteristics: vehicle model, brand, construction year, size of engine and vehicle-id.
4. Vehicle risk classification: the actuarial risk classification regarding the vehicle.
5. Private information: The number of on-the-spot fines for speeding or other traffic offences of the policyholder during 2004-2007, and the number of convictions a policyholder had during 1973-2007. 6. The type of policy purchased: Traffic Insurance (required if the car
is in use but not if it is deregistered), Limited Damage Insurance, All Risk Insurance (not generally required for new cars since most manufacturers provide insurance) and Additional insurance. 7. Deductible Choice: The only contract providing deductible choice
(high or low deductible) is All Risk Insurance. 8. Premium: The price of the insurance policy.
9. Period covered: From date and to date for each period in the con-tracts. The number of days with insurance is 1-365 days during one period.
10. Realization of risk: Claims submitted by the policyholder and in-formation on which insurance covers the claim. It is also possible to identify the level of at-fault in the claim (full, partial or no re-sponsibility).
11. Driver information: The insurer’s information on the identity of the reported driver in an accident (not necessarily the policy-holder), age, gender and personal identity number and private in-formation according to (5). Note that additional drivers are the private information of the policyholder, since the premium is not dependent on drivers other than the vehicle owner.
12. Other variables: Household identity, two or more policyholders in the same household share the same household-id.
Appendix B
Table 1. Traffic violations, age, gender and stated annual driven
kilometers. A: Speeding ticket(s) B: Traffic offence(s) C: Conviction(s) Gender -0.0845*** (0.0021) -0.0856*** (0.0015) -0.1916*** (0.0020) Age 0.0043*** (0.0001) -0.0014*** (0.0000) 0.0010*** (0.0001) (Age)2 -0.0001*** (1.30e-06) -8.70e-06*** (9.51e-07) -0.0001*** (0.0000) Age·Gender 0.0001* (0.0001) 0.0006*** (0.0000) 0.0022*** (0.0001) Kilometer class 0.008*** (0.0003) 0.0106*** (0.0002) -0.0173*** (0.003) Wald 2 33954.17 31537.56 37650.62 Log pseudolike-lihood -3261373.5 -2312514 -2999989.4 Prob> 2 0.0000 0.0000 0.0000 N 9 273 278 9 273 278 9 273 278 Notes: The dependent variable takes the value one if the individual has at least one speeding ticket, at least one fine for traffic offences or at least one conviction for traffic safety violations. The independent variables are gen-der, age, (age)2 and (age*gender) and kilometer class. Cluster robust
stan-dard errors are in parentheses. ***, **, * represent 1, 5 and 10 percent significance level respectively.
From Table 1 it is possible to calculate the marginal effects in Table 2: The marginal effect of age:
gender age age i 4 3 2 2 (.)
The marginal effect of gender: age gender i 4 1 (.) (i = equation (1)-(3))
Table 2 The marginal effects of the interaction terms
A Speeding B: Traffic offences C: Convictions
The marginal effect of age
Males 20 0.0015 -0.0017 0.0059 Males 50 -0.0028 -0.0023 -0.0007 Males 70 -0.0056 -0.0026 -0.0051 Females 20 0.0016 -0.0011 0.0081 Females 50 -0.0027 -0.0016 0.0015 Females 70 -0.0055 -0.0020 -0.0030
The marginal effect of gender
Gender 20 -0.0826 -0.0732 -0.1486 Gender 50 -0.0794 -0.0545 -0.0840 Gender 70 -0.0779 -0.0421 -0.0409
Break even ages: Speeding
-β2/2β3= -0.004325/2(-0.000071) = 30.46 is the break-even age for males.
-(β2+ β4)/2β3=-(0.004325+0.0000947)/2(-0.000071) = 31.12 is the
break-even age for females
Marginal probit estimates from equation (1) in column A in Table 1.
Traffic offences:
β2/2β3=-0.001387/2(-0.0000087)= 79.71 is the break even age for males.
(β2+ β4)/2β3=(-0.001387+0.0006225)/2(-0.0000087)= 43.94 is the break
even age for females
Marginal probit estimates from equation (2) in column B in Table 1.
Convictions:
-β2/2β3=-0.010365/2(-0.0001105)= 46.9 is the break-even age for males.
break- Break even point when females have a higher share of convictions com-pared to males:
-β1/β4 =-(-0.1916188)/0.0021527=89.01