May 1, 2002 / Vol. 27, No. 9 / OPTICS LETTERS 707
Absolute determination of the wavelength and
spectrum of an extreme-ultraviolet
beam by a Young’s double-slit measurement
R. A. Bartels, A. Paul, M. M. Murnane, H. C. Kapteyn, and S. BackusJILA, University of Colorado and National Institute of Standards and Technology, Boulder, Colorado 80309-0440
Y. Liu and D. T. Attwood
Center for X-Ray Optics, Lawrence Berkeley National Laboratory, and Applied Science and Technology Graduate Group, University of California, Berkeley, Berkeley, California 94720
Received November 18, 2001
The interference pattern produced by irradiation of a pair of pinholes with a beam contains information on both the spatial and the temporal coherence properties of the beam, as well as its power spectrum. We demonstrate experimentally for what is believed to be the first time that the spectrum of an extreme-ultraviolet (EUV) beam can be obtained from a measurement of the interference pattern produced by a pinhole pair. This approach offers a convenient method of making absolute wavelength and relative spectral intensity calibrations in the EUV. © 2002 Optical Society of America
OCIS codes: 030.1670, 260.3160, 260.7200, 260.1960, 070.4790, 300.6170.
Although Young performed his original double-slit experiment 200 years ago,1
it continues to yield new insights into the properties of light sources. The interference pattern resulting from a double slit (or pinhole pair) is commonly used to measure the spatial coherence properties of a light source in the visible2
as well as in the extreme-ultraviolet3,4
(EUV) regions of the spectrum. This interference pattern results from the path difference of the incident light f ield from each slit to the observation point. In a standard coherence measurement the incident field is assumed to be quasi monochromatic, so temporal coherence effects are isolated from a measurement of spatial coherence.5
However, under conditions in which a broad-bandwidth source illuminates a pinhole pair, the interference pattern will contain both temporal and spatial coherence information on the source as well as the power spectrum.6
In this Letter we demon-strate that the power spectrum of a coherent EUV beam, consisting of four harmonic orders generated by high-harmonic emission7,8(HHG), can be measured by
analysis of the far-f ield intensity distribution produced by a pinhole pair. Such a spectral measurement can be calibrated by a straightforward measurement of the geometry of the experiment, providing absolute wavelength and relative intensity information. This approach proves particularly useful in the EUV, since wavelength calibration to high accuracy can be achieved with straightforward measurements, and the only element that has a spectral response that must be separately calibrated is the CCD. This experiment is, to our knowledge, the first spectral measurement of a nonmonochromatic source by analysis of the pinhole-pair interference pattern at any wavelength.
Our analysis is based on coherence theory.2,5,6,9
In the far field the path-length difference between two sampled portions of a field [P1 and P2 in Fig. 1(a)]
gives rise to an interference pattern that is determined by the spatial and temporal coherence of the source. This path difference also introduces a time delay,
t 苷 Dr兾c 苷 dx兾共zc兲, that generates an autocorrela-tion, RE共t兲Eⴱ共t 2 t兲dt, of the incident field. The Wiener –Khinchin theorem shows that the power spectrum is the Fourier transform of the f ield auto-correlation.5
Therefore, measuring the pinhole-pair interference pattern is equivalent to measuring the power spectrum of the f ield that is incident on the pin-hole pair, provided that the f ield is spatially coherent and the spatial extent of the f ield autocorrelation is less than the width of the Airy pattern from a single pinhole in the observation plane. This connection has
Fig. 1. (a) Schematic of the experimental setup, where we have recorded (b) the EUV interferogram (note that the in-tensity is weakest for blue and strongest for red colorings), and (c) average of (b) along the y axis. The experimen-tal conditions used here are z苷 2.85 m, d 苷 20 mm and
d苷 574.6 mm.
708 OPTICS LETTERS / Vol. 27, No. 9 / May 1, 2002
been known for some time6
but to date has not been exploited for a determination of the power spectrum of a light field.
The exact relationship between the interference pattern and power spectrum can be derived as follows. The intensity distribution in the observation plane after illumination of two pinholes equally can be written as I共x兲 苷 2I共0兲共x兲 ∑ 1 1 g12共x兲cos µ 2p d l0z x ∂∏ , (1)
where I共0兲共x兲 is the Airy distribution due to diffraction through a pinhole of width d, d is the pinhole sepa-ration, z is the distance from the pinhole pair to the observation plane, l0 is the central wavelength of the
light f ield, and g12is the complex degree of mutual
co-herence. Here the time delay has been transformed to the spatial coordinate x 苷 zct兾d. At any particu-lar wavelength, the fringe visibility,5
m12 苷 关I共x兲max2
I共x兲min兴兾关I 共x兲max1 I共x兲min兴, is simply the value of g12
at x苷 t 苷 0, i.e., m12苷 g12共0兲. More generally,9
g12共t兲 苷 T21兵 ˆS共n兲m12共n兲其 , (2)
where ˆS共n兲 is the power spectrum normalized such that R`0Sˆ共n兲dn 苷 1. From Eq. (1), the interference
pattern from a pinhole pair, shown in Fig. 1(b), will have a broad spatial extent determined by the Airy distribution from a single pinhole. The modulations within the Airy disk are due to interference of the two pinholes. The slow modulations are due to the inter-ference of the broad bandwidth associated with several harmonics, while the fast oscillations are determined by the central wavelength. The depth of modulation is determined by the spatial coherence of the beam, and therefore this technique can also be applied to light fields with imperfect spatial coherence.
Equation (1) is best analyzed in the spatial fre-quency domain. A Fourier transform of Eq. (1) gives
T兵I共x兲其 ⬅ F 共 fx兲 苷 2T共 fx兲 ≠ Ω d共 fx兲 1 1 2 Sˆ共 fx兲m12共fx兲 ≠关d共 fx2 f0兲 1 d共 fx2 f0兲兴 æ , (3)
where ≠ is the convolution operator, T共 fx兲 苷 T 兵I共0兲共x兲其
is a dc spike, d共 fx兲 is the Dirac delta function,
f0 苷 d兾共zl0兲 is the carrier spatial frequency
due to the pinhole-pair interference pattern, and ˆ
S共 fx兲m12共 fx兲 苷 T 兵g12共x兲其. Thus, a Fourier transform
of the interferogram produced from a Young’s pinhole-pair measurement should yield three terms: a dc term corresponding to a spike at zero (or dc) frequency and two terms containing information on the power spectrum convolved with the dc spike and weighted by the spatial coherence function at that frequency. As a result, the resolution of a spectral measurement is limited by the width of the dc spike. This resolution limit approximately corresponds to the number of interference fringes that can be resolved under the Airy distribution from a single pinhole and is thus pro-portional to the diameter of the pinhole and inversely
proportional to the pinhole separation. Equation (3) yields information on only the product of the power spectrum and the spatial coherence function at any frequency. However, in the case of HHG generated in a hollow-core fiber,7
the four to f ive harmonics that emerge are phase matched. As a result, we expect the spatial coherence m12共n兲 across the entire
four-harmonic spectrum to be very high and nearly constant. Recent spatial coherence measurements made under the same conditions, and with the same harmonics irradiating an aperture simultaneously, confirm this assumption. Fringe visibilities of unity were observed over most of the beam, and for this pinhole separation the average coherence as a function of wavelength, R`0Sˆ共n兲m12共n兲dn, is ⬃0.9, indicating
that the average spectral deviation of the spatial coherence is ,1022兾nm.
For our experiments we used 27-fs laser pulses generated by an amplif ied Ti:sapphire laser system at a 5-kHz repetition rate, a wavelength of 760 nm, and with energy of⬃700 mJ.10
The pulse is focused into a 10-cm-long, 150-mm-diameter hollow-core fiber filled with 30 Torr of Ar gas such that the HHG process is phase matched and peaked at the 21st harmonic under our conditions.7
A 0.35-mm-thick Al filter is used to remove the fundamental IR beam, after which a 20-mm-diameter pinhole pair with a 574.6-mm center-to-center separation (as verif ied by a scanning electron microscope) is placed 95 cm from the fiber exit. The EUV beam was measured to be ⬃1 mm 1兾e2 diameter at this location. The far-f ield
diffraction pattern observed 2.85 m from the pinhole pair with an EUV-sensitive CCD camera (Andor) with an exposure time of 60 s is shown in Fig. 1(b). An additional 0.35-mm-thick Al f ilter placed immediately before the CCD camera eliminates unwanted IR scat-tered light. The HHG spectra were also measured by an imaging EUV spectrometer (Hettrick Scientif ic HiREFS SXR-1.75), which measures h共n兲 ˆS共n兲, where h共n兲 is the relative efficiency of the spectrometer.
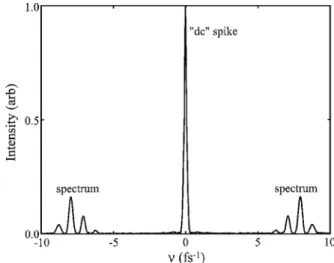
Figure 2 shows the spatial frequency distribution along the x dimension, obtained from a Fourier
Fig. 2. Fourier transforms of Fig. 1(b), showing the spatial frequency distribution scaled in optical frequency. The central frequency observed in the sidebands corre-sponds to the 21st harmonic of the laser at 800 nm.
May 1, 2002 / Vol. 27, No. 9 / OPTICS LETTERS 709
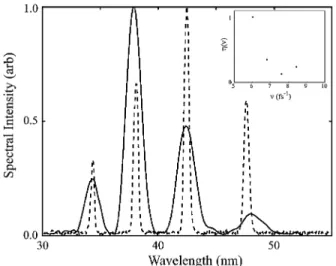
Fig. 3. EUV spectrum obtained from a spectrometer 关 ˆS共n兲h共n兲兴 (dashed curve) and from the spatial coherence measurement 关 ˆS共n兲兴 (solid curve). The inset shows the spectrometer relative efficiency, h共n兲, inferred from these data. When the spectrometer data are convolved with the pinhole resolution, the measured and calculated linewidths agree to within 10%.
transform of the interferogram produced by the pinhole pair [shown in Fig. 1(b)]. The high quality of the data of Fig. 2 is due in large part to the fact that the two-dimensional Fourier transform of the in-terferogram (with substantial random detector noise) implicitly averages over all 256 lines of data in the y dimension. In essence, we take 256 simultaneous single-shot f ield autocorrelation traces; the interfero-gram averaged over all y is shown in Fig. 1(c). The optical frequency axis is obtained by multiplication of the spatial frequency axis by zc兾d. Therefore, the pinhole separation and the distance to the detector determine the calibration of the wavelength axis in Fig. 3. The three terms expected from Eq. (3) are clearly shown in Fig. 2. The dc spike appears at the zero spatial frequency and has a fractional width of Dn兾n0苷 0.022, which agrees well with the predicted
resolving power of Dn兾n0 苷 0.8d兾d, or 0.027 for our
experimental geometry.
The percent error in the optical frequency calibration can be written as Dn兾n 苷 Dz兾z 1 Dd兾d and demon-strates that the accuracy of the frequency scaling is directly related to the accuracy of the geometry measurement. In this experiment the distance to the detector is measured within ⬃ 6 0.02% and pinhole separation is measured within ⬃60.008%, with an overall accuracy of ⬃60.03% 共62 THz兲. Note that it is easy to obtain an accuracy much higher than the resolving power of the instrument. An alternative technique for calibration of the optical frequency is to use a well-characterized, narrow-band optical source (e.g., a He –Ne laser) at one wavelength and record the interference fringes, which can be used to cali-brate the scaling constant, zc兾d. Once determined, that constant can be used to accurately calibrate the spectrum of an optical field in any spectral region.
The HHG spectrum appears as two sidebands well separated from the dc term of the spatial frequency
distribution. The harmonic peaks are broadened be-cause of the intrinsic resolution of this measurement; i.e., we measure a convolution T共n兲 ≠ ˆS共n兲m12共n兲 or
T共n兲 ≠ ˆS共n兲, assuming constant m12共n兲, as is the case
for this experiment. The broadening is evident from the comparison of the spectrum measured by the x-ray spectrometer (dashed curve of Fig. 3) compared with the pinhole spectrum (solid curve of Fig. 3). However, the width of the spectrum obtained from the x-ray spectrometer after being convolved with the dc spike is identical to that obtained from the pinhole pair. The difference in the intensity of the two spec-tra is due to the varying efficiency of spectrometer response, assuming constant spatial coherence across the harmonic spectrum, as explained above. The inset of Fig. 3 plots the ratio of the two spectra, 关 ˆS共n兲h共n兲兾 ˆS共n兲 苷 h共n兲兴. The spectral response, in-cluding an⬃50-nm SiO2passivation layer on the CCD
chip, must be known for a complete determination of the spectral intensity distribution.
In summary, we have experimentally demonstrated a robust and accurate technique that allows the abso-lute wavelength and spectrum of a light f ield to be de-termined from the far-f ield interferogram produced by a pinhole pair. Furthermore, this technique provides a convenient method of absolute calibration in the EUV region of the spectrum where few tunable sources cur-rently exist. The spectrum obtained is verif ied with the spectrum measured by a conventional grating spec-trometer. The resolution of the pinhole-pair spectrum can be improved by a simple change in geometry, by ei-ther shrinking the pinhole diameter or increasing the pinhole separation, at the cost of reduced photon f lux. The quality of the data is extremely high because of the implicit averaging of the two-dimensional Fourier transform. Finally, this experiment provides verif ica-tion of an important link between the spatial coherence properties of an optical field and its power spectrum.
The authors gratefully acknowledge support for this work from the U.S. Department of Energy. R. Bar-tels’s e-mail address is bartels@jila.colorado.edu. References
1. T. Young, Philos. Trans. R. Soc. London 12, 387 (1802). 2. B. Thompson and E. Wolf, J. Opt. Soc. Am. 46, 895
(1957).
3. C. Chang, P. Naulleau, E. Anderson, and D. Attwood, Opt. Commun. 182, 25 (2000).
4. Y. Lui, M. Seminario, F. Tomasel, C. Chang, J. Rocca, and D. Attwood, Phys. Rev. A 63, 033802 (2001). 5. J. Goodmann, Statistical Optics (Wiley, New York,
1985).
6. E. Wolf and A. Devaney, Opt. Lett. 6, 168 (1981). 7. A. Rundquist, C. Durfee, Z. Chang, C. Herne, S.
Backus, M. M. Murnane, and H. C. Kapteyn, Science 280, 1412 (1998).
8. C. Durfee, A. Rundquist, S. Backus, C. Herne, M. M. Murnane, and H. C. Kapteyn, Phys. Rev. Lett. 83, 2187 (1999).
9. A. Friberg and E. Wolf, Opt. Lett. 20, 623 (1995). 10. S. Backus, R. Bartels, S. Thompson, R. Dollinger,
H. C. Kapteyn, and M. M. Murnane, Opt. Lett. 26, 465 (2001).