http://www.diva-portal.org
This is the published version of a paper presented at 45th Computing in Cardiology
Conference (CinC), SEP 23-26, 2018, Maastricht, NETHERLANDS.
Citation for the original published paper:
Abdukalikova, A., Kleyko, D., Osipov, E., Wiklund, U. (2018)
Detection of Atrial Fibrillation From Short ECGs: Minimalistic Complexity Analysis for
Feature-Based Classifiers
In: 2018 Computing in Cardiology Conference (CinC) IEEE
Computing in Cardiology Conference
https://doi.org/10.22489/CinC.2018.147
N.B. When citing this work, cite the original published paper.
Permanent link to this version:
Detection of Atrial Fibrillation From Short ECGs: Minimalistic Complexity
Analysis for Feature-Based Classifiers
Anara Abdukalikova
1, Denis Kleyko
1, Evgeny Osipov
1, Urban Wiklund
21
Lule˚a University of Technology, Lule˚a, Sweden
2Ume˚a University, Ume˚a, Sweden
Abstract
In order to facilitate data-driven solutions for early de-tection of atrial fibrillation (AF), the 2017 CinC confer-ence challenge was devoted to automatic AF classifica-tion based on short ECG recordings. The proposed solu-tions concentrated on maximizing the classifiersF1score,
whereas the complexity of the classifiers was not consid-ered. However, we argue that this must be addressed as complexity places restrictions on the applicability of inexpensive devices for AF monitoring outside hospitals. Therefore, this study investigates the feasibility of complex-ity reduction by analyzing one of the solutions presented for the challenge.
1.
Introduction
This paper is related to the studying of detection of one of the cardiovascular diseases - Atrial Fibrillation (AF) ar-rhythmia. AF is a supraventricular tachyarrhythmia which is represented by inconstant atrial activation and, therefore, dysregulation of atrial contractions. This type of arrhyth-mia has a severe influence on the heart health condition and can cause congestive heart failure, stroke and even lead to death. The work on solving the problem of early AF detection has been done before and different detec-tion techniques were used. Although most of the previous studies showed quite high and promising results, they had a number of limitations. Small sized datasets were pre-sented by carefully selected signals of only two classes: AF and normal. In this paper we use the database of sig-nals from the 2017 PhysioNet/CinC Challenge and investi-gate one of the solutions presented for the challenge. How-ever, the original 2017 PhysioNet/CinC Challenge formu-lation did not account for the future deployment on the resource-limited devices for patients to use on a daily ba-sis. This requirement limits the computational complexity of a solution. Therefore, we explore a solution for reducing necessary computations by investigating feature selection method called Reduced Feature Elimination (RFE).
2.
2017 PhysioNet/CinC Challenge
The limitations mentioned for the previous studies of AF detection were aimed to be solved in the 2017 Phy-sioNet/CinC Challenge. The purpose of this challenge was to develop an accurate mechanism for AF detection among four different types of signals: AF, normal, other (presented by some other cardiac abnormalities) and noise. The dataset included 8528 single lead ECG recordings for training and 3658 ECG signals for testing, which were not disclosed to the public [1]. The distribution between differ-ent classes was as follows: Normal 5076 recordings; AF 758 recordings; Other 2415 recordings; Noise 279 record-ings. All recordings had a duration varying from 9 s to ap-proximately 61 s and were sampled at 300 Hz. In compar-ison to previous studies, the challenge of this competition was that the dataset comprised bigger amount of signals and the detection had to be realized among four different classes with unequal number of samples in each. Addition-ally, each of the signals had a short duration, which also in-creases the complexity for AF detection mechanism, since usually ECG signals are recorded with 12 leads for a longer duration. Thus, the detection mechanism has to be able to properly extract meaningful features to accurately detect abnormalities in signal. Nevertheless, the evaluation of the best performing solutions [1] showed that it was possible to achieve the F1score of 0.8926 and 0.83 on the trainingand testing sets respectively.
3.
Motivation
Since AF is considered to be the most common form of heart arrhythmia and significantly influence patients health, its early recognition is crucial and requires reli-able tools for its detection. Practical limitations require that the diagnosis can be done outside a hospital using in-expensive equipment and without an involvement of med-ical staff. Also, the time required to make a test should be short. As it was mentioned earlier, the deployment of AF detection mechanism should be realized on the resource-limited devices. Local processing is preferable because
of intermittent connectivity to a server and data privacy concerns. However, this demands simple computations in-cluding preprocessing, feature extraction, running a classi-fier, etc. Thus, the practical limitation is the computational simplicity of the solution and small memory footprint.
4.
Methods
4.1.
Features
This paper uses the solution to the 2017 CinC chal-lenge presented in [2] by F. Andreotti et al. The solu-tion in [2] extracts 171 different features from filtered seg-mented ECG recordings where the number of segments de-pends on the length of the recording. Therefore, for each recording the mean values across all segments were used for further processing. The features were extracted using HRV metrics, signal quality indices, and also morpholog-ical ones. In addition to time domain, frequency domain, and non-linear HRV metrics, metrics based on clustering of beats on Poincare plots were used. Extracting this large number of features in the real-time predicting systems de-ployed on resource-limited devices is highly doubtable due to computational and time constraints. Therefore, this pa-per explores ways of reducing the number of features by using the RFE method as well as a statistical approach.
4.2.
Selection of features
Two approaches to feature selection briefly described below were used for reducing the number of features so that it would take less computations and time to extract them for new recordings.
4.2.1. Recursive Feature Elimination
The RFE method [3] is a greedy optimization technique used to find the subset of best performing features. It re-peatedly builds classification models, keeps the worst or the best feature subsets aside and afterwards computes the accuracy. This process is repeated until all features are ex-hausted. Next, RFE evaluates and ranks all the features based on the order of their elimination. Finally, it provides the indices of the best performing features, which form the subset of the pre-specified size. It is worth noting that the features forming the best performing subset by means of their ranking are not necessarily individually the most im-portant. These features perform well only in combination with the other features in the corresponding subset. Dur-ing the experiments, the RFE function from Python scikit-learn machine scikit-learning library was used to implement the technique.
4.2.2. Statistical approach
The statistical approach included calculating p-values for each feature using Kruskal-Wallis and multiple com-parison tests. The p-values were calculated as the sum of all scores after the multiple comparison test. It allows selecting features where all classes differ. Then the de-sired number of features could be chosen among the fea-tures with the highest p-values. During the experiments, kruskalwallisand multcompare methods in Mat-lab were used to implement the statistical approach.
4.3.
Classification method
For the sake of brevity, this paper reports only the per-formance obtained for one classification method. The chosen method is Random Forest Classifier since it was reported to demonstrate the highest classification perfor-mance for the solution in [2].
5.
Results
Table 1. Classification performance of Random Forest Classifier for different number of features selected by the RFE method.
Number of features Accuracy F1score
5 0,78 0,70
8 (only time domain) 0,78 0,65
10 0,81 0,74
15 0,82 0,75
20 0,83 0,75
171 (the whole set) 0.83 0.75 This section presents the classification performance ob-tained for the reduced number of features when using the RFE method and the statistical approach. First, to obtain the reference performance Random Forest Classifier was trained on the whole feature set. Next, we calculated the performance of Random Forest Classifier on the best fea-ture subsets chosen by the RFE method for several subset sizes. The number of selected features varied between 5 and 20. The performance was measured with accuracy and mean F1 score using 5-fold cross-validation. The results
reported in Table 1 were obtained by averaging ten inde-pendent runs of the classifier.
The accuracy and mean F1 score on the whole set of
171 features were 0,83 and 0,75 respectively. The results showed that in comparison to the usage of all 171 features using the subset of only 5 best features worsened accuracy by 6.0% and F1score by 6.7%. On the other hand, the
dif-ference to the redif-ference classifier when using 10 features was only 2.4% and 1.3% respectively. There was no signif-icant performance degradation for 15 and 20 features. The
subset of 15 features was chosen as the resulting one for future feature extraction from new signals and for training other classifiers. This subset was more appealing to use, since its feature extraction did not require any frequency domain computations. It included features extracted from Recurrence Quantification Analysis (RQA), Poincare plot, Signal Quality Indices (SQI) metrics, 3 morphological and 2 residual features. Using only 8 features extracted from the temporal domain was comparable to 5 best features in terms of accuracy but was 7.1% worse in terms of F1score.
Table 2 presents features included in the subsets formed by the RFE method. The table includes only three subsets, since there was no big difference in the results obtained for 15 and 20 features subsets.
Table 2. Top ranked features for best feature subsets. # Name of a feature 5 features subset 10 features subset 15 features subset 1 SampleAFEv 3 3 3 2 RR 7 3 3 3 TKEO1 7 3 3 4 medRR 7 7 3 5 iqrdRR 7 7 3 6 DistNext 7 3 3 7 ClustDistSTD 7 7 3 8 rad1 7 3 7 9 rad2 3 3 3 10 DistNextnS 3 7 7 11 rsqi3 3 3 7 12 rsqi5 7 7 3 13 csqi2 7 7 3 14 csqi5 7 3 7 15 res1 3 3 3 16 res2 7 7 3 17 Pheight 7 3 7 18 QRSpow 7 7 3 19 PheigtNorm 7 7 3 20 RRlen 7 7 3
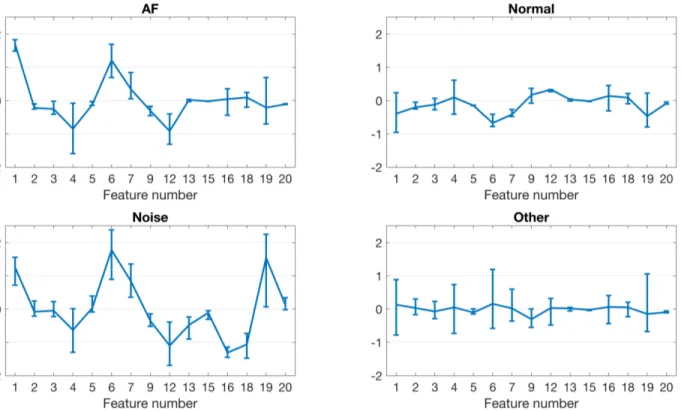
Figure 1 presents distribution of 15 features selected by the RFE for each class. Feature numbers correspond to the order in Table 1. In general, not all the features demon-strate distinct separation between the classes (e.g., #2), however, it is clear that there are features (e.g., #1, #6) where classes have different values.
Table 3 presents the confusion matrix obtained on 5-fold cross-validation for a single run of the Random Forest clas-sifier trained on all 171 features. The cross-validation ac-curacy on the data was 0.83 while mean F1score was 0.74.
Table 4 presents the confusion matrix obtained on 5-fold cross-validation for a single run of the Random Forest clas-sifier trained on the best 15 features selected by RFE. The
Table 3. Confusion matrix for all features. Predicted
AF Normal Other Noise
Actual
AF 575 36 135 12
Normal 16 4698 339 23 Other 83 647 1655 30
Noise 10 72 66 131
cross-validation accuracy on the data was 0.83 while mean F1score was 0.74.
Table 4. Confusion matrix for 15 features selected by the RFE method.
Predicted
AF Normal Other Noise
Actual
AF 572 32 143 10
Normal 23 4692 341 20 Other 102 640 1638 35
Noise 14 71 51 143
Table 5 presents the confusion matrix obtained on 5-fold cross-validation for a single run of the Random Forest clas-sifier trained on 15 features selected by the statistical ap-proach. The cross-validation accuracy on the data was 0.78 while mean F1score was 0.69.
Table 5. Confusion matrix for 15 selected features by the statistical approach.
Predicted
AF Normal Other Noise
Actual
AF 572 38 133 15
Normal 25 4604 418 29 Other 112 893 1369 41
Noise 16 84 52 127
The results in Tables 3–5 demonstrate that the clas-sification performance of the RFE-formed subset corre-sponds to that of the full set, while the classification per-formance of the subset obtained with the statistical ap-proach is lower. It is worth noting that there were only two features which were chosen by both techniques. Ta-bles 3 and 4 are resembling each other. There was a large overlap between Normal and Other classes in all the ma-trices. In fact, two largest sources of misclassifications are predicting instances of Normal class as Other (339, 341, and 418 respectively) and predicting instances of Other class as Normal (647, 640, and 893 respectively). Mis-classifying Other as Normal was the main source of the performance degradation when using the subset from the statistical approach. The second largest overlap is between AF and Other classes. Finally, the least represented class (Noise) gets the lowest F1 score per class. It is not
sur-Figure 1. Plots illustrating distributions of 15 features selected by the RFE for each class in the dataset. Lines show medians. Bars depict and interquartile ranges between 25% and 75% percentiles. For visual purposes, the hyperbolic tangent function was applied to all values of the features. Next, each feature was scaled using z-score method. The plots depict statistics for the scaled features.
prising as the classifier is maximizing the overall accuracy, thus, it is more important to correctly classify as many as possible of the examples of the most representative class (i.e., Normal). The least representative class becomes the least important one from the point of view of the average accuracy. Note, however, that for the considered task the goal is to maximize the mean F1score, which is negatively
affected by low individual F1scores. In all tables there are
many instances of Noise class which were predicted either as Normal or Other. Therefore, for the future work it will be important to improve the correctness of predicting in-stances from Noise class.
6.
Conclusion
The presented results allow concluding that it is possi-ble to significantly decrease the complexity of the existing solutions to AF classification problem, both in terms of the extracted number of features and transforms applied to raw signals, without sacrificing the classification performance of the solution. This, in turn, increases the feasibility of deploying such solutions on resource-limited devices. Acknowledgment: The research reported here was sup-ported and funded by the PERCCOM Erasmus Mundus
Program of the European Union (PERCCOM-FPA 2013-0231). AA would like to express her gratitude to all the partner institutions, sponsors, and researchers involved in the program.
References
[1] Clifford GD, Liu C, Moody B, wei H. Lehman L, Silva I, Li Q, Johnson A, Mark RG. Af classification from a short single lead ecg recording: the physionet/computing in cardiology challenge 2017. Computing in Cardiology 2017;44:1. [2] Andreotti F, Carr O, Pimentel MA, Mahdi A, De Vos M.
Comparing feature-based classifiers and convolutional neu-ral networks to detect arrhythmia from short segments of ecg. Computing in Cardiology 2017;44:1.
[3] Guyon I, Weston J, Barnhill S, Vapnik V. Gene selection for cancer classification using support vector machines. Ma-chine learning 2002;46(1-3):389–422.
Address for correspondence: Name: Urban Wiklund
Full postal address: SE-901 87 Sweden, Ume˚a, Ume˚a University, Department of Radiation Sciences, Biomedical Engineering. E-mail address: Urban.Wiklund@umu.se