CmRAGTSinSrjCS OF
MAGNESIUM-LITHIUM-ÏTN ALLOYS
by
ProQuest N um ber: 10781607
All rights reserved INFORMATION TO ALL USERS
The q u a lity of this re p ro d u c tio n is d e p e n d e n t u p o n the q u a lity of the c o p y s u b m itte d . In the unlikely e v e n t that the a u th o r did not send a c o m p le te m a n u s c rip t and there are missing p a g e s , these will be n o te d . Also, if m a te ria l had to be re m o v e d ,
a n o te will in d ic a te the d e le tio n .
uest
P roQ uest 10781607Published by ProQuest LLO (2018). C o p y rig h t of the Dissertation is held by the A u tho r. All rights reserved.
This work is p ro te c te d a g a in s t u n a u th o riz e d c o p y in g under Title 17, United States C o d e M icro fo rm Edition © ProQuest LLO.
ProQuest LLO.
789 East Eisenhower Parkway P.Q. Box 1346
A thesis respectfully submitted to the Faculty and the Board of Trustees of the Colorado School of Mines in partial fulfillment of the requirements for the degree of Master of Science in Metallurgical Engineering, Signed Charles E, Freeman, Jr. T. Golden, Colorado Date;
1968
Approved : W. D. (Thesis Adviso A. W. Schlechten, Head Department of Metallurgical Engineering Golden, Colorado Date ;1968
11T 11U8
ABSTRACT
iïigh-purity magnesium, lithium, and tin were used to make ternary Mg-Li-Sn alloys. These alloys are located in the magnesium corner of the ternary diagram. They were heated to C, quenched in toluene at -100 F, and aged for 930 hours at 200 F. Hardness tests showed that the alloys had good stability at room temperature and in some cases moderate strength.
X-ray diffraction patterns revealed a stable precipitate, Mg^Sn, in all the alloys. Microscopic examination showed that the solubility of tin varied widely in the Mg-Li-Sn alloys. It also showed that the M g S n precipitate formed a finer structure in the ^ phase. The^ phase Mg-Ll-Sn alloys have the best properties. They possess moderate strength and good stability at room temperature, Their properties are comparable to the best Mg-Li base alloys.
CONTENTS
Page
Abstract. ... ill
Contents... iv
List of Figures... vi
List of Tables .... viii
List of Appendices ... ix
Ackxiowledgmants .... x
INTRODUCTION... 1
Survey of Previous Research ... 3
Present Work... 10
EXPERIMENTAL APPARATUS AND PROCEDURE... 1^
.Preparation of the Mg-Li Alloys... 1$
The Wet Chemical Analysis... ... 17
Preparation of the Ternary Alloys... 20
Quenching and Aging the Ternary Alloys... 21
Metallographic Examination... 22
Hardness Determinations... 23 X-ray Diffraction Studies... . 2It
T lHt8
Page
RESULTS... 2$
The Ternary Alloys, ... 2^
Rockwell "E" Hardness Results... 28
The "A" Group of Alloys ... 28
The and "C" Group of Alloys... ... . The "D” Group of Alloys... 37 DISCUSSION... UO
CONCLUSIONS ... U2
APPENDIX... U3
LIST of FIGURES
Figure Page
1. Magne sium-lithlum equilibrium diagram, ... U 2. The effect of lithium content on the yield strength and
ductility of Mg-Li alloys... 5
3. The effect of aluminum content and aging time at 200 F on the hardness of Mg-Li-A1 alloys which have a constant Mg/Li ratio... 8
It. The effect of zinc content and aging time at 200 F on the hardness of Mg-Li-Zn alloys which have a constant Mg/Li ratio... 9
Magnesium-1in equilibrium diagram ... 11
6. Lithium-tin equilibrium diagram ... 12
7. The argon purification train... 18
8. The equipment used to form the binary and ternary alloys... 19
9. The location of the Mg-Li-Sn alloys on the ternary dia gram... 27
10. The effect of aging time at 200 F and tin additions on the hardness of 87.1 % Mg-12,9 % Li alloys... .... 29
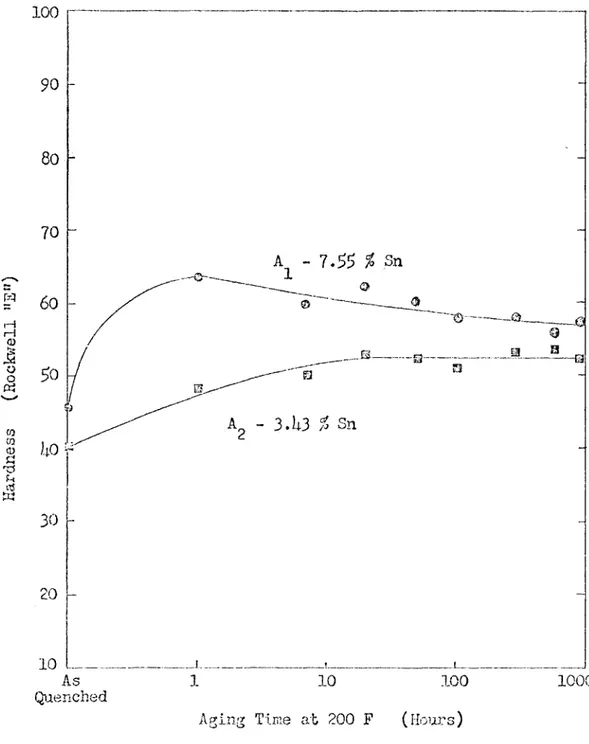
11. The effect of aging time at 200 F and tin additions on the hardness of 90.7 % Mg-9.3 % Li alloys... ... 30
T llii3
Figure Page
12. The effect of aging time at 200 F and tin additions on the hardness of 93.3 % Mg-6.3 % Li alloys... 31 13. The effect of aging tiiTie at 200 F and tin additions on the
hardness of 93.3 % Mg-l|.3 % Li alloys... 32 111. The structure of alloy A-. after 300 and 930 hours of aging
at 200 F (200X)...7 ... 33
13. The structure of alloy after 3OO hours of aging at
200 F (200X)...T ... 33
16. The structure of alloys C , G , and after 930 hours of aging at 200 F (200X)___ t...f... f... 33 17. The structure of alloy D after 300 hours of aging at
200 F (200X)...? ... 38 18. The effect of sodium content on the ductility of an
87 % Mg-9 # Li-b % Zn alloy... L5
19. The effect of sodium content on the ductility of various
alloys ... I4.6
U S T of TABLES
Table Page
1. The solubility of a third metal in the ^ phase at
slightly elevated temperatures... 6 2. The composition of the ternary alloys studied... 26 3. Knoop hardness values... ... 39
T 11U8
TJST o f APPEiffilCES
Appendix Page
I Tne chemical composition of the metals .... 1|3 II Sodium embrittlement of the Mg-Li alloys... .
III The wet chemical analysis used in this study. ... U7
ACKMCTaIEDGMENTS
Tlie author wishes to thank Dr. W. D. Copeland for his encouragement and guidance during this investigation.
The author is also indebted to Dr. P. G. Herold and Dr. W. H, Dumke for their helpful suggestions.
Financial support provided by the United States Department of Health, Education, and Welfare, is also gratefully acknowledged.
T 111(8
INTRODUCTION
Magnesium and aluminum are used as the base materials for most of the strong light alloys that are available today. Heavy elements are added to magnesium and aluminum to give the alloys strength, but these alloying elements also raise the density of the base metal. Therefore, alloying additions are usually kept below 10 weight per cent.
The addition of a light element to magnesium or aluminum alloys could have several beneficial effects. First, it would lower the density of the alloy. Second, it might strengthen the lattice of the alloy by forming a solid solution or by forming a fine precipitate
(precipitation hardening). Third, it would permit larger additions of a heavy element and thus higher strength levels might be obtained with out increasing the density of the alloy.
Several elements may be used to lower the density of aluminum. These light elements include beryllium, magnesium, silicon, and the metals of group lA, At this time magnesium and silicon are the only
light elements which are added to aluminum alloys1. These alloys have a density of 2.60 to 2,65 g/cc and are amongst the lightest aluminum
alloys available. They have moderate strength and good corrosion resist ance. The yield strength of these alloys varies from 20,000 to 1|0,000 psi.
Calcium and several metals of group lA will lower the density of magnesium. Lithium seems to be the most promising alloying element in this group. The Mg-Li alloys are extremely light (the density is around 1.3 g/cc), ductile, and fairly resistant to corrosion^. However, these alloys are fairly weak and they can not be cold worked to a satisfac tory strength level. Addition of one or more elements to the Mg-Li alloy is another method which has been used to strengthen these alloys. So far the addition of a third alloying element has failed to produce strong alloys which are stable at room temperatm’e. The addition of a fourth or fifth element to the unstable ternary alloys has not produced a satis factory alloy yet-^ 3j U, 3 ^
This study will be concerned with producing strong, light, stable alloys from magnesium, lithium, and tin. These alloys will contain 3 to 13 weight per cent lithium, )| to 10 weight per cent tin, and the remain
der will be magnesium. These alloys should have a density of about 1.6 g/cc. This is considerably lower than the density of aluminum alloys (2.6 to 2.9 g/cc) and moderately lower than the density of magnesium alloys (1.73 to 1.83 g/cc).
T 1118
Survey of Previous Research
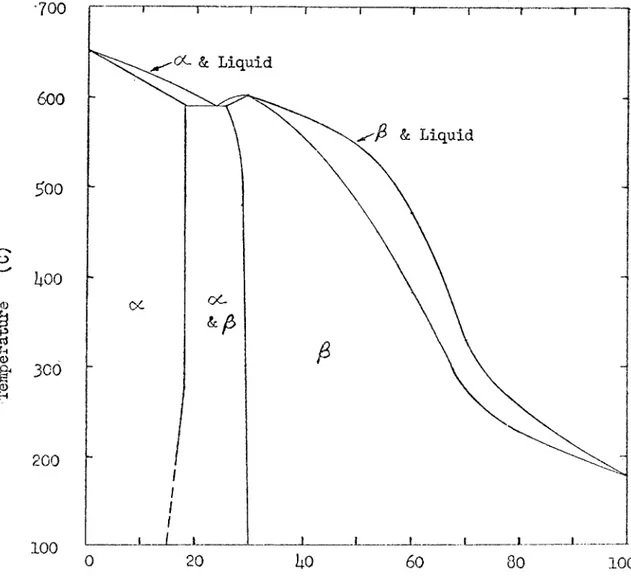
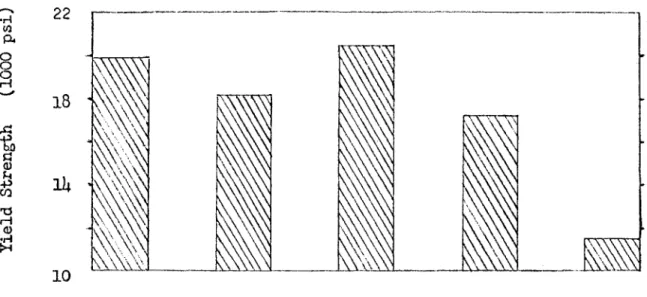
Magnesium-lithium alloys have several interesting properties which have led investigators to study these alloys for the past 25 years. The Mg-Li phase diagram as determined by Freeth and Raynor is shovm in Fig ure 1^. It indicates that only 11 weight per cent (30 atomic per cent) lithium is needed to change the structure of magnesium from hexagonal close-packed, which is inherently brittle, to body-centered cubic, which is ductile. Figure 2 shows the improved ductility of magnesium as lithium is added and the structure of the alloy changes to body-centered c u b i c A d d i t i o n of lithium also lowers the density of magnesium with out lowering its elastic modulus or corrosion resistance ^ Tlie light ductile magnesium alloys which contain about l5 weight per cent lithium are fairly weak and can not be strengthened very much by cold work. The research carried out between 19l;2 and the present time was naturally concerned with strengthening these alloys.
Solubility studies were made at the Mathieson Chem. Corp. as part of the initial program to produce commercial Mg-Li alloys \ These studies were aimed at finding the solubility of a third metal in the j# region (85 weight per cent Mg-l5 weight per cent Li) of the Mg-Li phase diagram. The results of this study are shown in Table 1. For conven ience, the metals are grouped in three solubility categories.
700
C<- & Liquid600
^ & Liquid ^00 o oc (%&
300
200
100
20
0100
Atomic Per Cent Lithium
Figure 1. Magnésium-Lithium Equilibrium Diagram - after Freeth and Raynor ^ ,
T lll;8 •r4 (0 pu
I
10
80
L.I
g s o *H •ri 4^ -P nj O W) 'g § (S MII
O o Î-» u ^ p et) P-j60
UO 20 0X
< / / /Weight Per Cent Lithiuiri
Figure 2. The Effect of Lithium Content on the Yield Strength and Ductility of Mg-Li Alloys - after Jackson et al,^
Table 1
The Solubility of a Third Metal in The ^ Phase at Slightly Elevated Terjperatures
Host Soluble . Slightly Soluble Relatively Insoluble
Ag In Ba Cu 8b B K U
A1 T1 Bi Ge Si Be Mn V
Cd Zn Ca Ni Sn Cb . Mo W
Hg Ge Pb Sr Cr Th Zr
Co Fe Ti
A small addition of the "most soluble" metalspax'ticularly
aluminum^ zinc, silver, or cadmium, will strengthen the lattice of these alloys3. However, the strength level of the ternary alloys is still too low. Further additions of a "most soluble" metal will produce a precipi tation hardening reaction and a satisfactory strength level is obtained on quenching, but these alloys overage rapidly. X-ray diffraction tech niques have shorn this precipitate to be an unstable phase, MgLi^X, where X may be aluminum, zinc, silver, or cadmium^^^. The transitory nature of this phase explains the rapid overaging which occurs in these ternary alloys. This overaging process is interesting because the pre cipitate dissolves into the lattice and leaves a second stable
preci-T lliiS
pitate^. In the Kg-LI-Al system an unstable KgLi^Al phase is formed on quenching. During the aging process, a magnesium and a lithium atom dissolve in the lattice, and the stable AlLi intermetallic compound remains.
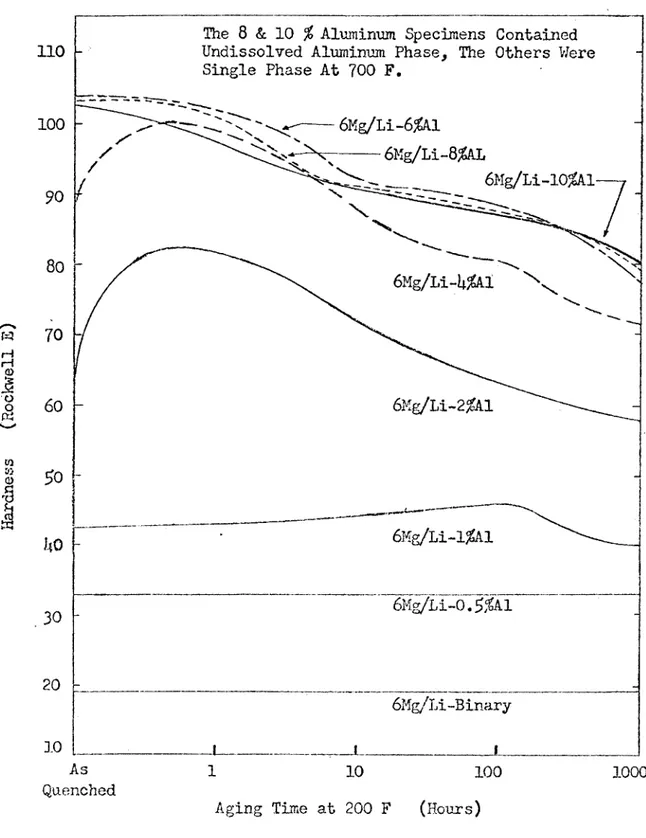
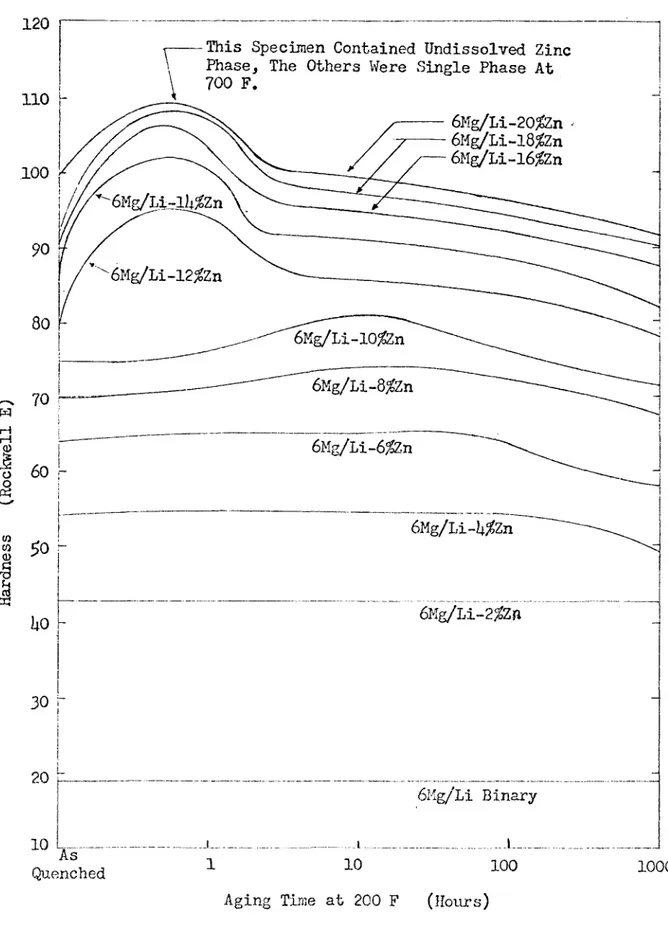
Figures 3 and U show the age hardening curves for quenched Mg-L-i-Al and Mg-Li-Zn alloys^. These graphs illustrate the hardness increase achieved by small additions of aluminum and zinc and the overaging prob lem that occurs with large additions of these elements at low tempera tures.
Several investigators have tried to stabilize these ternary alloys with the addition of a foui'th or fifth alloying e l e m e n t ^ N o promising alloys have been reported so far. Minor additions of these alloying elements do not stabilise the precipitate. Large additions of these alloying elements improve the stability of the precipitate, but these alloys still overage and the large addition of several heav^*- ele ments (20 to 25 weight per cent) make these alloys too dense to be of practical use.
At the present time, Mg-Li-A1 alloys have the best properties^. These alloys contain about weight per cent lithium and 1 to 2 weight per cent aluminum. Tîiey possess moderate strength, good corrosion
resistance, and good stability at room temperature, Mg-Li-Zn alloys have a lower corrosion resistance and are heavier than Mg-Li-A1 alloys. Addition of cadmium or silver to the Mg-Li binary alloy is not econom ical, and the resulting ternary alloys are heavier than Mg-Li-Al alD.oys
The 8 & 10 Aluminum Specimens Contained Undissolved Alumimim Phase, The Others Were Single Phase At 700 F ,
110
6Mg/Li-6%Al 6Mg/Li-8^L100
I
o o CO » oI
20
6Mg/Li-Binary10
As1
10
100
1000
QuenchedAging Time at 200 F (Hours)
Figure 3. The Effect of Aluniinnm Content and Aging Time at 200 F on the Hardness of Mg-Li-Al Alloys Which Have a Con stant Mg/Li Ratio- after Frost et al, (5).
T 1118
120
This Specimen Contained Undissolved Zinc Phase, The Others Were Single Phase At 700 F.
110
100
to COI
6Mg/Li Binary As Quenched10
100
1000Aging Time at 200 F (Hours)
Figure U. The Effect of Zinc Content and Aging Time at 200 F on the Hardness of Mg-Li-Zn Alloys Which Have a Constant Mg/Li Ratio - after Frost et al. (5).
with the same strength.
An extensive amount of research indicates that it would be very dif ficult, if not impossible, to produce a light, strong, stable alloy with one of the "most soluble" metals, A limited amount of research has been done on Mg-Li binary alloys to which a "slightly soluble" or a "rela tively insoluble" metal was added^. These alloys were fairly stable but they were not very strong. There seems to be two approaches that may be used to produce strong, light, stable Mg-Li alloys. The first would be to increase the stability of the precipitate in the alloys which contain a metal of the "most soluble" group. The second would be to work with a less soluble metal of the second or third group.
Present Work
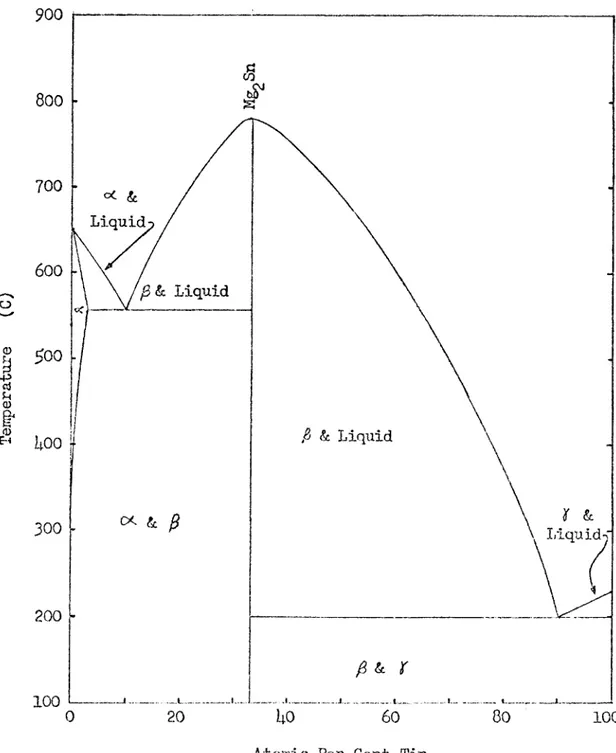
The work of the present study is aimed at producing light, strong, stable, precipitation hardenable alloys with a metal of the "slightly soluble" group, namely tin. The Mg-Sn and the Li-Sn phase diagrams (Fig ures $ and 6) are needed to explain the possible precipitation harden ing reactions in the Mg-Li-Sn system^. The Mg-Sn phase diagram shows that the solubility of tin in magnesium decreases rapidly as temperature
decreases. The intermetallic compound Mg Sn comes out of solution as the solubility of tin in the magnesium solid solution decreases. This com pound, a lithium-tin compound, or a ternary compound should come out of
T llliS
11 O (D900
800
700
oc & Liquid600
^ & Liquid ^00 ^ & Liquid 1:00300
Liquid-f200
100
100
Atomic Per Cent TinO (D
1
900
04800
•H ♦H700
600
•H CNJ 5^00 . •rt300
200
100
020
Uo60
80
100
Atomic Per Cent Tin
T U li8 13
solution in Mg-Li-Sn alloys with a high magnesium content and strengthen the magnesium solid solution. The Li-Sn phase diagram shows that sever al intermetallic coirpounds are formed between lithium and tin. The phase diagram also shows that tin is insoluble in lithium. However^ previous work has shown that at elevated teirperatures tin is slightly
soluble in a lithium solid solution that contains about 85 weight per cent magnesium^. Thus, the lithium solid solution could be strengthened by the precipitation of Li^^Sn, Mg^Sn, or a ternary coirpound as the alloys age.
The phase rule tells us that only three stable phases can coexist in a finite region of a three component system when equilibrium is reached. So if no ternary compounds are formed, then two possible alke- made triangles can be drawn in the magnesium corner of the ternary dia gram. One of these alkemade triangles is Mg-Li-Mg^Sn, the other is Mg“Li~Li|^Sn. These alkemade triangles denote the possible combinations of stable phases that will be present in the magnesium corner of the ternary diagram. Thus the same precipitate will form in the magnesium- rich and the lithium-rich phases when equilibrium is reached. So if no metastable phases occur, all the alloys in the magnesium corner of the phase diagram should have the same precipitate.
The nature of the precipitate which forms in the c< and 0 phase will be studied. Observations will be made to determine:
1, The solubility of tin in various regions of the Mg-Li phase diagram,
3. The type of precipitate formed in the ex. and phases, U. The stability of the precipitate in the oc and ^ phases. The hardness of the alloys will be measured after quenching and during the aging treatment. These measurements will be used to determine the strength and aging characteristics of the alloys.
T III48
EXPERIMENTAL APPARATUS AND PROCEDURE
This section describes the equipment and the experimental procedure used to prepare and test the Mg-Li-Sn alloys, A number of Mg-Li alloys were prepared under argon in a vertical tube furnace. A wet chemical analysis was used to determine the composition of the binary alloys. Ternary Mg-Li-Sn alloys were made from a Mg-Li binary alloy and tin or from a Mg-Li binary alloy, magnesium, and tin. These alloys were
quenched in toluene and aged. Hardness measurements were taken and photo micrographs were made during the aging treatment. X-ray diffraction was used to determine the compound that was present as a precipitate.
Preparation of the Mg-Li Alloys
The direct preparation of Mg-Li-Sn alloys of a specific composition is quite difficult because lithium tarnishes rapidly when exposed to the air or to the argon atmosphere in the dry box used. Therefore, the lithium was added to the ternary alloy by way of a binary Mg-Li alloy
of known composition.
The binary alloys were prepared with high— purity cell magnesium which was supplied by the Dow Chemical Co. and high-purity lithium which was supplied by the Foote Mineral Co. These materials were selected because of their very low sodium content. A low sodium content was spec
ified because sodiuia migrates to the grain boundaries of Mg-Li alloys and embrittles them^. The chemical analysis of the magnesium and lithium used is given in Appendix I (the chemical analysis of tin is also given in Appendix I). Sodium embrittlement of Mg-Li alloys is discussed in Appendix II.
The lithium was stored in a dry box under paraffin oil during the preparation of the alloys. The paraffin oil was used to protect the lithium when the dry box was open. It also protected the lithium during the prolonged exposure to small amounts of nitrogen in the dry box. A 50~cc mild-steel crucible was used to hold the Mg-Li charge. The mild- steel crucible and the magnesium were weighed and placed in the dry box along with a rubber stopper and a closed-end mullite tube. The dry box was evacuated and filled with argon several times. A piece of lithium was then added to the mild-steel crucible which was lowered into the mullite tube. The rubber stopper was used to seal the mullite tube dur ing transfer from the dry box to the furnace. Tlie rubber stopper also contained a '"Vycor" thermocouple well, a mild-steel stirring rod, and the connections used to provide an argon atmosphere during melting. The charge was melted in a vertical tube furnace under a purified argon
T H U B 17
atmosphere.
The high-purity argon was obtained from the Matheson Co. Water was removed from this gas with drierite and calcium chloride. Oxygen was re moved with copper turnings and titanium chips. The first two alloys were melted with the copper turnings and titanium chips heated to 700 C. Under these conditions, excessive oxidation took place, and magnesium
oxide formed on top of the melt and between the melt and crucible. When the copper taiTiings and titanium chips were held at pOO C, the
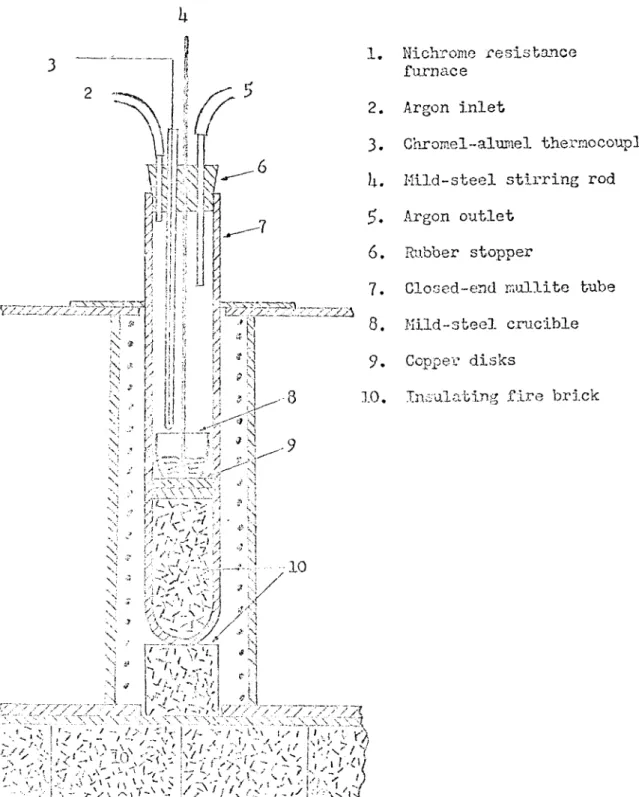
oxidation problem ended, and good alloys were produced. A diagram of the purification train and the melting furnace is shomi in Figures 7 and 8.
As the charge was heated and melted, the temperature was recorded with a chrome 1-alupiel thermocouple. When the charge had melted, it was stirred slowly with the mild-steel stirring rod. The alloys were cooled rapidly by removing the mullite tube from the furnace after the alloy had been molten for ^ to 10 minutes. After cooling, the crucible and
alloy were weighed and the approximate amount of lithium in the alloy was calculated, Tne alloys were homogenized at l;00 C for two days. Sam ples of the homogenized alloys were used for the wet chemical analysis.
The Wet Chemical Analysis
g
Xi
O 0 O rP 0 Û) ü ■P 'O w !> p. •H rH o O ILj P nj -P O •H > P r4 P P H g ^4 O Ü 3 O *r4 0) -p ■p 43 Î2 -p 43 g Ctf 1 o •H 3 5^1 rP 0 0 f-i •ri 0 o P 0 g 0 O P-. (O bO n ■H H pw r4 0 o Jh 0 o OX èn o A O O , , , rî CM cm ur\ \o tot
I
-p EH co 0 «>
1
o +3 o o g g •H U -P P O fH Q § 1 O -P 0\ ,- X ctja
I
a •ri C^ Q) E)T llii3 19
SS5S
8
.
•y 'R Nichrome resistance furnace Argon inlet Ghromel-alnmel thermocouple Mild*-steel stirring rod Argon outletRubber stopper
Closed-end mullite tube Mild-steel crucible Copper disks
Insulating fire brick
lithium which is based on the solubility difference of their carbonates^, Lithium carbonate is very soluble in water, and magnesium carbonate is fairly soluble because it hydrolyzes. However, unhydrolyzed magnesium carbonate is very insoluble in water. This analysis uses an alcoholic solution saturated with ammonium carbonate to prevent the hydrolysis of magnesium carbonate.
The chemical analysis consisted of weighing out a small sanple of the alloy, dissolving it in hydrochloric acid, precipitating the mag nesium as magnesium carbonate, decomposing it to magnesium oxide, and weighing the magnesium oxide. The weight of the magnesium oxide was used to calculate the amount of magnesium in the sasiple and the weight per cent magnesium in the alloy. Sample analyses were run using pure magnesium and lithium. They showed that about 0.1 per cent of the mag nesium was lost in the analysis. A detailed description of the chemical analysis is given in Appendix III.
Preparation of the Ternary Alloys
The ternary alloys were prepared by weighing a binary alloy of knovm composition. The quantity of tin and magnesium needed for the alloy was calculated from the known composition of the binary alloy and the desired composition of the ternary alloy. The tin was encased in the binary alloy or in the magnesium, and the charge was. added to
T 11L8 21
the crucible.
Initially the samples were placed in an alumina crucible. These crucibles were sealed inside a steel vessel that was filled with argon. The alloys were melted in a resistance furnace. This method failed to produce a satisfactory alloy. All the alloys showed internal oxidation or lithium nitride inclusions. Some of the alloys attacked the crucible.
Tlie next alloy was made in a mild-steel crucible. The crucible was placed in a closed-end mullite tube, and the ternary alloy was formed in the same manner as the binary alloy. This alloy contained a uniform ly distributed precipitate and there were no signs of oxide or nitride inclusions. The rest of the ternary alloys were made by this method. i M s method worked well because a thin film of magnesium oxide formed on the inside of the crucible before the magnesium or the Mg-Li alloy melted and released the tin.
Quenching and Aging the Ternary Alloys
The ternary alloys were homogenized for 10 hours at C in a sealed iron vessel. Metallographic examination was used to study the structure of the alloys. They appeared to be homogeneous and ready for quenching. The alloys were then heated to k2$ C, held at temperature for five hours, and rapidly quenched in toluene at - 100 F.
tubs which rested in a horizontal tube furnace was used to hold the alloys. During the aging treatment, the temperature gradient of the fur nace was reduced by placing insulating fire bricks at both ends of the furnace. A temperature profile showed a variation of 15 F in the region of the furnace where the alloys were placed.
Me tallographic Examination
A standard polishing technique was used to prepare the alloys for metallographic observation. The specimens were sanded on emery paper and polished on felt wheels with a fine suspension of alumina. A reagent containing 60 ml of ethylene glycol, Ip ml of water, 20 ml of glacial acetic acid, and one ml of concentrated nitric acid was used to etch the alloys. This reagent was used to bring out the Mg-Sn precipitate. In some of the alloys, this precipitate was very fine and could not be seen until the alloys were etched. Hence, the photomicrographs show a larger quantity of the Mg Sn precipitate than was actually present.
The binary and ternary alloys were polished, etched, and examined with the metallurgical microscope after homogenization. Photomicrographs of the ternary alloys were taken during the aging treatment with a
Baiisch & bomb métallograph. After the aging treatment was completed, the alloys were homogenized and quenched again so that metallographic observations could be made of the quenched specimens without
inter-T 11U8 23
rupting the aging treatment. The photomicrographs were taken with Kodak Contrast Ortho sheet film. Contact prints were made with Kodak Velox paper.
Hardness Determinations
The aging behavior of the ternary alloys was measured with the Rockwell hardness test. This hardness test uses a 100 kg load which is applied to a steel ball that is 1/8 in. in diameter. Standard test blocks were used to check the accuracy of this machine before the alloys were tested. The standard test blocks showed that the testing machine had an accuracy of '^-2 Rockwell ”E ” hardness units. The hardness of the
alloys was measured immediately after quenching and periodically during the aging treatment. Each hardness value is the average of three hard- ness tests.
A Tiikon tester was used to find the microhardness of various micro constituents in the alloy after the aging treatment was completed. This piece of equipment uses a Knoop indenter to apply loads of 25 gm to 50 kg to the specimen. A 500 gm load was used to test the ternary alloys.
The specimens were polished and etched prior to the microhardness test. This test consisted of using the metallurgical microscope to se lect an ai’ea for testing, sliding the specimen under the indenter, applying the 500 gm load, sliding the specimen back under the micro
scope. Then the location of the indentation was checked and the major axis of the indentation was measured. A table supplied by the Wilson Mechanical Instrument Division of the American Chain & Cable Company, Inc., was used to convert the length of the diagonal to a Knoop hard ness number.
X-Ray Diffraction Studies
A Norelco x-ray diffractometer was used to identify the precipitated phase that was present in the ternary alloys. X-rays were generated with a copper target operating at 50 K7A and 35 ma. A nickel filter provided nearly monochromatic radiation.
Diffractometer patterns of all the ternary alloys were made after homogenization and during the aging treatment. The diffractometer pat terns showed that MggSn was present in all the alloys.
T 11U8
RESULTS
This section presents the data that was obtained during this study. The data includes the composition of the ternary alloys, their aging behavior as determined by hardness tests, and their structure as shown by the photomicrographs.
The Ternary Alloys
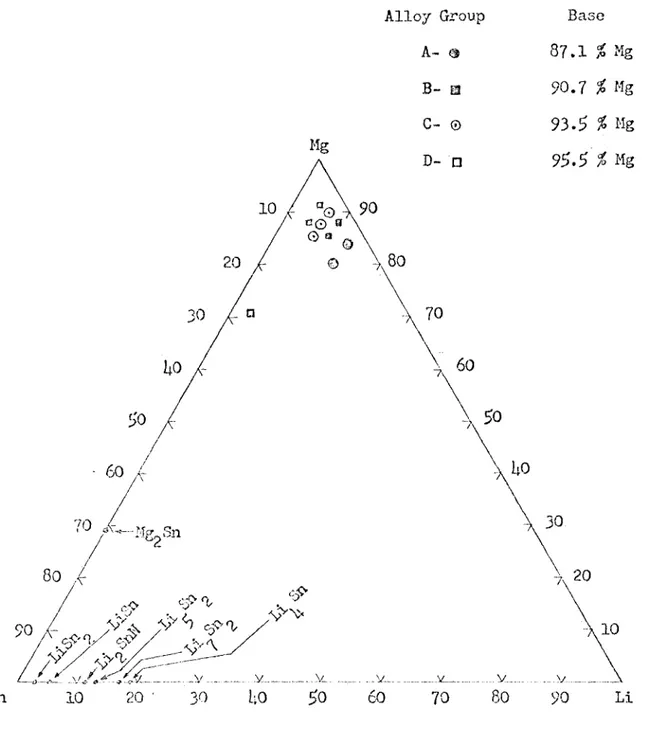
The ternary alloys were made with four Mg/Li ratios. The Mg/Li ratio was held constant for two or three alloys to simulate different tin additions to the same Mg-Li binary alloy. Thus, the effect of tin addi tions to various regions of the Mg-Li phase diagram was studied. In this study, the alloys labeled "A" were predominately ^ phase, the alloys labeled and "C" were a mixture of cz and ^ phase, and the alloys labeled "D" were predominately phase. Table 2 gives the compo sition of the 10 ternary alloys that were studied and Figure 9 Shows
the location of these alloys on the ternary diagram. Figure 9 also gives the composition of the four binary alloys to which tin was added.
Table 2
The Composition of the Ternary Alloys Studied
Alloy % Li % Sn h 80,53 11.91 7.55 4 8U.12 12.1*5 3.1*3 B 1 85.56 8.77 5.67 88.07 9.03 2.90
c
1 85.1*9 5.91* 8.57 90.05 6.26 3.69 87.89 6.11 6.00 ^1 87.61* a. 17 8.19 70.87 3.37 25.76 D 3 91.61* l*.3l* 1*.00ï Ul|8 Alloy Group A- # B- a G— © Base 87.1 2 Mg 90.7 2 Mg 93.5 % Mg D- □
10
c 0 a G ®> , 70 /T _______ V _____10
5n10
20 ' 30 2060
70 60 90 LiThe Rockwell ”E ” Hardness Results
Tlie hardness of the quenched and aged alloys is shown in Figures 10 to 13. Each point on the oui'ves represents the average of three hardness tests. The scatter is about 3 Rockwell "E" hardness units. Tin strengthened the lattice of all the alloys studied. It was found to be soluble in both the oc and
^
solid solution at 1;22 G. This is indica ted by the hardness results and is shorn directly by the photomicro graphs which follow.The "A" Group of Alloys
The alloys labeled "A" were predominazitly ^ phase. The base alloy was 87.1 per cent magnesium and 12.9 per cent lithium. The two alloys
in the "A" group showed a noticeable increase in hardness upon quenching. A further increase in hardness occurred during the aging treatment at 200 F. The alloy which contained 7.25 per cent tin overaged slightly as is shown by the drop in hardness from a maximum of 63 to 28 Rocki-fell "E". The other alloy showed an increase in hardness during the aging, treatment. A hai’dnoss level of 22 Rockwell "E" was reached. The struc ture of alloy A^ is shown in Figure 1)4 after 300 and 920 hours of aging at 200 F. The structure of A^ looks very similar. Both the alloys show
T 11L8 29
100
I
o (§ (D ■§I
10
.1__ As 110
100
1000
QuenchedAging Time at 200 F (Hours)
Figure 10. The Effect of Aging Time at 200 F fmd Tin Additions on the Hardness of 87.1 ^ Mg-12.9 % hi Alloys.
100
H HI
I
W 0)I
- 2.90 ^ Sn ÏOOO100
10
Aging Time at 200 F (Hours)
Figure 11. Tlie Effect of Aging Tii.ie at 200 F and Tin
Additions on the Hardness of 90.7 #]Hg-9.3 2 Id Alloys.
T 1118 31
100
dI
I
- 6.00 ^ Sn w 01I
10
110
1000
A3100
QuenchedAging Time at 200 F (Hours)
Figure 12. The Effect of Aging Time at 200 F and Tin
Additions on the Hardness of ^3.5 Mg-6.2 li Alloys.
100
Pi g 8.19 2 Sn o § p; co co 9. — e j^.oo Sn 101
10
100
1000
As QuenchedAging Time at 200 F (Honrs)
Figure 13. The Effect of Aging Time at 200 F and Tin Additions on the Hardness of 9^.^ #
T 11L8
33
#a
■ a 6\ On 8 tu8
Cv! t? hû r,' •f-t tû "g MI
0\ S 8 p., C) 5sfll;!
.4 ->,:■. i3 O 1-1 & M I—I < e*< O 4^I
CO ê ^zï I—I fia fine distribution of the Mg Sn precipitate in coarse grains of the 0 phase.
The "B" and "G" Group of Alloys
The alloys labeled "B" and "C" were a mixture of the oc and ^ phases The base alloy for the "B" group of alloys was 90,7 per cent laagnesiiuTi and 9.3 per cent lithium. The base alloy for the "G" group of alloys was 93.^ per cent magnesiu?a and 6.^ per cent lithium. These alloys had a Mg 8n precipitate in the oc and ^ phase. A moderate increase in hard- ness was noted upon quenching and^ or during the aging treatment.
Alloy B which contained 2.90 per cent tin formed a solid solution at U23' C, After aging at 200 F for 9pO hours, some precipitated Mg Sn was observed. Alloy B which contained $.67 per cent tin had a coarse precipitate at the grain boundaries after quenching, A photomicrograph of its structure is shovm in Figure 1$, These alloys indicate that a Mg-Li alloy which contains 90,7 per cent magnesium has a limited sol ubility for tin at 0. This solubility is between 2.90 and $.67 per cent tin. Therefore alloy B^ was slightly harder than alloy because it dissolved somewhat more tin at k'^$ C,
The photomicrographs in Figure I6 and visual inspection of the as quenched alloys show that none of the *'C" alloys dissolved all the tin at k2.$ C. Therefore, the hardness level of these three alloys is about
T Ilk#
35
:
#
\
/ %V
v\
T V-'*
4V * "
V .*
I • # ♦ %-
'X
V
a
%
j . fri ox o rA r-tn o î.^ . r I lr\x«' < 0\ 'H ?! ^ ' O Û) O H ’^'i 4^ r-'vaJ; "
M ^'g.fî co rj tn *=N (D ... cv/il fc“« o o V O ri 0)a
*ri P^-i ■■ "=4:;#
Air* fr.#
m Ki .y
V
' #
^ W - ' ' H n%
:
r-i w g r-J O fcft?
CO p’;
§
8 u o pj o P4 •?5 o 03 ?< O QJ ( M (D 4-'5 #! 5 11y
?
<3)a
«riA:
§
a ®
ü§
CVJ o Xf t o 0 X.x 1 :9 01 a •H fr-.T Ilk8 37
the same. Minor differences in hardness can be atbribiited to a slighb structural difference in the alloys.
The "D" Group of Alloys
The alloys labeled "D" were predominantly cc phase. The base for this group of alloys is 95.5 per cent magnesium and k.5 per cent
lithium. The alloys of the "D" group showed a good increase in hardness upon quenching. This group of alloys dissolved about 8 per cent tin at k25 C. This behavior is shown by the complete solubility of tin in all oy D and the very small amount of undissolved Mg Sn in alloy .
3 2 1
The hardness of the alloys which contain k.OO and 8,19 per cent tin increased slightly during the aging treatment. A "peai'litic" structure similar to the structure of alloy (Figure 16) was observed after 950 hours of aging at 200 F,
A photomicrograph of alloy which contains 25.76 per cent tin is shown in Figure 17, This alloy reached a hardness of 89 Rockwell "E" and overaged slightly to a level of 78 Rockwell "E". The Knoop micro- hardness readings in Table 3-show that the hardness of the Mg Sn preci pitate is substantially higher than’the hardness of the oc or ^ phase. Therefore, the hardness of alloy can be attributed to solid-solution hardening of the ocpha.se and to the large quantity of a fairly hard precipitate. Mg Sn.
!
3B
Figure 17. The Structure of Alloy D After 300 Hours of Aging at %X) F (200X).
ï' 39
Table 3
Knoop Hardness Values
Phsse Tested length of the Diagonal Knoop
Filar Units Conversion Factor For 1 0 ,2 5 rmi Lens
mm
Hardness
.1(30 .1)61*0 .1 995 179
oc plus Sn .6'7U .U6!tO .2663 100
DISCUSSION
This study has shown that tin is soluble in the magnesium and lithium solid solution at i|25 C for the range of compositions studied. The solubility of tin reached a maximum of about 8 weight per cent in the DC and ^ regions and decreased to about 3 weight per cent in the two phase region. A Kg Sn precipitate formed upon quenching and aging at 200 F, This precipitate formed a coarse laminar structure in the oc phase and a fine distribution of platelets or needles in the /5 phase. Very little change was noted in the precipitate during the aging treatment.
Tin was most effective when used to increase the hardness of the group "A" alloys. For a given per cent tin addition, the alloys of group "A" showed the highest hardness level. This effect is even more notice able when Figure 2 is considered. This diagram shows that the binary alloy in group "A" has a much lower strength than the binary alloys in the other three groups.
Group "A” alloys showed the best hardness increase because tin is quits soluble in this region of the phase diagram. A second reason for
the good hardness level obtained in the group "A" alloys would be the fine structure of the precipitate which formed. The alloys of group "A" have about the same strength level as the Mg-Li alloys which contain 1 to 2 per cent aluminum. However, the Mg-Li-Sn alloys are somewhat heavier than the Mg-Li-Al alloys. The Mg-hilSn alloys might bo improved by the addition of 1 to 2 per cent aluminum. The aluminum would be used to strengthen the lithium solid solution and the tin would be used to form a fine precipitate.
CONCLUSIONS
1. All the alloys studied in the magnesium corner of the phase diagram formed a stable precipitate. Mg Sn. Therefore one of the alkemade triangles in this phase diagram is Mg-Li-Mg Sn.
2. Tin is fairly soluble in the cc and ^ region of the phase diagram at ii-25 C. The solubility of tin decreases sharply in the t^/o phase <x plus region,
3. Tin is most effective when used to strengthen Mg-13 % Li binary alloys «
U, These alloys have moderate strength and good stability. Their pro perties coifpare favorbly with the best Mg-Li alloys available.
T 11L8 h3
APiPEfiDIX I
The Chemical Composition of the Metals
Sodium-free magnesium was obtained from the Dow Chemical Co. (Midland, Mich.). A spectroscopic analysis of the magnesium follows in weight per cent.
% A1 % Ca % Cu % Fe % Kn
.003
-.01
-.001
.0012
-.001
Ni-.
000
$
%_Pb .003.001
Sn-.01
-.02
High-purity lithium was obtained from the Foote Mineral Co. (Exton, Penn.). A chemical analysis follows in weight per cent. The lithium is guaranteed to be 99.98 % pure.
% A1 % Ca % Cl % Co % Cr % Cu -.0010 -.0010 .OOUl -.0010 -.0010 -.0010 % Fe
-.0010
K .00i;5 % N .0031 % Na .003 % Ni-.0010
% Si-.0010
Tin (reagent, A.C.S.) was obtained from the Mallinckrodt Chemical Works. The chemical, analysis follows in weight per cent.
% As % Cu % Fe % Pb % Zn
APPEKDIX II
Sodiiuii Embrittleinent of the Mg-Li Alloys
The Mg-Li alloys produced during the fourties were very brittle. Investigation showed that the.brittleness was caused by sodium which was traced to the LiCl-LiF fluxes and the lithium metal used. Further
investigation has shown that sodium migrates to the grain boundaries of 5
Mg-Li alloys and causes grain-boundary embrittlement . The data in Fig ures 17 and 18 is presented to illustrate the effect of sodium on Mg-Li
9
and Kg-Li-Zn alloys . Sodium does not affect the properties of Mg-Li alloys when it is kept below 0,002 per cent. The data also shows that small amounts of sodium become more harmful as the lithium content is increased and the structure of the alloys change from hexagonal close- packed to body-centered cubic.
Sodium contamination can easily be avoided by, using high-purity materials that are available today. However, sodium embrittlement should be recognized as a problem when material is selected to make Mg-Li alloys.
T III48 16 d 0) o u 0) PU rj CD cti
I
g
.y) &I
70 60i|0
30 2010
0 HReduction i.n Area
Elongation
I-0
.
01;
.08 .12___L_
.16
.20
Per Cent Sodium
Figure 18. The Effect of Sodium Content on the Ductility of an 87
%
Mg~9%
Li-li%
Zn Alloy - after Frost et al. (9),% O O o CM O
S
•H < c bOtsI '' H "H , X f ? S §•H co m •H M b ^.S On pq •H jA a g 'H CM pq *4 0) %§
(q.U93 J8j) uo%%%Süo%311L8 li7
APPENDIX III
The Wet Chemical Analysis Used in This Study
The alcoholic solution of ammonium carbonate contained 1^00 cc of saturated ammonium carbonate solution, 360 cc of concentrated ammonium hydroxide, and 1900 cc of 93 per cent ethyl alcohol. This solution on being decanted, left an ammonium carbonate precipitate. The supernatant liquid was used to precipitate the magnesium as magnesium carbonate; hence, it will be called the precipitating liquid.
About 0.3 gm of each alloy was dissolved in concentrated hydro chloric acid. This solution was diluted to l8 cc; 25 cc of 93 per cent ethyl alcohol and 50 cc of the precipitating liquid were added. The solution was stirred for one minute and set aside for at least
hours. This solution was decanted onto ashless filter paper, and l5 cc of the precipitating liquid was added to the precipitate. The solution was stirred aixd decanted after sitting for one hour.
The precipitate was redissolved with the least necessary amount of concentrated hydrochloric acid. The solution was diluted to 10 cc; lii cc of the 93 per cent ethyl alcohol solution and 50 cc of the preci pitating liquid were added. Tîie solution was stirred for one minute and
set aside for at least six hours. This solution was decanted. The preci pitate was washed with l5 cc of the precipitating liquid and filtered on the same piece of ashless filter paper. The filter paper and precipitate were dried, placed in a porcelain crucible, and heated slowly. After the ammonium carbonate decomposed (at 58 C), the flame was tui'ned up and the crucible was heated until the magnesium carbonate decomposed. The mag nesium oxide was weighed and the composition of the alloy was computed.
LITERATURE CITED
1. Metals handbook: Metals Park, Ohio, Am. Soc for Metals, p. 803~808 (19^8).
2. Frost, P. D., Magnesium-Lithium alloys, a review of current devel opments, DMIC Memorandum lli6: Columbus, Ohio, Batte lie Memorial Inst., (1962),
3. Jackson, J. H,, Frost, P. D,, Loonan, A, C,, Eastwood, L. W., and Lorig, C. H., Mg-Li base alloys, preparation, fabrication, and gen eral characteristics: Trans. AIME, v. 185, p. lL9-68 (19)j.9).
ii. Busk, R. S., Leman, D. L., and Casey, J. J., The properties of some magnesium-lithium alloys containing aluminum and zinc: Trans. AIME,
V. 188, p. 9 W-51 (19?0).
5. Frost, P. D., Kura, J. G., and Eastwood, L. ¥,, Aging characteristics of Mg-Li base alloys: Trans, AÎÎ4E, v. I88, p. 1277-82 (1950).
6. Freeth, W, A, and Raynor, G. V., The systems magnesiiua-lithium, and magnesium-lithium-silver: Jour. Inst. Met., v. 82, p. 575-80 (1953-5U). 7. Hansen, Max, Constitution of binary alloys: New York, McGraw-Hill
Book Co., Inc., p. 90U & 919 (1958).
8. Dinwiddle, J. G., The separation of magnesium from lithium by means of ammonium carbonate in alcoholic solution: Am. Jour. Sci., v. 39-UO, p. 662-1 (1915).
9. Frost, P. D., Jackson, J. H., Loonara, A. C., and Lorig, C. H., The effect of sodium contamination on Mg-Li base alloys; Trans. AIME,
V. 188, p. 1171-2 (1950).
![Figure 11. Tlie Effect of Aging Tii.ie at 200 F and Tin Additions on the Hardness of 90.7 #]Hg-9.3 2 Id Alloys.](https://thumb-eu.123doks.com/thumbv2/5dokorg/4337219.98502/41.918.132.712.126.875/figure-tlie-effect-aging-tii-additions-hardness-alloys.webp)
