THESIS
1 MONTH EFFECT OF BREAKING UP SEDENTARY ACTIVITY ON INSULIN SENSITIVITY AND GLUCOSE HOMESOTASIS IN FREE-LIVING OVERWEIGHT/OBESE
ADULTS
Submitted by Laura M Schreck
Department of Health and Exercise Science
In partial fulfillment of the requirements For the Degree of Master of Science
Colorado State University Fort Collins, Colorado
Summer 2019
Master’s Committee:
Advisor: Matthew Hickey
Co-Advisor: Audrey Bergouignan Josiane Broussard
Copyright by Laura M Schreck 2019 All Rights Reserved
ABSTRACT
1 MONTH EFFECT OF BREAKING UP SEDENTARY ACTIVITY ON INSULIN SENSITIVITY AND GLUCOSE HOMESOTASIS IN FREE-LIVING OVERWEIGHT/OBESE
ADULTS
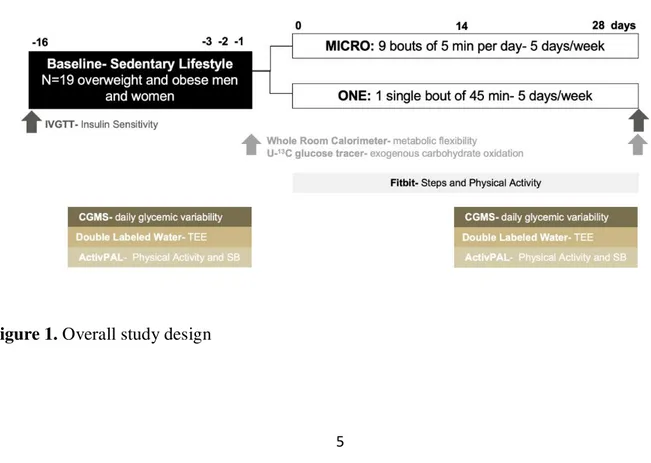
Sedentary behavior (SB) triggers an inability to adjust substrate use to substrate availability (low metabolic flexibility, MF), which may precede glucose intolerance in the pathogenesis of insulin resistance. We and others have shown that frequent interruptions in SB leads to improved glycemic control, however the underlying role of MF in this process is unknown. This study examined the effects of breaking up SB on MF and glucose metabolism in free-living overweight and obese adults. To distinguish effects of breaking up SB from being physically active, we also studied a group where participants performed a single energy matched continuous bout of exercise. Physically inactive, adults (12F/9M, mean±SD, age: 33±8 yr, BMI: 29.5±3.3 kg/m2) were randomly assigned to a 4 week intervention consisting of brisk walking for 5 min each hour for 10h, 5 d/wk (MICRO, n=10), or 4 weeks of an intervention consisting of one continuous 45 min bout of exercise per day, 5d/wk (ONE, n=9). Outcomes assessed at baseline and after each intervention included: MF (waking respiratory quotient, RQ, minus sleeping RQ as measured in a whole room calorimeter), insulin sensitivity (SI, IVGTT), 24h glycemia (continuous glucose monitor), 24h glucose oxidation (U13C glucose tracer), SB, time spent standing, time spent stepping (ActivPAL) and TEE (double labeled water). Groups were similar on all outcome variables at baseline. Linear mixed models evaluated intervention and
intervention-by-group effects. MICRO and ONE decreased time sitting and increased time stepping with no significant changes in TEE. Compared to ONE, MICRO decreased 24h
glycemic variability (p=0.06), improved the acute whole body insulin sensitivity (p=0.08) and acute insulin response to glucose (AIRg) (p=0.02) , maintained exogenous glucose oxidation (p<0.03) and improved MF (p=0.02). Independent of time sitting and stepping, breaking up SB improves glucose homeostasis and MF. The effects of such an intervention in persons with type 2 diabetes warrants further study.
ACKNOWLEDGEMENTS
I would like to thank the department of Health and Exercise Science, who has led me to this field taught me everything I know about exercise physiology, as well as provided a family like environment to lean on and learn from. This includes Brian Butki, a personal mentor who has been giving me life advice in undergraduate and graduate school, and showed me early on that I am capable of more than I thought, and that big things are sometimes started by just one person. I have also been so grateful to have Josiane Broussard and Christopher Melby on my committee, two people who are that are world class in their fields and have supported and challenged me in this process. My mentors Audrey Bergouignan and Matthew Hickey have also made this process and the past couple of years exciting and enjoyable. Audrey has shown me what work life balance looks like, and that science is exciting and fun, and surrounding yourself with people of this mindset is important and makes things much more fun. I was so lucky to join the family that is her lab, and got to learn from her, such an incredible mind and leader in her field. She has been someone to look up to professionally and personally. Matthew Hickey (aka “Dumbledore”) guided me through the journey of a master’s thesis as well as a busy and influential time in my life. His wisdom and guidance are very appreciated and have helped shape the person I am today.
I would also like to thank my parents, who instilled the love of science in me, and encouraged me to ask questions and be curios at all points in my life. They have supported me in everything I have wanted to do, both academically and personally and have shown me what hard work is, but that hard work should be done out of passion for your field and have a goal of helping others. Finally, I would like to thank Taylor, who has provided me with words of encouragement, breaks from working, and snacks; at all the appropriate times. I would like to thank him for his support of my goals and pursuits both to this point and in the future.
TABLE OF CONTENTS
ABSTRACT ... ii
ACKNOWLEDGEMENTS ... iv
LIST OF TABLES ... vi
LIST OF FIGURES ... vii
1. INTRODUCTION ... 1
2. METHODS ... 4
2.1 Participants ... 4
2.2 Study Design and Procedures ... 4
2.2.1 Overall study design ... 4
2.2.2 Screening visit... 6
2.2.3 Physical Activity Interventions ... 6
2.2.4 Physical Activity and Sedentary Behavior... 8
2.2.5 Resting Metabolic Rate, Total and Activity Energy Expenditure ... 8
2.2.6. Body Composition... 9
2.2.7 Daily Glycemic Variability ... 9
2.2.8. Run-in period diet and physical activity prior to the 24h stay in the whole room calorimeter and during the study visit ... 10
2.2.9 Twenty-four hour chamber visit ... 11
2.2.10. Twenty-four total and exogenous substrate oxidation ... 12
2.2.11. Insulin Sensitivity ... 12
2.3 Data and Statistical Analysis ... 13
2.3.1. Metabolic Flexibility... 13
2.3.2. Insulin Sensitivity Analysis ... 14
2.3.3. Statistical analysis ... 16
3. RESULTS ... 17
3.1 Participant Characteristics ... 17
3.2 Changes in sedentary behavior, physical activity, energy expenditure and body composition ... 17
3.3 Daily Glycemic Variability ... 20
3.4 Insulin Sensitivity ... 21
3.5 Metabolic Flexibility and Substrate Utilization ... 22
4. DISCUSSION ... 23
LIST OF TABLES
TABLE 1. DEMOGRAPHIC, ANTHROPOMETRIC, BODY COMPOSITION AND
ACTIVITY INFORMATION OF STUDY PARTICIPANTS ... 17 TABLE 2. EFFECTS OF 4 WEEKS OF MICRO VERSUS ONE ON BODY COMPOSITION,
RMR, TEE, AEE, PAL MEASURED BY DOUBLE LABELED WATER AND RMR ... 18 TABLE 3. EFFECTS OF 4 WEEKS OF MICRO VERSUS ONE ON 24HR GLYCEMIA
MEASURED BY CGMS ... 20 TABLE 4. EFFECTS OF 4 WEEKS OF MICRO VERSUS ONE ON WHOLE BODY INSULIN SENSITIVITY MEASURED BY IVGTT ... 21
LIST OF FIGURES
FIGURE 1. STUDY DESIGN ... 5
FIGURE 2. COMPLIANCE FITBIT DATA... 7
FIGURE 3. MINIMAL MODEL ANALYSIS OF IVGTT ... 15
FIGURE 4. 24H SITTING, STANDING, STEPPING TIME, TEE ... 19
FIGURE 5. 24H EXOGENOUS CARBOHYDRATE OXIDATION AND METABOLIC FLEXIBILITY ... 22
1. INTRODUCTION
Overweight and obese individuals are major health concerns in most Westernized countries1. Experts claim a pandemic of obesity with tremendous burdens on societies and health care systems1. In 2016 nearly 72% of all adults were overweight or obese2. Excess weight and obesity are risk factors for developing type 2 diabetes (T2D).,9.4% of the US population has been
diagnosed with T2D, and an additional 84.1 million have prediabetes3. T2D cost US taxpayers $245 billion in 2012, a 41% increase from 20071. Because the epidemic has mainly occurred over the past 50 years, blaming genetics alone is inappropriate. With the agricultural, industrial and technological revolutions, both the built and social environmental factors have however drastically been modified, which have influenced diet and physical activity. Poor diet (high fat, fructose, high saturated fat, high energy density), passive transportation and general adoption of sedentarybehaviors have become the new standards of the modern life.
Physical inactivity (i.e. not meeting the physical activity guidelines of 150 minutes of moderate to vigorous physical activity) and sedentary behaviors (i.e. having a MET value between 1 and 1.5; equivalent to sitting or lying down)4 are recognized risk factors for developing metabolic diseases including obesity and T2D5. Our research group showed that physical inactivity induced by bed rest studies in healthy normal-weight adults lead to multiple metabolic alterations including whole-body and muscle insulin resistance, even when energy balance is maintained6. This is associated with the development of metabolic inflexibility, defined as the inability of the body to adjust substrate use to changes in fuel availability and energy demand. Metabolic inflexibility is a core component of metabolic diseases and a predictor of long term weight gain7. Importantly, we showed that metabolic inflexibility induced by
physical inactivity precedes the development of glucose intolerance6. Glucose tolerance is
essential to metabolic health. Chronic hyperglycemia and also large fluctuations in blood glucose are both risk factors for developing T2D and the associated cardiovascular complications for people with diabetes 8.
Based on a large body of epidemiological and experimental evidence, the key to healthy body composition, physiology, and T2D management is largely dependent on physical activity. However, while most US adults know exercise is beneficial and 62% self-reported meeting the ACSM physical activity guidelines of 150 minutes of moderate to vigorous physical activity (MVPA), only 9.6% of those surveyed actually met the guidelines based on accelerometry9. Some studies have even found that independent of meeting the American College of Sports Medicine physical activity guidelines, sedentary time showed associations with waist
circumference, insulin, and HOMA-IR 10. Furthermore, population studies showed that adults who frequently interrupt their sedentary (sitting) time short bouts of activity have healthier metabolic profiles than adults who engage in long periods of uninterrupted sitting10. An
increasing number of intervention studies showed that acute exposure to breaking up sedentary behaviors decreases post-prandial glycemia and insulinemia in adults who are normal-weight, overweight, obese and attained of T2D11. We and others showed that these metabolic effects were more pronounced than when physical activity was performed as a single continuous match for total active time and energy expenditure12,13. We further reported that interrupting sedentary time with short bouts of walking primarily increases 24-h carbohydrate oxidation, where an energy matched single continuous bout increased 24-h fat oxidation11. Finally, performing microbouts (< or equal 5-min) of activity also lowers glycemic variability the following night5. Based on these epidemiological and experimental evidence, the US Office of Disease Prevention
and Health Promotion updated in 2018 the US physical activity guidelines 14. They state that “adults should move more and sit less throughout the day. Some physical activity is better than none. Adults who sit less and do any amount of moderate-to-vigorous physical activity gain some health benefits.”
However, no study to date has proven with a long term study that “sitting less and moving more” has positive effects on health via a study in a free living condition or the exact degree of effectiveness that this has. The purpose of this study was to examine the sustained effect of breaking up sedentary behavior with short bouts of brisk walking over four weeks on glucose metabolism, insulin sensitivity, and metabolic flexibility in free-living overweight and obese male and female adults. To distinguish the metabolic effects of breaking up sedentary behavior from time spent active, this intervention was compared to a second 4-weeks one consisting in the performance of brisk walking as a single continuous bout matched for total active time.
2. METHODS
2.1 Participants
Eligible participants were males and females (premenopausal follicle-stimulating
hormone<30mUI/mL), between ages 18-45 years old, with a body mass index (BMI) of 25-35kg/m2, weight stable for the 6 months leading up to study (+/- 3kg), physically inactive (self-reported < 150-min/week of moderate to vigorous physical activity), who walked less than 6,500 steps per day (measured over 7 days via pedometer in free- living conditions) and who were sedentary (self-reported > 9h sitting per day). Exclusion criteria includes history of renal, cardiovascular, or hepatic diseases, type 1 or type 2 Diabetes, cancer, smoking, consumption of drugs (>40g/d), HIV positive, psychiatric disorders, or any medications that interfere with energy metabolism. Participants were recruited via newspapers and online advertisements, flyers, and emails. All subjects signed a written informed consent. This study was performed in accordance with the Declaration of Helsinki and approved by the Colorado Multiple Institutional Review Board.
2.2 Study Design and Procedures
Following a screening visit and baseline measures, participants were randomly assigned to one of two 4-week intervention groups. Participants consumed their normal diets throughout the
intervention with the exception of three days prior to both pre and post chamber visits, during which time meals were provided. In pre and post intervention, insulin sensitivity was measured by an intra-venous glucose tolerance test (IVGTT), and nutrient metabolism and metabolic flexibility were measured during a 24h stay in a whole room calorimeter. During two weeks prior to the intervention and during the final two weeks of the intervention, daily glycemic variability was assessed by continuous glucose monitoring, total energy expenditure (TEE) and activity energy expenditure (AEE) were measured by the combination of doubly labelled water (DLW) and indirect calorimetry, time spent in light, moderate and vigorous physical activity and time spent sedentary were measured by 3D-accelerometry. All study visits were done at the
University of Colorado Hospital Clinical Trial Research Center (CTRC). Overview of the study design is summarized in Figure 1.
2.2.2 Screening visit
During the screening visit, participants were screened for exclusion criteria. Medical history was obtained, and a physical examination were conducted. Fasting blood sample was drawn. The International Physical Activity Questionnaire (IPAQ) was completed to inform on participant’s habitual physical activity. Total body mass was measured with a calibrated scale and body composition was determined using Dual energy X-ray absorptiometry (DXA, Hologic Delphi-W, Bedford, MA). Pedometers were given to the participants to record their daily steps for 7 days to determine their average daily steps.
2.2.3 Physical Activity Interventions
Participants were assigned to one of the two 4 week-interventions, which were as follows: - One bout of traditional exercise (ONE): Participants were asked to perform
moderate-intensity activity (brisk walking) for 45min/day, 5 days/week. Exercise days and time of day were determined by the participant.
- Microbouts of exercise (MICRO): Participants were asked to break up prolonged sitting time by completing 5 minutes of moderate-intensity activity (brisk walking) each hour for 10 consecutive hours, 5 days/week. Exercise days and the 10 hours containing a
microbout were also selected by the participant. The participants were asked to complete 10 bouts and not 9, because preliminary data showed that subjects performed 10% less of the physical activity when instructed to perform microbouts. The goal was therefore o
have them completing 45-min if moderate intensity activity per week, like participants in the ONE group.
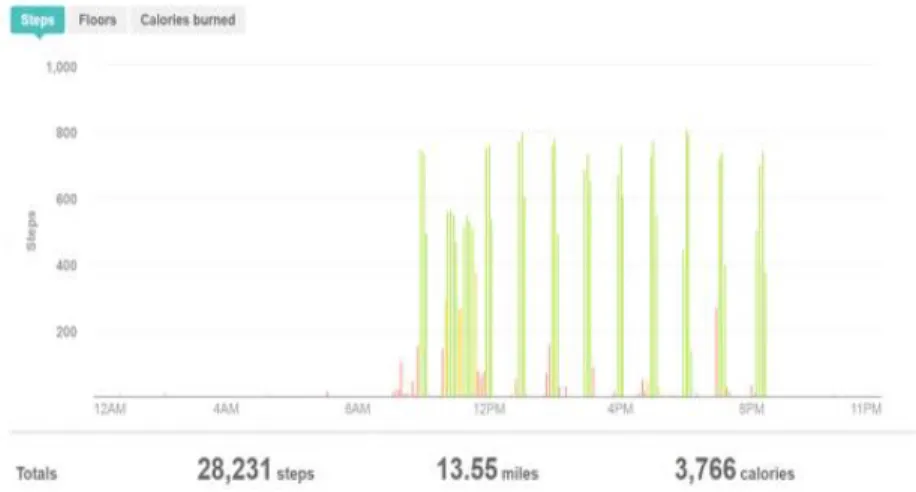
To ensure compliance, each subject was asked to wear an activity tracker (Charge 2, FitBit, San Francisco, CA) at all time except during water-based activities. Every day, the subject
downloaded the recorded data on their personal account created by the research team. If the subject was not reaching the instructed level of activity required, a member of the research team was contacting the subject to provide advices and help finding strategy to implement the
interventions into their daily life. An example of the data retrieved by the FitBit is shown in Figure 2.
Figure 2. Example of the FitBit data obtained during a day with microbouts of activity to monitor compliance in real-time.
2.2.4 Physical Activity and Sedentary Behavior
For 14 days before the start of the intervention and during the last two weeks of the intervention, daily time spent sitting, standing and stepping was monitored via ActivPAL activity monitor (PAL Technologies: Glasgow, Scotland) on the participants right leg, and Actigraph activity monitor (Actigraph GT3X+, Fort Walton Beach, FL) worn around the participant’s waist. Data from the monitors was time stamped and includes time spent sitting/lying, standing, and stepping per day. Using a customized R program15, the data is converted into a second by second file that can be used to determine time stepping, time sitting, time lying, breaks in sedentary time, number of daily steps, and duration of bouts 16,17. Time sitting and lying did not include time sleeping, only waking time, by using daily journals participants were given to record bedtime and waketime.
2.2.5 Resting Metabolic Rate, Total and Activity Energy Expenditure
TEE was measured for two weeks prior to the start of the intervention and during the final 2 weeks of the intervention using the doubly-labeled water (DLW) method as previously
described18. Subjects ingested a premixed 2g/kg total body water (TBW, estimated as 73.2% of fat free mass) dose of DLW composed of 0.2 and 0.15 g/kg estimated TBW of H218O and 2H2O, respectively. Urine samples were collected on days 0 (+4 and +5 hours post dose), 1, 4, 6, 8, 12, 14, 14+1hr. 2H and 18O enrichments were determined in urine samples by isotope ratio mass spectrometry (IRMS, Delta V Advantage, Thermo, Germany). TEE was calculated in MJ/d using
Schoeller’s equation 19,20. The food quotient was assumed to be equal to 24h respiratory quotient (RQ) measured in resting condition in the whole room calorimeter.
AEE was calculated using the following equation:
AEE (MJ/d) = TEE (MJ/d) – TEF (MJ/d) – RMR (MJ/d);
Where RMR is resting metabolic rate and was determined using a metabolic cart (ParvoMedics, for 1hr after an overnight fast)21, and TEF is the thermic effect of food that was estimated to be 10% of TEE (reference needed).
2.2.6. Body Composition
Body composition was measured in pre and post by isotopic dilution as previously described 22.
2.2.7 Daily Glycemic Variability
To measure the daily glycemic variability in free living conditions, a constant glucose monitoring system (CGMS) was worn by participants for 14 consecutive days during pre-intervention baseline measurements and during the final two weeks of the intervention. The CGMS (FreeStyle LibrePro, Abbott) is a small adhesive patch containing a micro-needle that is inserted subcutaneously into the triceps. Blood glucose is collected and stored every 15 minutes for the two weeks, and once completed, the monitor is scanned via Bluetooth and data is retrieved and stored electronically. Data was analyzed using a R software version 3.2.1 (www.rproject.org), to calculate various
glycemic variability outcomes8,15. Mean glucose (in mg/dl is the arithmetic mean of all raw CGM values. Standard deviation (SD) is the standard deviation of all raw CGMS glucose values taken. Mean amplitude of glucose excursions (MAGE) is calculated as the arithmetic average of absolute value differences between adjacent glucose peaks and nadirs, where differences exceed 1 SD from the mean. Continuous overall net glycemic action (CONGA) represents the SD of all valid differences between a current observation and an observation (n) hours earlier23.
2.2.8. Run-in period diet and physical activity prior to the 24h stay in the whole room calorimeter and during the study visit
All the meals were provided by the University of Colorado Anschutz Metabolic Kitchen. A three-day run-in diet was provided to the subjects during their run-in period, 3 days prior to their chamber stay, in both pre and post intervention. The macronutrient composition of the diet was 30% fat, 55% carbohydrates, and 15% protein of total energy intake. Percent energy per meal was as 30% breakfast, 35% lunch, 35% dinner. Total energy was calculated to match their free living energy requirements by using resting metabolic rate (RMR) which was derived from the average of (1) direct measurement via hood indirect calorimetry and (2) the equation: 24hr
intake= (23.9 x FFM in kg) + 372, dual energy X-ray absorptiometry (DXA), and an activity
factor estimated from the free living activity of the participants (ActivPAL data, IPAQ data and pedometer data). During the run-in period, participants were instructed to perform the physical activity regimen they were assigned to including the day prior to the study visit.
The assessment of energy needs in the chamber used the same equation but an activity factor of 1.5 was applied to all our subjects based on data from prior studies including chamber visits11,24.
Macronutrient composition was (65%, 20% and 15% of total energy intake for CHO, fat and protein respectively). Breakfast, lunch, dinner and snack respectively represented, 30%, 30%, 30% and 10% of total energy intake. To avoid deconditioning while confined in the chamber, subjects were asked to perform three bouts of stepping to mimic their baseline physical activity. The duration of the stepping bout was adjusted individually based on their daily steps recorded in free living conditions by the activity monitors. The estimated energy expenditure induced by stepping was added to the total estimated energy intake. Duration of stepping bout as well as total energy intake were similar in pre and post intervention.
2.2.9 Twenty-four hour chamber visit
Participants reported to CTRC at 0700h, voided and were weighed. An IV catheter was placed into the antecubital vein for collecting blood samples, and baseline breath tests were collected. Subjects then entered the whole-room calorimeter at 0800 for a 23-h stay. Participants remained seated and quiet for one hour to achieve steady state within the calorimeter. Breakfast, lunch, dinner, and snack were provided at 0900h, 1300h, 1830h, and 2130h with the same
macronutrient composition and energy intake as the run in diet. Four grams of a U-13 stable isotope tracer were given in the breakfast meal to measure exogenous carbohydrate oxidation. CO2 measurements and blood samples were collected every hour for 14 consecutive hours (0900h-2200h), and again at 0600 the following morning. Urine was collected in one jug for the “waking time” (0900h-2230h), and a different jug for “sleep-time” (2230h-0600h). Participant exited the room at 0700 the following morning. Stepping bouts were performed at 1100h, 1500h, and 1900h using an aerobic step and stepping 72 beats per minute.
2.2.10. Twenty-four total and exogenous substrate oxidation
O2 consumption (VO2) and CO2 production (VCO2) were determined from the flow rates and differences in gas concentrations between air entering and air exiting the calorimeter as previously described25, providing respiratory quotient (RQ) values. To isolate the non-protein respiratory quotient (npRQ), urinary nitrogen excretion was used.
Participants also collected an hourly breath sample for 13CO2 by blowing through a tube into two 15 ml vacutainer tubes. Breath CO2 was sampled directly from the vacutainer with a syringe, and 13CO2/12CO2 was measured with isotopic ratio mass spectrometer (IRMS, Delta V, Thermo Electron, Bremen, Germany). The average baseline enrichment value was subtracted from the enrichment relative to the subject’s own baseline. By using time matched CO2 production rates from the whole room calorimeter, 13C glucose was calculated as the instantaneous percentage recovery of 13C in expired CO2 per hour for 14-h and after 24-h.
2.2.11. Insulin Sensitivity
Whole body insulin sensitivity was determined via ‘intravenous glucose tolerance test’ (IVGTT). Participants reported to the CTRC at 0700h after an overnight fast. Participants were instructed to maintain physical activity three days prior to the test. They were also asked to eat a high carb
diet the night prior that contained either pasta, potatoes, rice or white bread (examples of meals were provided to the participants). They were asked to take pictures and write down in a dietary log the exact meal they consumed in pre intervention and to have the exact same meal post-intervention. For the IVGTT, two antecubital catheters were inserted, one on one arm for infusion of exogenous glucose and insulin, and one on the other arm for blood draws. After baseline samples were obtained at minute 0, intravenous glucose (0.3 g/kg) was infused over 1 minute and samples were collected at minutes 2, 3, 4, 5, 6, 8, 10, 12, 14, 16,and 19. After 19 minutes, 0.03U/kg of insulin was administered and blood samples were collected at minutes 22, 23, 24, 25, 27, 30, 40, 50, 70, 90, 100, 120, 140, 160, and180.
2.2.12.. Plasma metabolite and hormones analysis
Whole blood was added to a preservative (3.6 mg EDTA plus 2.4 mg glutathione in distilled water). Plasma and serum were separated after spinning and stored at -80 until analyzed. EDTA plasma samples were analyzed for glucose and insulin. Insulin concentrations were measured using a standard double antibody radioimmunoassay (EMD Millipore, St Charles, Missouri). Serum glucose concentrations were determined using the hexokinase method (reference).
2.3 Data and Statistical Analysis
Metabolic flexibility, i.e. shift from carbohydrate oxidation during the day (while feeding) to fat oxidation at night (while fasting), was assessed as the delta between the waking npRQ and sleeping npRQ values.
Metabolic flexibility = npRQ= waking npRQ – sleeping npRQ
A metabolically flexible individual utilizes primarily carbohydrates during the daytime as they are feeding, and oxidize primarily fat during fasting hours at night. Therefore, a metabolically flexible individual who is capable of a large change in substrate utilization based on availability of the course of 24 hours, have a greater arithmetic difference between waking npRQ and fasting npRQ than someone who is metabolically inflexible.
2.3.2. Insulin Sensitivity Analysis
The minimal model analysis by Richard Bergman’s MinMod program (MINMOD 6.02,
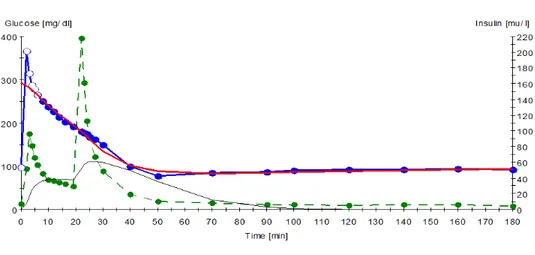
MinMod, Los Angeles, CA, USA) has been applied to various insulin resistant states, including obesity, gestational diabetes, experimental hyperinsulinemia, and insulin dependent diabetes 26. It uses a mathematical model to examine the closed system feedback loop of the body in response to an IVGTT (Figure 3). Outcome variables include insulin sensitivity (SI) which represents the effect of insulin to accelerate the ability of glucose to enhance glucose disappearance from extracellular fluid via suppression of endogenous glucose output and increased glucose disposal. The first phase of the body’s response to exogenous glucose can be measured via the Acute
Insulin Response to glucose (AIRg). This is found by calculating the area under the curve from the start of the mixing phase up until the exogenous insulin is pushed, and is indicative and the body’s endogenous response to glucose. Lastly, is glucose effectiveness (Sg), or the ability of glucose to clear itself without the presence of insulin. This is hypothesized to be via uptake in the brain. However, it is known that Beta cells can compensate for lack of insulin sensitivity by upregulating insulin secretion; using the fourth variable called Disposition Index (DI) which is the product of SI x AIRg. If an individual’s endogenous organs become less insulin sensitive pancreatic beta cells will compensate for this by releasing more insulin; this produces a larger AIRg which will compensate for the decrease in SI and allow a healthy individual to maintain their DI. A DI that changes overtime shows the lack of ability to compensate and becomes a risk factor for developing diabetes27.
Figure 3. Example of the plasma glucose and insulin concentrations during an IVGTT. Blue represents blood glucose post exogenous bolus is given in minute 1 Green represents blood
insulin (the first peak representing endogenous insulin in response to glucose, the second peak representing exogenous insulin being given at minute 19).
2.3.3. Statistical analysis
Changes (pre vs post) in 24 hour sitting/lying, stepping and standing time, waking sedentary
time, 24hr TEE and AEE, RMR, body weight and composition, daily glycemic variability, whole body insulin sensitivity, 24hr exogenous CHO oxidation, 24h npRQ and metabolic flexibility were analyzed using linear mixed model with time as repeated effect, group and group by time interaction as main effect and subjects as random effect with compound symmetry as covariance. Associations between primary outcomes were determined using linear mixed model as well. Mean and standard deviation (SD) were reported unless stated otherwise. Significance was set up at p<0.05 except for the time-by-group interaction for which it was set up at 0.1. Statistical analysis were performed with SPSS software (SPSS v.22, SAS, IBM).
3. RESULTS
3.1 Participant Characteristics
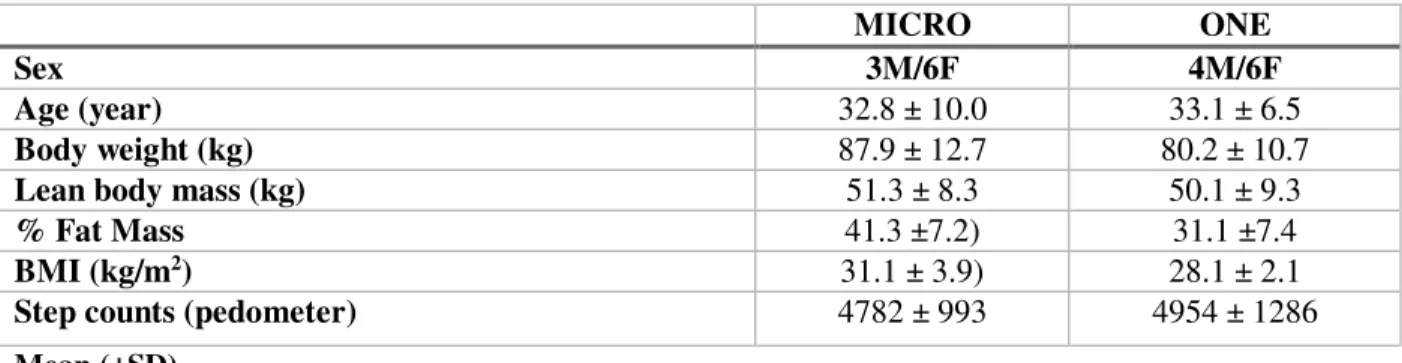
To date, nineteen sedentary adults (n=7M/12F; 33.0±8.3 years; BMI=29.9±3.0 kg/m2) out of 28 participants completed the study. There were no differences at baseline among groups, and participant’s characteristics are displayed in Table 1.
Table 1. Anthropometric characteristics of study participants
MICRO ONE
Sex 3M/6F 4M/6F
Age (year) 32.8 ± 10.0 33.1 ± 6.5
Body weight (kg) 87.9 ± 12.7 80.2 ± 10.7
Lean body mass (kg) 51.3 ± 8.3 50.1 ± 9.3
% Fat Mass 41.3 ±7.2) 31.1 ±7.4
BMI (kg/m2) 31.1 ± 3.9) 28.1 ± 2.1
Step counts (pedometer) 4782 ± 993 4954 ± 1286
Mean (±SD)
3.2 Changes in sedentary behavior, physical activity, energy expenditure and body composition
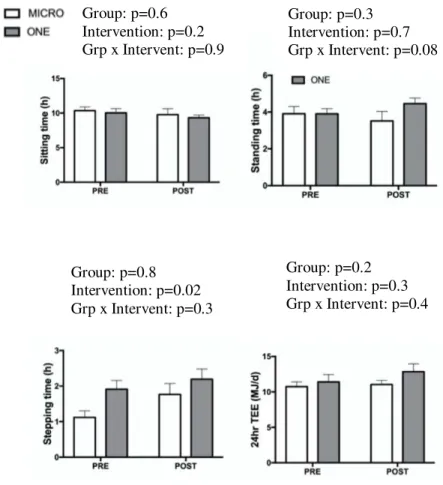
At baseline, participants in ONE spent more time stepping than those in MICRO (p<0.05). No other baseline difference was observed. Stepping time over 24hr, sitting/lying time over 24hr (sedentary time), and TEE are shown in Figure 2. As designed, both ONE (1.12±0.52 versus 1.77±0.88 hrs) and MICRO (1.91±0.74 versus 2.19±0.86 hrs) increased time spent stepping over 24hours. Neither MICRO nor ONE modified time spent sedentary over waking hours,
AEE and physical activity level (PAL). RMR tended to increase (p=0.07) after four weeks of active intervention but was no longer modified when the slight increase in FFM (p=0.07) was taken into account. Body and fat mass were maintained, indicating that subjects were in stable energy balance. No between-group nor interaction were observed (Figure 4).
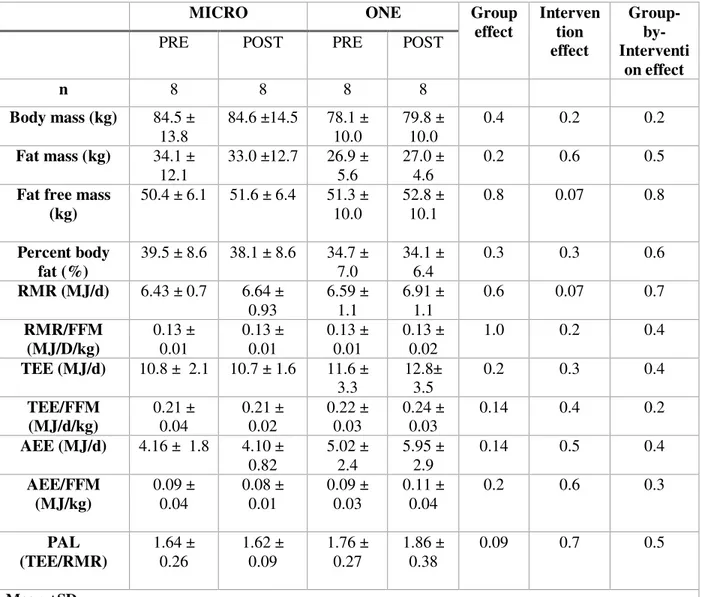
Table 2. Effects of 4 weeks of MICRO versus ONE on bodycomposition, RMR, TEE, AEE, PAL measured by doubly labeled water and a metabolic cart
MICRO ONE Group
effect Interven tion effect Group- by-Interventi on effect
PRE POST PRE POST
n 8 8 8 8 Body mass (kg) 84.5 ± 13.8 84.6 ±14.5 78.1 ± 10.0 79.8 ± 10.0 0.4 0.2 0.2 Fat mass (kg) 34.1 ± 12.1 33.0 ±12.7 26.9 ± 5.6 27.0 ± 4.6 0.2 0.6 0.5
Fat free mass (kg) 50.4 ± 6.1 51.6 ± 6.4 51.3 ± 10.0 52.8 ± 10.1 0.8 0.07 0.8 Percent body fat (%) 39.5 ± 8.6 38.1 ± 8.6 34.7 ± 7.0 34.1 ± 6.4 0.3 0.3 0.6 RMR (MJ/d) 6.43 ± 0.7 6.64 ± 0.93 6.59 ± 1.1 6.91 ± 1.1 0.6 0.07 0.7 RMR/FFM (MJ/D/kg) 0.13 ± 0.01 0.13 ± 0.01 0.13 ± 0.01 0.13 ± 0.02 1.0 0.2 0.4 TEE (MJ/d) 10.8 ± 2.1 10.7 ± 1.6 11.6 ± 3.3 12.8± 3.5 0.2 0.3 0.4 TEE/FFM (MJ/d/kg) 0.21 ± 0.04 0.21 ± 0.02 0.22 ± 0.03 0.24 ± 0.03 0.14 0.4 0.2 AEE (MJ/d) 4.16 ± 1.8 4.10 ± 0.82 5.02 ± 2.4 5.95 ± 2.9 0.14 0.5 0.4 AEE/FFM (MJ/kg) 0.09 ± 0.04 0.08 ± 0.01 0.09 ± 0.03 0.11 ± 0.04 0.2 0.6 0.3 PAL (TEE/RMR) 1.64 ± 0.26 1.62 ± 0.09 1.76 ± 0.27 1.86 ± 0.38 0.09 0.7 0.5 Mean ±SD
Figure 4. Waking sitting, standing, stepping and doubly-labelled water-derived total energy expenditure (TEE), before (PRE) and during the last two weeks of a 4-week intervention (POST) consisting of either nine 5-min brisk walking bouts per day, 5 d/wk (n=9, MICRO) or of 45-min brisk walking performed once per day, 5 d/wk (n=10, ONE).
** 1 MICRO and 2 ONE group participants were excluded from this data set due to inability to analyze doubly labeled water data
Group: p=0.2 Intervention: p=0.3 Grp x Intervent: p=0.4 Group: p=0.8 Intervention: p=0.02 Grp x Intervent: p=0.3 Group: p=0.6 Intervention: p=0.2 Grp x Intervent: p=0.9 Group: p=0.3 Intervention: p=0.7 Grp x Intervent: p=0.08
3.3 Daily Glycemic Variability
Data obtained over 14 days from the CGMS in pre and during the last two weeks of the intervention are provided in Table 3. No between-group differences at baseline were observed. Mean, SD, MAGE, and CONGA did not differ between the groups. Intervention-by-group interactions were observed for SD, MAGE, and CONGA (p<0.1 for all). While MICRO decreased SD from 0.95 ±0.28 to 0.81±0.21 mg/dl, ONE increased SD from 0.78±0.14 to 0.81±0.16 (p=0.06). MICRO decreased MAGE from 2.4±0.9 to 2.0±0.5, ONE increased MAGE from 1.9±0.5 to 2.2±0.5 (p=0.03). MICRO increased CONGA from 3.9±0.4 to 4.3±0.7, ONE decreased CONGA from 4.2±0.6 to 4.0±0.7 (p=0.07). Daily mean glucose was not modified by either of the active interventions.
Table 3. Effects of 4 weeks of MICRO versus ONE on 24hr glycemia measured by CGMS
MICRO ONE Grou
p effect Interventi on effect Group-by-Interventi on effect
PRE POST PRE POST
n 9 9 9 9 Mean glucose (mg/dl) 4.7 ± 0.44 5.0 ± 0.78 4.9 ± 0.60 4.7 ± 0.79 0.9 1 0.12 SD (mg/dl) 0.95 ± 0.28 0.81 ± 0.21 0.78 ± 0.14 0.81 ± 0.16 0.3 0.2 0.06 MAGE 2.4 ± 0.89 2.0 ± 0.49 1.9 ± 0.45 2.2 ± 0.51 0.6 0.3 0.03 CONGA 3.9 ± 0.44 4.3 ± 0.69 4.2 ± 0.55 4.0 ± 0.66 0.9 0.8 0.07
Mean ±SD , Standard deviation (SD), mean amplitude of glucose excursions (MAGE), continuous overall net glycemic action (CONGA)
3.4 Insulin Sensitivity
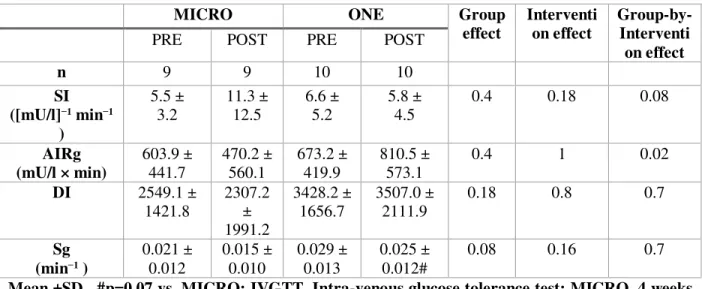
Data from the IVGTT are reported in Table 4. No between-group differences at baseline were observed. No group effect was observed in SI, AIRg and DI. Intervention-by-group interaction were observed for SI (p=0.08) and AIRg (p=0.02). While MICRO increased SI from 5.5 (±3.2) [mU/l]−1 min−1 to 11.3 (±12.5) , ONE decreased SI from 6.6 (±5.2) to 5.8 (±4.5). While MICRO increased AIRg from 603.9 (441.7) mU/l × min to 470.3 (±560.1) , ONE decreased AIRg from 673.2 (±419.9) to 810.5 (±573.1). None of the physical activity interventions modified DI. Although the activity interventions did not change Sg, it tended to be lower in MICRO than in ONE (group effect: p=0.08) across the intervention period.
Table 4. Effects of 4 weeks of MICRO versus ONE on whole body insulin sensitivity measured by IVGTT
MICRO ONE Group
effect Interventi on effect Group-by-Interventi on effect
PRE POST PRE POST
n 9 9 10 10 SI ([mU/l]−1 min−1 ) 5.5 ± 3.2 11.3 ± 12.5 6.6 ± 5.2 5.8 ± 4.5 0.4 0.18 0.08 AIRg (mU/l × min) 603.9 ± 441.7 470.2 ± 560.1 673.2 ± 419.9 810.5 ± 573.1 0.4 1 0.02 DI 2549.1 ± 1421.8 2307.2 ± 1991.2 3428.2 ± 1656.7 3507.0 ± 2111.9 0.18 0.8 0.7 Sg (min−1 ) 0.021 ± 0.012 0.015 ± 0.010 0.029 ± 0.013 0.025 ± 0.012# 0.08 0.16 0.7
Mean ±SD , #p=0.07 vs. MICRO; IVGTT, Intra-venous glucose tolerance test; MICRO, 4 weeks of microbouts of activity (9 bouts of 5-min brisk walking, 5 d/wk); ONE, 4 weeks of single continuous 45-min of brisk walking (5d/wk)
3.5 Metabolic Flexibility and Substrate Utilization
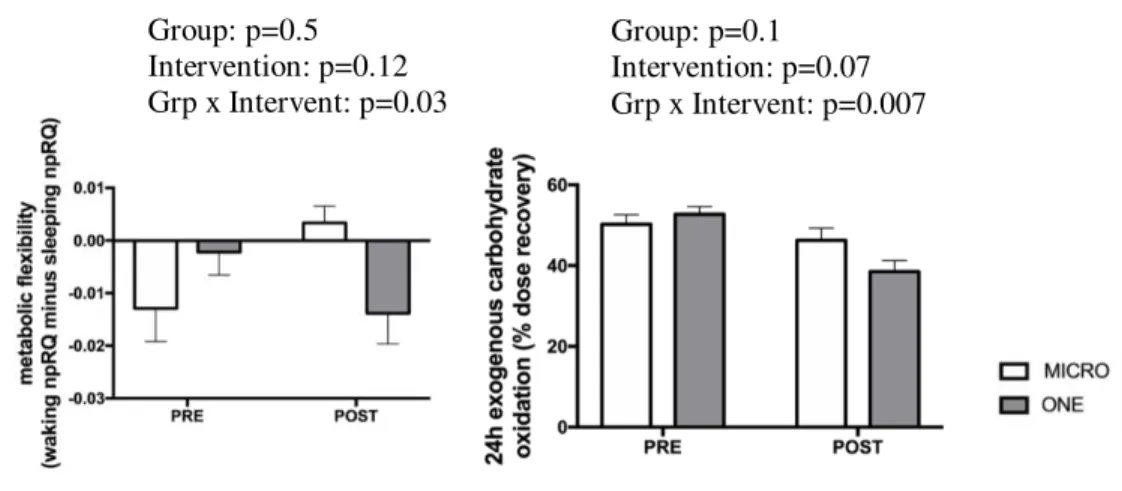
No between-group difference was observed at baseline. A group-by-intervention interaction was observed for the index of metabolic flexibility, i.e. delta between day npRQ and night npRQ; while it increased in MICRO, it did not change in ONE (p=0.03; Figure 5). While MICRO (post: 59.5±7.0% versus pre: 46.3±8.9% recovery of ingested dose) maintained 24h exogenous
carbohydrate oxidation at baseline levels, ONE decreased it (post: 59.9±5.4% versus pre: 50.4±7.8% recovery of ingested dose; group-by-intervention interaction: p=0.007).
Figure 5. Effect of 4 weeks of microbouts of activity (MICRO, n=9) vs single continuous bouts of activity (ONE, n=10) matched for total active time (45-min), on 24h exogenous carbohydrate oxidation and metabolic flexibility in overweight/obese adults.
Group: p=0.5 Intervention: p=0.12 Grp x Intervent: p=0.03 Group: p=0.1 Intervention: p=0.07 Grp x Intervent: p=0.007
4. DISCUSSION
In this longitudinal randomized intervention study, we showed that four weeks of frequent interruptions of sedentary time with short bouts of brisk walking performed each hour for nine consecutive hours reduce glycemic variability, improve whole body insulin sensitivity, and improve metabolic flexibility to a greater extent than four weeks of intervention consisting of a single bout of brisk walking matched for total active time. Importantly, these differential metabolic responses were observed while both interventions had similar impact on the pattern of physical activity, i.e. increase in time spent stepping and MVPA, decrease in time spent sitting and light-intensity activity, and no change in AEE or TEE. These results indicate that the beneficial effects of breaking up sedentary behaviors are independent of changes in time spent active and sedentary or changes in energy expenditure.
Our study measured free living blood glucose concentration and fluctuations over the course of 14 days using constant blood glucose monitoring systems prior to and in the final two weeks of the exercise intervention. We found that frequent brisk walking bouts spread
throughout the day decrease glycemic variability over 24 hours when compared to the
performance of a single continuous bout of brisk walking. Blankenship et al. also used constant glucose monitoring systems to study frequent bouts of physical activity in adults with type 2 diabetes. They found that when active time was matched to 30-minutes, breaks from sitting with moderate intensity walking bout were more effective at decreasing glycemic variability28 than the performance of moderate intensity walking as a continuous bout. One of the benefits to constant glucose monitoring systems is the ability to examine glucose values and changes in free-living conditions, during rest days, and during sleeping hours. Dempsey et al. used this
monitoring system to examine the effects of glucose values in type 2 diabetics after completing a seven hour intervention of either 3 minutes of walking every 30 minutes, 3 minutes of resistance exercise every 30 minutes, or sedentary for 7 hours, and continued to monitor them for a total of 22 hours. They found that the repeated walking bouts and resistance exercises significantly decreased blood glucose during nocturnal hours compared to the sedentary control, showing that this type of intervention has acute lasting effects that limit the episodes of hyperglycemia in type 2 diabetics 5. Our study however didn’t show any significant decrease in mean blood glucose during wake or sleep times (data not shown) meaning maybe it is a temporary effect that dissipates with an intervention as long as ours. Importantly, our data took into account both the days during which participants performed the intervention but also the days during which they did not. Future analysis will have to only consider only the “active days” to examine the effect of the interventions on mean blood glucose. The decrease in glycemic variability with the
microbouts of activity may therefore be even more pronounced when only looking at the active days. This has important clinical implications because high fluctuations of glycemia is a
recognized risk factor for type 2 diabetes and cardiovascular disease 8.
Although no change in mean glycemia was detected over 24h (day or night), we observed a decrease in post prandial glucose concentration (data not shown) in response to standard
breakfast, lunch and dinner. This result is in line with an increasing number of intervention that observed a decrease in postprandial glycemia in response to an acute exposure to the breaks11,28– 30. Importantly, our data suggests that breaking up sedentary behaviors improves glucose control not only acutely, but also when participants are resting, after 4 weeks of intervention. We
recently showed that the decrease in post-prandial glycemic variability induced by 4 days of breaking was associated with a greater use of carbohydrate oxidation for 24 hours11. Here we did
not observe an increase in 24h total carbohydrate oxidation (data not shown), but a maintenance of 24h exogenous carbohydrate oxidation, contrary to the performance of 4 weeks of continuous bout of brisk walking that decreased it. De Jong attributed this effect to the fact that bouts of activity are effective at training the body to preferentially use glucose as they believe the reason to be that glycogen at the skeletal muscle was being utilized due to increased translocation of the GLUT4 transporter which triggered uptake and oxidation of glucose11. Once again, it is
important to note that this greater use of dietary carbohydrate as fuel was observed when subjects were rested, and not exercising, suggesting that other adaptations come at play going beyond the translocation of the GLUT4 transporter to facilitate glucose uptake. In addition, the frequent bout group had an improved metabolic flexibility compared to the single bout. This means that they were essentially utilizing carbohydrates as substrates during the feeding/waking hours (npRQ closer to 1.0) but mainly relied upon fat as fuel during sleeping/fasting hours (npRQ closer to 0.7). In previous study, our group showed that physical inactivity induced by bed rest trigger the development of metabolic inflexibility, which precedes the development of glucose intolerance. Our present data suggest that the lack of frequent muscle contraction, use of energy or use of carbohydrate contribute to this metabolic inflexibility rather than physical inactivity per se, i.e. fact of not reaching the recommended level of physical activity. Future studies will be warranted to confirm this hypothesis.
Understanding effective ways to treat metabolic inflexibility is important as it is a common characteristic of type 2 diabetics, insulin resistance, obesity, and metabolic syndrome. Here we observed a positive correlation between the 4-week changes in whole-body metabolic flexibility and in insulin sensitivity. The directionality between the two however remains unknown, and will need to be investigated. Our study showed that frequent bouts of physical activity improve
whole body insulin sensitivity as well as in the acute insulin response to glucose in
overweight/obese adults in a greater extent than what is observed when physical activity us performed as a single continuous bout. This is in line with the observations from other studies of the acute effects of breaking up sedentary behavior on post prandial insulinemia which suggests an improvement in insulin sensitivity with breaking up sedentary behavior31,28. In this line, our study also showed improved insulin sensitivity post prandially (data not shown).
While there are many valid ways measure insulin sensitivity, our study used IVGTTs, however the choice to not use an hyperinsulinemic euglycemic clamp or oral glucose tolerance test (OGTT) did come with downfalls, as each test has it’s own variety of pros and cons. While a hyperinsulinemic euglycemic clamp is technically the “gold standard” for measuring insulin sensitivity, and has the ability to show tissue-specific changes in insulin sensitivity32, the IVGTT is a shorter test at around 4 hours total compared to around 7 hours of a clamp. IVGTTs are also less costly were within the scope of funding for this study, and do not require a physician present (making participant scheduling easier and compliance better). They are validated against the hyperinsulinemic clamp when using the Minimal Model program for analysis 27. Another validated method that could have been used and had outcomes that the IVGTT did not was the OGTT. This test is also less costly than a glucose clamp, and is also more effective at classifying participants into diabetic or normal as the estimated efficiency of glucose disposal rates is better shown with OGTTs with participants with mild glucose tolerance abnormalities when compared to the IVGTT. The IVGTT was chosen over this however as when it is paired with minimal model, it still gives a valid insulin sensitivity value as well as the DI and AIRG which the OGTT does not.
The improvement in AIRg suggest that frequent bouts of physical activity lead to an acute release of insulin in response to exogenous glucose load when compared to the single bout group. The reasons for this remain unknown but there are two hypothesis, either (1) a better pancreatic function leading to a quick insulin secretion or (2) the presence of insulin in the beta cell ready to be quickly released into the blood stream. To determine this mechanism, future studies will need to test the effects of breaking up sedentary behavior on beta cell function by using a stepwise glucose tolerance test in which c-peptide is measured.
A major strength of this study was the randomized controlled trial and the study for the first time of the sustained effects of breaking up sitting time. It also included use of a 24 hr whole room calorimeter and 3 day run in diet, as well as using active-time matched controls. Our
limitations include the fact that there was a lack of beneficial changes shown in the single bout group. However, we believe that this is due to the fact that this group did not increase their overall total energy expenditure. We believe that because they adopted exercise into their daily routine, they were inadvertently doing less physical activity during the rest of the waking hours. Other limitations include the fact that some participants either gained or lost weight throughout the study rather than remaining weight stable, which could have affected our main outcomes. With this being said, while there were changes in individuals (weight gain and weight loss), there were no significant differences on average in body weight or fat mass in neither group. While there is not enough statistical power with our 19 participants currently to run post-hoc tests to determine the pre/post changes in each group and the between-group differences in post. However, upon completion of the study, changes in energy balance, body weight, and body composition will be taken into account in the definitive statistical analysis. IVGTTs were also conducted at 0700 for each participant, however recent studies have shown that insulin
sensitivity is associated with circadian rhythms and therefore the tests should have been
conducted in relation to each of the participants natural wake time33. Finally, when determining 24 hour energy intake to feed the participants in their 3 day run in diet and the chamber, we had to multiply RMR with an activity factor. This activity factor was estimated based on pedometers, ActivPAL, IPAQ, but was not objectively measured. Applying an activity factor of 1.5 or 1.6 automatically induce a 10% difference in energy intake and potentially energy balance, which can also affect the results.
Conclusions and future perspectives
In conclusion, we showed that 4 weeks of microbouts of physical activity result in decreased 24hr glycemic variability, which is associated with improved metabolic flexibility, high levels of exogenous carbohydrate oxidation, and increased whole-body insulin sensitivity, compared to the performance of 4 weeks of single continuous bout of brisk walking matched for total active time. It is important to note however that these findings are specific to sedentary overweight and obese adults and is aiming to find an intervention that can compare to the traditional exercise recommendations of 150 minutes of MVPA, not be overall better. The number one indicator of premature death is lack of cardiorespiratory fitness34 and our frequent bouts of physical activity does not increase this, however for some of the US population, our intervention could be effective to combat common barriers of to exercise (time, knowledge, enjoyability, etc), and be better than nothing at all. It is also designed specifically with
individuals who have high glycemia, and would be used as an intervention specific to this issue rather than a normal or healthy individual. Ideally, we believe that the perfect intervention for health of our study population and the general public would be breaking up sedentary behavior
with the addition of 150 minutes of MVPA. Future studies will be needed to further our understanding of the health effect of physical activity interventions varying in terms of dose, timing, duration, etc, so that more specific guidelines on physical activity will be developed. In addition, future research should also be conducted to help determine the most effective way to implement frequent bouts of exercise into daily life. It’s been shown that even when reaching 150 minutes of moderate to vigorous physical activity, it does not protect an individual from cardiometabolic risk factors if they are sedentary otherwise10; while we and others have shown that breaking up sedentary behavior is beneficial on these same biomarkers 6,11,35. However, the minimum amount of time active in order to offset sedentary behavior still remains unknown. Determining this, or the maximum amount of time that one can remain sedentary until walking without having detrimental health outcomes, would provide extremely valuable knowledge for public health and clinical purposes and the ACSM physical activity guidelines could be made more specific.
WORKS CITED
1. Bhupathiraju SN, Hu FB. Epidemiology of Obesity and Diabetes and Their Cardiovascular Complications. Circ Res. 2016;118(11):1723-1735. doi:10.1161/CIRCRESAHA.115.306825
2. FastStats - Overweight Prevalence. https://www.cdc.gov/nchs/fastats/obesity-overweight.htm. Accessed May 7, 2019.
3. New CDC report: More than 100 million Americans have diabetes or prediabetes | CDC Online Newsroom | CDC. https://www.cdc.gov/media/releases/2017/p0718-diabetes-report.html. Accessed May 7, 2019.
4. Tremblay MS, Aubert S, Barnes JD, et al. Sedentary Behavior Research Network (SBRN) – Terminology Consensus Project process and outcome. Int J Behav Nutr Phys Act. 2017;14(1):75. doi:10.1186/s12966-017-0525-8
5. Dempsey PC, Blankenship JM, Larsen RN, et al. Interrupting prolonged sitting in type 2 diabetes: nocturnal persistence of improved glycaemic control. Diabetologia. 2017;60(3):499-507.
doi:10.1007/s00125-016-4169-z
6. Bergouignan A, Rudwill F, Simon C, Blanc S. Physical inactivity as the culprit of metabolic inflexibility: evidence from bed-rest studies. J Appl Physiol. 2011;111(4):1201-1210. doi:10.1152/japplphysiol.00698.2011
7. Flatt JP, Ravussin E, Acheson KJ, Jéquier E. Effects of dietary fat on postprandial substrate oxidation and on carbohydrate and fat balances. J Clin Invest. 1985;76(3):1019-1024. doi:10.1172/JCI112054
8. Suh S, Kim JH. Glycemic Variability : How Do We Measure It and Why Is It Important ? 2015:273-282.
9. Tucker JM, Welk GJ, Beyler NK. Physical Activity in U.S. Adults. Am J Prev Med. 2011;40(4):454-461. doi:10.1016/j.amepre.2010.12.016
10. Healy GN, Matthews CE, Dunstan DW, Winkler EAH, Owen N. Sedentary time and cardio-metabolic biomarkers in US adults: NHANES 2003–06. Eur Heart J. 2011;32(5):590-597. doi:10.1093/eurheartj/ehq451
11. De Jong NP, Rynders CA, Goldstrohm DA, et al. Effect of frequent interruptions of sedentary time on nutrient metabolism in sedentary overweight male and female adults. J Appl Physiol.
2019;126(4):984-992. doi:10.1152/japplphysiol.00632.2018
12. Peddie MC, Bone JL, Rehrer NJ, Skeaff CM, Gray AR, Perry TL. Breaking prolonged sitting reduces postprandial glycemia in healthy, normal-weight adults: a randomized crossover trial. Am
J Clin Nutr. 2013;98(2):358-366. doi:10.3945/ajcn.112.051763
13. Duvivier BMFM, Schaper NC, Hesselink MKC, et al. Breaking sitting with light activities vs structured exercise: a randomised crossover study demonstrating benefits for glycaemic control and insulin sensitivity in type 2 diabetes. Diabetologia. 2017;60(3):490-498. doi:10.1007/s00125-016-4161-7
14. HHS. Physical Activity Guidelines for Americans 2 Nd Edition.
https://health.gov/paguidelines/second-edition/pdf/Physical_Activity_Guidelines_2nd_edition.pdf. Accessed February 5, 2019.
15. R: The R Project for Statistical Computing. https://www.r-project.org/. Accessed March 12, 2019.
16. KOZEY-KEADLE S, LIBERTINE A, LYDEN K, STAUDENMAYER J, FREEDSON PS. Validation of Wearable Monitors for Assessing Sedentary Behavior. Med Sci Sport Exerc. 2011;43(8):1561-1567. doi:10.1249/MSS.0b013e31820ce174
Wearable Monitors to Estimate Breaks from Sedentary Time. Med Sci Sport Exerc. 2012;44(11):2243-2252. doi:10.1249/MSS.0b013e318260c477
18. Bergouignan A, Momken I, Schoeller DA, et al. Regulation of Energy Balance during Long-Term Physical Inactivity Induced by Bed Rest with and without Exercise Training. J Clin Endocrinol
Metab. 2010;95(3):1045-1053. doi:10.1210/jc.2009-1005
19. Blanc S, Normand S, Pachiaudi C, Fortrat J-O, Laville M, Gharib C. Fuel Homeostasis during Physical Inactivity Induced by Bed Rest 1. J Clin Endocrinol Metab. 2000;85(6):2223-2233.
doi:10.1210/jcem.85.6.6617
20. Blanc S, Schoeller DA, Bauer D, et al. Energy requirements in the eighth decade of life. Am J Clin
Nutr. 2004;79(2):303-310. doi:10.1093/ajcn/79.2.303
21. Melanson EL, Gozansky WS, Barry DW, MacLean PS, Grunwald GK, Hill JO. When energy balance is maintained, exercise does not induce negative fat balance in lean sedentary, obese sedentary, or lean endurance-trained individuals. J Appl Physiol. 2009;107(6):1847-1856. doi:10.1152/japplphysiol.00958.2009
22. Zahariev A, Bergouignan A, Caloin M, et al. Skinfold thickness versus isotope dilution for body fat assessment during simulated microgravity: results from three bed-rest campaigns in men and women with and without countermeasures. Eur J Appl Physiol. 2005;95(4):344-350.
doi:10.1007/s00421-005-0021-8
23. Rawlings RA, Shi H, Yuan L-H, Brehm W, Pop-Busui R, Nelson PW. Translating glucose variability metrics into the clinic via Continuous Glucose Monitoring: a Graphical User Interface for Diabetes Evaluation (CGM-GUIDE©). Diabetes Technol Ther. 2011;13(12):1241-1248. doi:10.1089/dia.2011.0099
and Dietary Fat Oxidation in Lean, Obese and Reduced-Obese Adults with and without a Bout of Exercise. Moro C, ed. PLoS One. 2014;9(4):e94181. doi:10.1371/journal.pone.0094181
25. Melanson EL, Ingebrigtsen JP, Bergouignan A, Ohkawara K, Kohrt WM, Lighton JRB. A new approach for flow-through respirometry measurements in humans. Am J Physiol Integr Comp
Physiol. 2010;298(6):R1571-R1579. doi:10.1152/ajpregu.00055.2010
26. Marangou AG, Alford FP, Ward G, et al. Hormonal effects of norepinephrine on acute glucose disposal in humans: A minimal model analysis. Metabolism. 1988;37(9):885-891.
doi:10.1016/0026-0495(88)90124-2
27. Bergman RN. Minimal Model: Perspective from 2005. Horm Res. 2005;64(3):8-15. doi:10.1159/000089312
28. Blankenship JM, Granados K, Braun B. Effects of subtracting sitting versus adding exercise on glycemic control and variability in sedentary office workers. Appl Physiol Nutr Metab.
2014;39(11):1286-1293. doi:10.1139/apnm-2014-0157
29. Dunstan DW, Kingwell BA, Larsen R, et al. Breaking Up Prolonged Sitting Reduces Postprandial Glucose and Insulin Responses. Diabetes Care. 2012;35(5):976-983. doi:10.2337/dc11-1931
30. Larsen RN, Kingwell BA, Robinson C, et al. Breaking up of prolonged sitting over three days sustains, but does not enhance, lowering of postprandial plasma glucose and insulin in overweight and obese adults. Clin Sci. 2015;129(2):117-127. doi:10.1042/CS20140790
31. Bailey DP, Partonen T, Tremblay A, et al. Benefits of Substituting Sitting with Standing and Walking in Free-Living Conditions for Cardiometabolic Risk Markers, Cognition and Mood in Overweight Adults. Front Physiol | www.frontiersin.org. 2017;1:353.
doi:10.3389/fphys.2017.00353
J Endocrinol Metab. 2015;19(1):160. doi:10.4103/2230-8210.146874
33. Basse AL, Dalbram E, Larsson L, Gerhart-Hines Z, Zierath JR, Treebak JT. Skeletal Muscle Insulin Sensitivity Show Circadian Rhythmicity Which Is Independent of Exercise Training Status. Front Physiol. 2018;9:1198. doi:10.3389/fphys.2018.01198
34. Lee D, Artero EG, Sui X, Blair SN. Mortality trends in the general population: the importance of cardiorespiratory fitness. J Psychopharmacol. 2010;24(4 Suppl):27-35.
doi:10.1177/1359786810382057
35. Bergouignan A, Kealey EH, Schmidt SL, Jackman MR, Bessesen DH. Twenty-Four Hour Total and Dietary Fat Oxidation in Lean, Obese and Reduced-Obese Adults with and without a Bout of Exercise. Moro C, ed. PLoS One. 2014;9(4):e94181. doi:10.1371/journal.pone.0094181