Performance of Actively Managed
Equity Mutual Funds
Empirical Evidence of the Swedish Market
Master’s Thesis within Business Administration
Author: Paulius Dijokas
Dijana Zaric
Tutor: Ph.D. Jan Weiss
Master’s Thesis in Business Administration
Title: Performance of Actively Managed Equity Mutual Funds: Empirical Evi-dence of the Swedish Market
Author: Paulius Dijokas and Dijana Zaric
Tutor: Jan Weiss
Date: 2015-05-11
Subject terms: Equity mutual funds’ performance, efficient market hypothesis, Fama-French three factor model, net and gross excess returns
Abstract
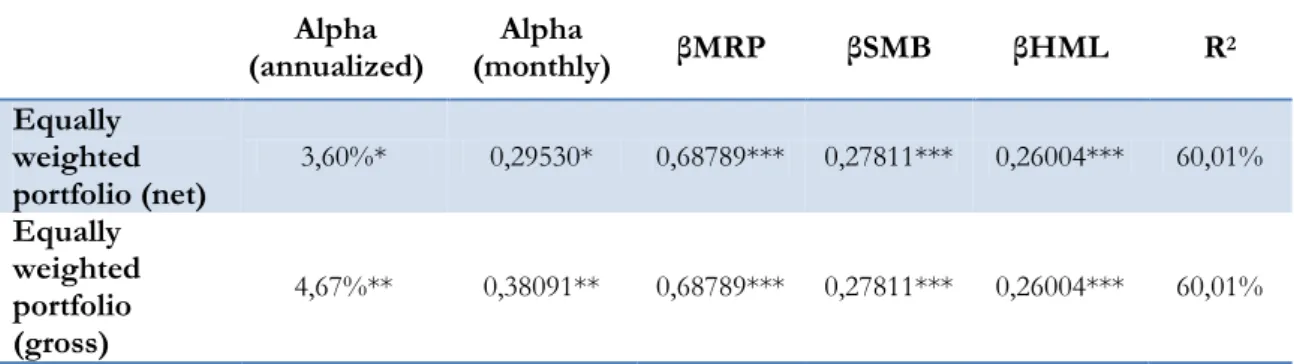
During the last decade, investments into the Swedish mutual fund market have increased substantially. The increased popularity of actively managed Swedish equity funds among households and investment companies, correspondingly, funds need to deliver substantial results, raised the importance to evaluate these funds’ performance. This thesis adds to the scarce empirical literature on Swedish equity mutual fund performance. Employing the Fama-French three factor model, it analyzes whether actively managed Swedish equity mu-tual funds outperform the Fama-French benchmarks net- and gross of management fees. The study uses time-series data and constructs equally-weighted portfolios of the 42 Swe-dish based actively managed equity mutual funds investing in Sweden for the period 2003-2013. The portfolios’ excess returns are calculated by estimating the Fama-French three factor model by means of ordinary least squares (OLS) regression analysis. The empirical results show that actively managed equity mutual funds over performed the Fama-French three factor benchmarks by an average annualized net- and gross excess return of 3.60 and 4.67 percent respectively. Sorting out the funds by the performance into deciles, the find-ings indicate that management fees influence the performance of the equity mutual funds in the sample of our study. The conclusion is made such that there is an indication that Swedish equity funds’ managers are able to add value above passive investing.
Acknowledgements
We would like to thank our supervisor Jan Weiss. His great knowledge, dedication and ad-vice was of great support in writing this thesis. Furthermore, we would like to thank those who have contributed with their time to read, comment and give improvements to the writing of this thesis. Lastly, we would like to thank our fellow students who have contri-buted with their opinions on improving the thesis.
______________________ ______________________
Paulius Dijokas Dijana Zaric
Table of Contents
1
Introduction ... 1
1.1 Background ... 1
1.2 The Swedish mutual fund industry ... 2
1.3 Problem statement ... 3
1.4 Purpose ... 4
1.5 Limitations ... 4
1.6 Organization of the thesis ... 4
2
Frame of References ... 5
2.1 Equity mutual funds ... 5
2.2 Active management ... 5
2.3 Modern portfolio theory ... 5
2.4 Capital asset pricing model ... 6
2.4.1 Jensen’s alpha ... 8
2.5 Efficient market hypothesis ... 8
2.6 Modified efficient market hypothesis ... 9
2.7 Multi-Factor models ... 10
2.8 Fama-French three factor model ... 11
2.8.1 Market risk premium ... 11
2.8.2 The Size factor and the Value factor ... 12
2.9 Previous research ... 13
3
Methodology ... 16
3.1 Research methods ... 16 3.2 Selection of funds ... 17 3.2.1 Time period ... 17 3.2.2 Data ... 173.2.3 Impact on survivorship bias ... 19
3.3 Presentation of the model ... 19
3.4 Explanatory variables ... 20 3.4.1 MRP ... 20 3.4.2 SMB and HML ... 20 3.5 Dependent variable ... 22
4
Empirical results ... 23
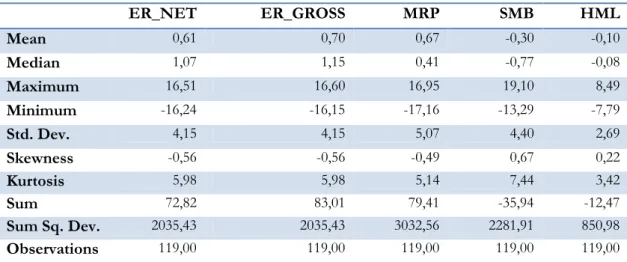
4.1 Descriptive statistics ... 234.2 Output of the regression model ... 25
5
Analysis... 28
6
Conclusion and discussion ... 30
Figures
Figure 2-4 Security market line ...7
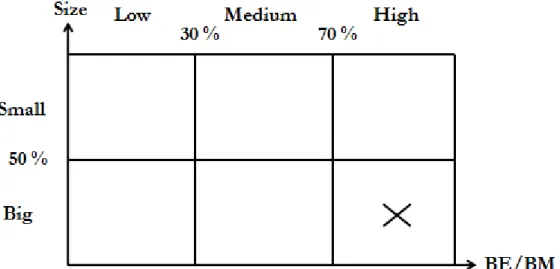
Figure 3-4-2a Sorting by size (X is the stock in the big group)... 21
Figure 3-4-2b Sorting by book-to-market ratio (X is a stock in the high group) ... 21
Figure 3-4-2c Sorting by book-to-market ratio and size (X is a stock and presented here in one size and BE/BM portfolio) ... 21
Figure 4-1a Distribution of the variables ... 24
Figure 4-1b Statistics of the variables ... 24
Tables
Table 4-1 Descriptive statistics ... 23Table 4-2a Net and gross excess returns (net and gross alphas) for equity mutual funds ... 25
Table 4-2b Net excess returns (net alphas) for equity mutual funds by decile ... 26
Table 4-2c Equally-weighted net excess returns (net alphas) by year ... 26
Table 4-2d Gross excess returns (gross alphas) for equity mutual funds by decile ... 27
Appendix
Appendix 1 ... 36 Appendix 2 ... 37 Appendix 3 ... 40 Appendix 4 ... 43 Appendix 5 ... 44 Appendix 6 ... 45 Appendix 7 ... 461
Introduction
In recent time, investments into the Swedish mutual fund market have increased substan-tially. The total net funds’ assets accounted for SEK 3000 billion by the end of 2014. The increase in value of the funds made up to SEK 521 billion for the year 2014. Of the total net funds’ assets, SEK 1669 billion are invested into equity mutual funds in Sweden which is corresponding to 56 percent of the total net funds’ assets (The Swedish Investment Fund Association, 2014).
According to the Swedish Supervisory Authority, the mutual funds registered in Sweden are binded to invest at least 75 percent of their assets in Swedish or foreign stocks based by the type of their strategy (Swedish Financial Supervisory Statutes, 2008:11). Equity mutual funds can be managed using two types of management activities known as active or passive management (Elton, Gruber, Brown & Goetzmann, 2011). The passively managed funds are the ones that follow a specific market index such as index funds.The goal of the funds that apply an active management is to outsmart the market and produce better perfor-mance in comparison with the market index by seeking for undervalued securities. By ex-ploiting the active management, mutual funds take a yearly management fee from the in-vestors for the mutual fund managers’ active work for searching for these undervalued se-curities (Elton et al., 2011).
Nevertheless, the ability of mutual fund managers to outsmart the market is not in line with the efficient market hypothesis. The hypothesis states that stock market are efficient and that all relevant information is already included into the stock price. The theory entails the belief that it is impossible for investors to purchase undervalued stocks and outperform the market (Malkiel, 1999). Hence, the aim of this study is to evaluate the Swedish-based equity mutual funds’ performance in the Swedish market and to see if the Swedish fund managers are able to outsmart the market and generate excessive returns for the investors.
1.1
Background
Mutual funds are defined as the investment tools which are formed by collecting money from investors with the goal to invest this money into different types of securities (North-cott, 2009). Buying shares in a mutual fund makes the investor an indirect owner and shareholder in that fund’s investments. There are many types of mutual funds which an in-vestor can choose from. For instance, the inin-vestor can invest in money market funds, growth funds, equity funds, value funds, income funds, bond funds and international funds, to name a few. Equity funds represent the biggest part of the mutual funds and are funds that invest in securities that are based on an ownership such as stocks (Northcott, 2009). In contrast to equity funds, bond funds are based on debt and their goal is to pro-vide current income on a stable basis. The most common type of mutual funds are open-end funds. This means that the fund can sell shares at any time without unnecessary restric-tions; the fund is ‖open‖ to new investments. If the open-end fund has a lot of people in-vesting in it, the increase in the total amount invested may decrease the cost of manage-ment. On the other hand, closed-end funds are restricted in the way that there are a fixed number of shares in the fund (Northcott, 2009).
There has been a huge interest into mutual funds market from the investor perspective for several decades. Investors are investing their money mainly into equity mutual funds in or-der to gain profit. The big interest into mutual funds market raises questions for academics about how these funds perform in comparison with some benchmarks. This creates a base to investigate the performance of mutual funds and answer the question if it is really
effi-cient to load money into this type of funds. In order to do so, academics use different techniques to achieve this goal. Early studies on mutual funds’ performance were using dif-ferent benchmarks that are based on single-factor measures such as Sharpe ratio by Sharpe (1966) and Jensen’s alpha by Jensen (1967) (Elton et al., 2011). These measures are all based on a single factor model, the Capital Asset Pricing Model (hereinafter, CAPM). Later studies were conducted on employing the more complex techniques which are defined as multi-factor models. The most widely used multi-factor model is called Fama-French three factor model (hereinafter, FF3FM) developed by Fama and French (1993). Moreover, the extensions of this model appeared (see Carhart, 1997) including additional factors. How-ever, the FF3FM is the most widely used in measuring mutual funds’ performance due to its strong evidence related to size and book-to market factors (Elton et al., 2011). The main idea of employing the FF3FM is due to the suggestion that there could be types of assets held in the managed portfolios which are not contained in the benchmark. In that case, the mutual fund could perform differently than the benchmark. By using only one-factor model, the interpretation of the results could be doubtful since one could not be sure if the performance is due to the manager’s ability to select securities or due to the category from which securities are being selected which is not in the index possessing superior or inferior performance in comparison to the index (Elton et al., 2011).
1.2
The Swedish mutual fund industry
In the past years, the mutual fund industry in Sweden has grown rapidly. The development of the Swedish mutual fund market goes all the way to the 1950’s, when the first mutual funds were launched. The source of inspiration came from the US, where savings in funds had increased rapidly in the 1940’s. However, people got interested in investing in mutual funds when the government in 1978 introduced a tax-deductable saving policy for funds investments along with a rising stock market in the 1980’s. There were some changes to the tax-saving policy until it was completely abolished in 1997 (The Swedish Investment Fund Association, 2011). A new pension system was launched in 1994, where 2.5% of the salary is saved for retirement. Here, one can choose actively from a selection of funds to invest in. However, if no active choice is made, the money goes directly to a specific equity mu-tual fund (The Swedish Investment Fund Association, 2011).
When the Swedish Investment Fund Association was founded in 1979, there were only 17 funds with the total net assets of SEK 1 million. In the beginning of 1995, the industry had a total of net assets that accounted for an amount of SEK 207 billion (Engström, 2004). In the study by the Swedish Investment Fund Association (2014), they conclude that no other country in the world has more people saving in mutual funds as in Sweden. Eight out of every ten people in Sweden have savings in mutual funds in addition to the fund-based premium-pensions savings. If the premium-pension savings are included, all people in Sweden are fund-savers. One third of the financial wealth of households in Sweden, where the pension represents a large part, is a fund-based. Approximately one fourth of all the people consider the historical return as very important, whereas one half of the people con-sider it to be quite important. Three out of ten people compares and evaluates their in-vestment with the stock market performance and 17 percent of the people evaluate against another index that is comparable with the fund itself. The study also shows that over 50 percent of all the people use advisor recommendations for making decisions about their mutual funds’ investments (The Swedish Investment Fund Association, 2014).
In present day, the total of the funds’ net assets makes up to over SEK 3000 billion in Sweden, an increase with more than SEK 520 billion over the year of 2014. The net total of
SEK 153 billion were invested in funds in Sweden in the period of 2014. Out of this, the inflows of equity funds represent nearly SEK 10 billion (The Swedish Investment Fund Association, 2014). In the end of 2014, net assets of equity mutual funds constitute 56 per-cent of the total net assets in funds in Sweden. In addition, the Swedish-based equity mu-tual funds made up to about 46 percent in the same period of the total net assets in funds in Sweden. This confirms the huge popularity between households and investment compa-nies of investing in the equity mutual funds in Sweden and the importance for these funds to deliver excessive results (The Swedish Investment Fund Association, 2014).
Mutual funds have received an important role as a part of the future savings for people in Sweden. The individual investor can participate in the mutual funds market without getting involved in the stock market himself, by the help of a manager to actively manage the eq-uity mutual fund. With growing importance of the eqeq-uity mutual funds market, affecting the vast majority of the population in Sweden, the need for evaluation of its performance may have never been greater. The following section will present a summary of what previ-ous research have found regarding the ability of equity mutual funds to over perform the market.
1.3
Problem statement
Previous research studies on this topic finds various results regarding the ability of equity mutual funds to over perform the market. Most of the empirical researches are conducted in the U.S mutual funds market, and most of which support the efficient market hypothesis (Flam & Vestman, 2014). The efficient market hypothesis states that stock markets are effi-cient, implying that all information that is available is already incorporated into the stock prices (Malkiel, 1999). This implies that the ability to generate superior return and outper-form the market is not in line with the efficient market hypothesis (Ippolito, 1993). The U.S studies show an average yearly excess return that is negative when deducting fees of management (Sharpe, 1966; Jensen, 1967; Elton, Gruber, Das & Hlavka, 1993; Elton, Gru-ber & Blake, 1996; Carhart, 1997; Pastor & Stambaugh, 2002; Elton, GruGru-ber & Blake, 2003; Fama & French, 2009). Furthermore, some studies show an average yearly excess re-turn that is positive when including management fees (Grinblatt & Titman, 1989; Grinblatt & Titman, 1993; Daniel, Grinblatt, Titman & Wermers, 1997; Wermers, 2012). These stud-ies commonly indicate that managers, on average, have superior skill of securitstud-ies selection. However, there is evidence that actual performance does not cover the cost of manage-ment expenses.
The geographical limitation of the research, mainly centred in the U.S and the U.K mar-kets, are leaving other markets unexplored (Leite, Cortez & Armada, 2009). The few excep-tions are the studies conducted by Kryzanowski, Lalancette and To (1997) in the Canadian market, Otten and Bams (2002) in some markets in Europe, Bauer, Otten and Rad (2006) in the New Zealand market and Leite et al. (2009) in the Portuguese market. The authors of this thesis find only three published empirical studies, Dahlquist, Engström and Söder-lind (2000), Engström (2004), and Flam and Vestman (2014) regarding the Swedish mutual fund market. However, there is a lack of Swedish published papers on the widely used FF3FM to investigate Swedish mutual funds’ performance. As the FF3FM is the founda-tion of multi-factor models of performance evaluafounda-tion, the employment of these factors creates a base for the evaluation of the Swedish market.
The thesis aims to conduct a study in the unexplored Swedish mutual fund market due to the lack of Swedish research papers, especially on the FF3FM, and due to the importance
of Swedish equity mutual funds’ performance evaluation. Engström (2004) argues that there are many reasons why evaluation of the mutual fund industry in Sweden are impor-tant. The Swedish mutual fund market is relatively young and consists of less sophisticated funds compared to the U.S. market. The popularity of equity mutual funds in Sweden is also a reason for examining its performance. The focus of the thesis will be on the Swedish actively managed equity mutual funds’ ability to over perform the FF3FM’s benchmarks. The next section will briefly explain the purpose and research questions of the thesis.
1.4
Purpose
This thesis adds to the scarce empirical literature on Swedish equity mutual fund perform-ance. Employing the FF3FM, it aims at analyzing whether actively managed Swedish equity mutual funds outperform the Fama-French benchmarks net- and gross of management fees. In doing so, the thesis sheds light on whether Swedish actively managed equity mutual funds’ performance supports the existence of skilled or informed mutual funds managers or not, and whether funds’ underperformance is due to the expenses they charge. The present study moreover examines whether the findings speaks in favor of the efficient market hypothesis.
The thesis purpose can be subsumed into the following research question:
1. Do actively managed Swedish equity mutual funds outperform the Fama-French benchmarks net- and gross of the management fees?
1.5
Limitations
This thesis has two limitations. Firstly, the thesis focuses only on equity mutual funds that invest explicitly in Sweden and not Swedish-based equity mutual funds that invest abroad. Secondly, the selection of funds in the sample is based only on available data for the equity mutual funds. The thesis does not examine the relationship between equity mutual funds and management fees fund by fund due to the focus on the performance of the funds.
1.6
Organization of the thesis
The thesis begins with the introduction of the research topic including background, prob-lem statement, research purpose and limitations. The background outlines the various types of mutual funds in the market, and their growing importance. It also presents recent ap-proaches to measuring mutual funds’ performance. Thereafter, the Swedish mutual fund industry is introduced, followed by the formulation of the problem statement. From the problem statement, the thesis purpose is derived. Section 2 contains the frame of reference including a relevant theoretical background of, and previous empirical studies on the topic. The thesis’ methodology is discussed in Section 3, and Section 4 presents the empirical re-sults and analysis. Conclusions and suggestions for future research are provided in Section 5.
2
Frame of References
In this section, the theoretical setting of the most important topics related to our study is presented and dis-cussed. The section covers the topics such as Modern Portfolio Theory and Capital Asset Pricing Model. In addition, Jensen’s alpha are presented as the risk-adjusted measure. Subsequently, Random Walk Theory, Efficient Market Hypothesis and the decomposition of the Fama-French Three Factor model is discussed and presented in details. The frame of references ends with the discussion of previous research studies on the topic.
2.1
Equity mutual funds
The most popular type of fund is the equity mutual fund, which invest in stocks that repre-sent an ownership in a company (Mobius, 2007). Owning a great number of stocks in a mutual fund lowers the effect of a decrease in value of one single stock, thus offering a cost efficient and diversifiable portfolio. Equity funds generate profit for the investor in three different ways: dividends, capital gains distributions and appreciation in price/share. Com-bining these three elements make up the total return of the fund. The shares within the eq-uity funds are categorized according to features such as company size, historical dividends, potential for capital appreciation and responses to changes in the economy (Mobius, 2007).
2.2
Active management
Active management implies that the manager is betting against the market by building a portfolio of assets that are different from a passive portfolio or market index. The purpose of actively managed mutual fund is to generate superior return for the fund (over the mar-ket index) by forecasting and searching for stocks that are undervalued (Elton et al., 2011). This is done by either using technical or fundamental analysis (Malkiel, 1999). Technical analyses concerns forecasting future movements in the stock price by looking at past prices and volumes of the traded stock in order to detect a positive- or negative trend. This trend will give buy- or sell indications. On the other hand, fundamental analyses concerns the true value of an asset. In order to arrive at the true value of an asset or security, specific firm information such as growth prospects and accounting details is studied. Eventually, the market will reflect the true value of an asset and as a consequence, if the analysed value is above the market price, the asset is considered to be mispriced and a good investment (Malkiel, 1999). The advantage of active management is that the manager can, based on his or her knowledge and experience, produce greater return by diversifying the portfolio and spread the risk (Northcott, 2009). Diversifying a portfolio means that if a company goes bankrupt, it will not have a great effect on the overall value of the fund; the manager can spread the risk. This costs the investor by the form of a yearly management fee in order to cover the expenses of active management (Northcott, 2009).
2.3
Modern portfolio theory
The Modern Portfolio Theory (hereinafter – MPT) is a financial theory that seeks to maxi-mise the portfolio expected return with a given amount of risk or reduce a risk for a given level of expected return by properly choosing the quantity of assets in the portfolio (The Economic Times, 2015). The MPT was presented in 1952 by Harry Markowitz in his article named ―Portfolio selection‖. In the article, Markowitz revealed between efficient and inef-ficient portfolios in other words called ―efinef-ficient frontier‖ or ―set of efinef-ficient mean-variance combinations‖. He suggested that means, mean-variances and comean-variances of the securi-ties can be determined by using a statistical analysis process by which a set of efficient
mean-variance combinations can be derived. The investor can rely on the efficient frontier for choosing a security based by the mixture of return and risk (Markowitz, 1999).
Markowitz’s portfolio theory has an assumption that investors are risk-averse meaning that if there are two securities with the same returns, investor will choose the one with the lower risk. The portfolio theory extended and contributed to the diversification effect with the Markowitz’s evidence that the mixture of negatively correlated securities can result in reduced total portfolio risk (Müller, 1988).
The MPT was extended with the proposition of CAPM for pricing risky securities. The CAPM explains how asset prices are determined and shows that the optimal portfolio of securities of an investor relies on the forecasts of portfolio manager about the different se-curities prices in the future and not on the investors own risk preferences (Lindbeck, 1990). According to Debra Baker, Head of BNY Mellon’s Global Risk Solutions, (2013), the MPT provided institutional investors with the framework and process of how to manage risk and construct an optimal portfolio of assets and was a guideline after 1950s for decades.
2.4
Capital asset pricing model
The Capital Asset Pricing Model which is referred to as the CAPM was presented in the 1960s by Jack Treynor, William Sharpe, John Lintner and Jan Mossin who all developed the model independently. The CAPM contributes to comprehension of how the capital markets operates. The main idea of the CAPM is that investors should be compensated for the risk they take when obtaining a security or a portfolio of assets. The assumption of the CAPM is that a company is affected by the only risk factor named as the systematic risk (Elton et al., 2011). The systematic risk is represented by the Beta coefficient and is meas-ured as the covariance between the stock and the market returns divided by the variance of the market returns (Chen, 2003):
𝛽 = 𝐶𝑜𝑣(𝑅𝑖, 𝑅𝑚) 𝑉𝑎𝑟(𝑅𝑚)
The CAPM states that the expected return of a security or a portfolio is equal to a risk free interest rate plus a risk premium:
𝐸 𝑅𝑖 = 𝑅𝑓 + 𝛽𝑖 𝐸 𝑅𝑚 − 𝑅𝑓 ,
where 𝑅𝑓 denotes the risk free interest rate, E is the expectation determinator, 𝐸 𝑅𝑚 is
the expected market return, 𝛽𝑖 is the measure of the systematic risk (beta) (Cont, 2010).
A relationship between the systematic risk or the expected market risk versus a return of the whole market at a specified point in time is called the security market line (hereinafter – SML). The SML is an instrument by which one can reveal whether an asset being consid-ered for a portfolio provides a rational expected return for a taken risk (Vishwanath, 2009). From Figure 2-4, if the security’s risk in relation to expected return is drawn above SML, it is considered to be undervalued due to investor can anticipate higher return for the system-atic risk (non-diversifiable risk). If the security is plotted below the SML, it is overvalued due to the investor’s expectations of the lower return in exchange for the risk (Vishwanath, 2009).
Figure 2-4 Security market line
Source: Elton et al. (2011)
The practical use of the CAPM comprises of three main parts. From investors point of view, the aim of the CAPM is using historical betas’ estimates to forecast the future betas. The CAPM can also be used as a benchmark tool for making investor’s decisions using SML and detecting the overvalued or undervalued securities (Lee, Finnerty & Wort, 2010). Eventually, the CAPM is used for performance evaluation by creating the performance in-dicators such as Sharpe ratio, Treynor index or Jensen’s alpha (Cont, 2010).
The CAPM was also an object for criticism on its assumptions which are more theoretical and unrealistic from the practical point of view. Academics have put a lot of effort in vali-dating the CAPM as a useful economic model. Black, Jensen and Scholes (1972) disclosed that in order for the CAPM to hold, the returns should be normally distributed and if the CAPM holds, only the beta should be priced. Fama and MacBeth (1973) tested the rela-tionship between average return and risk for New York Stock Exchange stocks. Their em-pirical study showed that they couldn’t reject the hypothesis of two parameter portfolio model that pricing the stocks makes the risk-averse investors to hold ―efficient‖ portfolios. Eventually, Roll (1977) finalised the attempts of proval and disproval of CAPM in his pa-per work with the idea that since the ―market portfolio‖ is not measurable, it is impossible to empirically prove or disprove the CAPM.
In spite of the different academics’ opinions related to CAPM, the practitioners employ the CAPM as the base of creating the risk-adjusted performance indicators such as Sharpe ratio or Treynor index. In 1966, William Sharpe presented the Sharpe ratio and measured the performance of mutual funds. After the adjustment of this ratio in 1994, the main idea was to evaluate the expected return for each unit of risk taken for a zero investment strategy (Sharpe, 1994). The Treynor ratio is similar ratio to the Sharpe measure which was pre-sented in 1965 by Jack Treynor. The ratio measures the risk-adjusted performance of the fund. The Treynor ratio uses the systematic risk of the fund as a measure of the fund’s risk as a substitute to standard deviation (Treynor, 1965).
There have been numerous empirical researches testing the effectiveness of the Sharpe ra-tio on the performance measurement (Goodwin, 1998; Ankrim, 1992; Grinold & Kahn, 1992) as well as of the Treynor ratio (Scholz & Wilkens, 2005). The implications show that the Sharpe and Treynor ratios are good measures to evaluate portfolios’ or funds’ perform-ance. Nonetheless, it is agreed that investors should not rely on these single measures and
should take into account other indicators in the evaluation of portfolios’ or funds’ per-formance (Scholz & Wilkens, 2005).
2.4.1 Jensen’s alpha
Jensen’s alpha was proposed in 1967 by Michael C. Jensen when he was evaluating the per-formance of mutual funds. He derived the ratio in order to determine how much of the fund manager’s ability to forecast adds up to the fund’s returns. Jensen’s alpha is based on the CAPM theory and approximates the average return of a portfolio which is greater than the one estimated by CAPM taking into account portfolio’s beta and average market return. Jensen’s estimation of 115 mutual fund managers resulted that on average the managers were not capable to predict security prices to outperform the market (Jensen, 1967).
According to Elton et. al (2011), Jensen’s alpha can be represented as follows: αp = R − [Rp f+ βp E Rm − Rf ],
where R denotes expected return of the portfolio, Rp f denotes the risk free rate, βp
repre-sents the beta of the portfolio and E Rm indicates expected market return.
Since Jensen’s alpha is an indicator of the risk-adjusted performance of a fund, it can be in-ferred as the risk-adjusted value generated by the active fund management. If the measure is larger than zero, the fund is considered to have higher return than expected by CAPM. In this case, it implies a positive fund manager’s performance by generating excess returns by taking into account market sensitivity factor (beta) of the portfolio. A negative Jensen’s alpha shows that the fund underperformed the market (Feibel, 2003).
The importance of Jensen’s alpha is proposed in Pedersen and Satchell (2000) when they were evaluating the performance measures in the asymmetric response model.Schneeweis and Spurgin (1999) disclosed that the risk-adjusted performance alpha can be used as the performance indicator when comparing manager’s ability to select assets allocation in com-parison with a benchmark. The study performed by Kang and Lee (2013) determined that the Jensen’s coefficient can be a biased performance measure if the returns of the bench-mark portfolio are serially correlated. However, the indicator is widely used by financial in-dustry as an indicator for rewarding investment opportunities even until today (Gerber & Hens, 2009).
2.5
Efficient market hypothesis
The concept of the efficient market hypothesis was introduced in 1965 by Eugene Fama where he proposed both the theory and the evidence for the hypothesis of the efficient markets. He presented that an ―efficient market‖ comprise of a numerous actively rivalling participants where no one appeals the market power. The goal of the participants is to maximise their profits by operating in a rational way. The object of every participant is to determine the true value of the securities in a background where the information is freely available to all the rivalling market participants. Subsequently, the rivalry between the mar-ket participants would induce that the real price of each security always will completely re-flect all the available information that prevails in the market. In other words, the main sug-gestion of the theory is that it is impossible to ―beat the market‖ due to that the stock mar-ket efficiency causes the existing share prices to always contain and reflect all the relevant information (Fama, 1965).
In his later paper, Fama (1970) decomposes the market into three different efficiency stages and performs the empirical analysis to test if his theory holds. His findings stand in line with the efficient market hypothesis and controversial studies were uncommon. The three efficiency stages can be presented as follows:
1. Weak. This level of the efficient market hypothesis states that the security prices are reflected on the historically available information. This does not back up the tech-nical analysis which states that the historical data can give profitable signs to the fu-ture price movement of the stock (Fama, 1970).
2. Semi strong. The level states that all the public information (particularly the finan-cial data) is reflected in the securities prices (Fama, 1970). This implies that once the public information will be released, it will have an instant impact on the stock price. Hägg (1988) states that a mutual fund manager’s ability to generate superior risk-adjusted return is a test of the semi strong market efficiency.
3. Strong. This level states that security prices are reflected by both publicly available and private (insider) information. The theory explains that the investors who pro-ceed on the inside information cannot profit by doing so if the markets are strong efficient (Ryland, 2014).
In his study, Fama (1965) comprehended that the previous studies backing up the random walk theory were not in line with the technical and fundamental analysis. His results show that if the entrance fee of the mutual funds were disregarded, the funds performed about the same as the randomly chosen portfolio. On the contrary, when taking into account the entrance fee of the mutual funds, their performance became lower than that of the ran-domly chosen portfolio. He concluded that financial institutions and investment companies cannot outperform the normal buy-and-hold strategy. Fama’s implication was in accor-dance with the previous random walk studies (Fama, 1970).
In 1973, the Burton Malkiel wrote a book called ―A Random Walk Down Wall Street‖. In the book, Malkiel (1973) presents statistics which proves that majority of the mutual fund’s managers were unsuccessful in beating the benchmark averages and proclaims that both the technical analysis and the fundamental analysis are still not confirmed in outperforming the markets. He declared that a long time span buy-and-hold strategy is the finest and indi-viduals should not try to outperform the market.
To summarise the random walk theory and the efficient market hypothesis presented pre-viously, the academics’ studies confirms that it is impossible for the investors to acquire undervalued stocks or sell the stocks for the higher prices since the stocks are always traded at their true value on the stock markets. For this reason, it should be impossible to outper-form the overall market using the expert stock selection or the market timing abilities. The single way for the investor to gain the higher returns is by acquiring riskier investments (Ryland, 2014).
2.6
Modified efficient market hypothesis
The modification of the efficient market hypothesis was proposed by Grossman and Stiglitz (1980), where they stated that the efficient market hypothesis turns out to be unsta-ble if the information is expensive to get. It is impossiunsta-ble for the investors to gain the ab-normal returns on his or her managed information if it is expensive to obtain the informa-tion or if the trade takes place at the prices which include all the informainforma-tion. This would
imply that traders would not be compensated from becoming informed and they could cut off their payments for information and perform the same as the ones who paid for that. Therefore, no trader would want to pay for the information and there would only be the uninformed investors in the market. Grossman and Stiglitz concluded that an economic in-centive to gather information would appear. This information would be applied for the trading process before others would find out.
Under the theory presented by Elton, Gruber, Das and Hlavka (1993), the informed traders can perform better compared to others because of the skills they possess for collecting the information. In this case, the superior performance could arise due to the existence of skilled or informed mutual fund managers as opposed to the luck when selecting under-priced securities. Ippolito (1993) in his paper tested the modified portfolio theory for the mutual fund industry. The study reveals that the modified efficient market hypothesis can go in line with his results which showed that the risk-adjusted returns net of fees and ex-penses are similar to those of the index funds. In contrast to the efficient market hypothe-sis, funds’ managers should not over perform the market excluding the expenses from the returns and should be inferior to the passive investment (Ippolito, 1993).
2.7
Multi-Factor models
Due to only one market proxy used as the benchmark, the CAPM is regarded as the single-factor model. As already stated previously, the derivation of Jensen’s alpha is based by the CAPM and the term of the single-index model is sometimes referred to as the estimation of the excess returns using Jensen’s indicator (Faust, 2010).
Regardless of the use of the risk-adjusted performance measures or single-factor model, the multi-factor models were developed as the substitute to the CAPM which was a subject to Roll’s (1977) criticism. The models allow us to clarify the portfolio returns taking into ac-count certain factors which can be named as market indexes, macroeconomic factors or fundamental factors. The idea behind the use of these type of factors is due to the concern that single-index model based by CAPM is too theoretical and reflects the non-observable market portfolio. The multi-factor models enhance the part of variance explained by the regression and describes management performance on mutual funds more accurately (Le Sourd, 2007).
The general equation of the multi-factor model is as follows:
𝑅𝑖𝑡 = 𝛼𝑖+ 𝑏𝑖𝑘𝐹𝑘𝑡 + 𝜀𝑖𝑡,
𝑘
𝑘=1
where 𝑅𝑖𝑡 denotes the rate of return of asset i, 𝛼𝑖 denotes the expected return of asset i, 𝑏𝑖𝑘
represents the sensitivity of asset i to factor k, 𝐹𝑘𝑡 represents the return of factor k with
E(𝐹𝑘) = 0, 𝜀𝑖𝑡 denotes the residual return, or the part of the return that is not explained by
the factors. The multi-factor models based by the fundamental factors are the type of fac-tors which explain the returns of the assets in relation with variables that rely on the cha-racteristics of the companies and not on the economic factors affecting the assets. This type of framework is used following the assumption that fundamental factors are described as the functions of the companies’ characteristics. One of the most widely used fundamen-tal type multi-factor models in academic literature as well as in practical application, is Fa-ma and French’s three-factor model (Le Sourd, 2007).
2.8
Fama-French three factor model
Fama and French previous studies revealed the uniqueness of their proposed three factor model known as the Fama-French’s three factor model. In their research, they added two impor-tant factors which supplement to market risk and one of which accounts for size and other for value. Fama and French made an implication that value stocks perform better than growth stocks and stocks with small capitalization outperform those with large capitaliza-tion (Krichene, 2012).
Fama and French (1992) found that variables defined as size and value describes the greater part of the average stock returns. Size is identified as the market equity (ME) which is the price of the stock times the number of shares outstanding. Value is defined as the propor-tion of the book value to equity (BE) and market equity (ME) (BE/ME) (Fama & French, 1993). The idea behind the size- and value factors is that these variables clarify the variance of stock returns since they explain the underlying risk of stocks (Fama & French, 1992). These two variables are denoted by two portfolios which are small minus big (SMB) and high minus low (HML) for the size and the value factor, respectivley. The FF3FM consists of three explanatory variables denoted as MRP, SMB and HML, which are considered to be the risk factors capturing the non-diversifiable (systematic) variance of the stocks (Fama & French, 1993).
The FF3FM is expressed as:
𝑅𝑖𝑡 − 𝑅𝑓𝑡 = 𝛼𝑖+ 𝛽𝑖𝑚MRPt+ 𝛽𝑖𝑆𝑀𝐵SMBt+ 𝛽𝑖𝐻𝑀𝐿HMLt+ 𝜀𝑖𝑡,
where 𝑅𝑖𝑡 is the fund’s return, 𝑅𝑓𝑡 denotes the risk-free rate, 𝛼𝑖 is the alpha intercept of the
fund i, 𝛽𝑖𝑚 represents the beta of the fund i, MRP denotes the risk-adjusted market return,
SMB indicates small minus big stocks, HML denotes high minus low stocks, 𝜀𝑖𝑡 denotes
the residual return (Faust, 2010). 𝛽𝑖𝑆𝑀𝐵 and 𝛽𝑖𝐻𝑀𝐿 are coefficients uncovered by linear
re-gression. 𝛽𝑖𝑆𝑀𝐵 or size beta determines the sensitivity of the portfolio to small
capitaliza-tion stocks and 𝛽𝑖𝐻𝑀𝐿 or value beta determines the sensitivity of the portfolio to value
stocks (Fama & French, 1993). In the SMB case, a beta coefficient which is higher than ze-ro indicates greater sensitivity to small capitalization stocks compared to large capitalization stocks. In HML case, a coefficient which is higher than zero indicates greater sensitivity to small value stocks compared to growth stocks. If the beta coefficients for SMB and HML factors are negative, it implies that the portfolio has greater exposure to large capitalization stocks and growth stocks, respectively (Bacon, 2012).
2.8.1 Market risk premium
Market risk premium (MRP) is defined as the difference between the expected return of a market portfolio and the risk-free interest rate (Fernandez, 2004). Merton (1980) claimed that the MRP should be positively correlated to the volatility of the market portfolio. The idea of this is that investors require greater prospective returns in exchange for an addi-tional risk. He produced estimates of the volatility of the market and reveals that the vari-ance of the market returns changes significantly over time. He makes an implication that the MRP should also change over time. Fama and French (1988) were arguing that detected market variance can be decomposed into expected variance and unexpected variation in variance. They determined empirically that the expected MRP is positively correlated to ex-pected variance and there is a negative relationship between the exex-pected MRP and the un-expected variation in volatility.
Ang, Hodrick, Xing and Zhang (2006) examined the pricing of aggregate volatility risk in the cross-section of stock returns. Their findings show that those stocks with high sensi-tivities to innovations in aggregate volatility have poor average returns. Moreover, they de-termined that high idiosyncratic (unsystematic) volatility of the stocks has a negative corre-lation to returns. Furthermore, Jiang and Lee (2006) found that there is a positive recorre-lation- relation-ship between the idiosyncratic volatility and market returns.
2.8.2 The Size factor and the Value factor
Fama and French (1993) proposed two factors, the one catching the size premium (SMB) and the second the value to growth premium (HML). Their factors complement the MRP to present the sufficient model of the cross-section of US returns. When Bantz (1981) ex-amined the relationship between the return and total market value of NYSE common stocks, his results showed that companies having a lower market capitalization produce higher risk-adjusted returns compared with those companies having greater market capitali-zation. He made an implication that the size effect is existing and that the CAPM is miss-pecified. When Roll (1981) were examining size premium, he stated that small-firm pre-mium is a consequence of difficulties in assessing risk. Later on, the same author came up with the conclusion that size premium could be a consequence of assessing return (Roll, 1983).
When evaluating mutual funds performance using a four-factor model, Huij and Verbeek (2009) discovered that there is no evidence of the SMB factor, but they confirmed that HML factor is relevant. They stated that factors based on mutual fund returns, as opposed to stocks, returns give better benchmarks in order to evaluate mutual fund managers. Du-rand, Juricev and Smith (2007) examined the SMB factor and made the implication that the size premium arise from investors' emotional induce.
On the contrary, the SMB and the HML are presented as the factors which impart the in-formation concerning the future state of the economy in ten of the developing countries (Liew & Vassalou, 2000). Another study reveals that SMB in relation with the other ma-croeconomic factors do predict the market volatility and they are priced because they can give information about the future market volatility (Sohn, 2009).
With the proposition of the size factor, Fama and French (1993) presented the second fac-tor, HML, which covers the value to growth premium. The factor is based by the idea that the ―value‖ stocks have the greater ratio of book value of equity to market capitalization and ―growth‖ stocks are considered to have a lower ratio.
Rozeff and Zaman (1998) were examining the overreaction and insider trading in growth and value portfolios. They stated that when stocks change from the growth class to the value class, it makes an incentive for insider buying to increase. Additionally, they found that the prices of value stocks are below their fundamental values and the prices of growth stocks are above the fundamental values. La Porta, Lakonishok, Shleifer and Vishny (1997) tested the hypothesis that the superior return to value stocks is the consequence of expec-tational errors which investors have made. These academics made an implication that in-vestors are overreacting to bad or good information when the company proposes its earn-ings and as a consequence of that the prices of such stocks turn to be below or above their ―true‖ values. According to La Porta et al. (1997), higher (lower) book-to-market ratios are
a function of the overreaction and the lower (higher) returns to growth (value) stocks de-note the correction of the prices to this overreaction.
In some of the researches, the authors define that the value premium has an economic in-stead of behavioural underlying principle. As it was mentioned previously in the paragraph, the HML factor drives in the economic expectations (Liew & Vassalou, 2000). Another study was done where the risk of the value and the growth stocks were evaluated. The re-sults showed that value stocks are run by economic causes (Petkova & Zhang, 2005). The authors of this thesis can claim that the above studies present the importance of the HML factor in representing the investors’ expectations of economic welfare in the future.
2.9
Previous research
There have been multiple studies in the area of mutual funds performance and their ability to outsmart the market since their first appearance in the 1960’s (Chen, Cheng, Rahman & Chan, 1992). Two studies have dominated this research area, one of which was conducted by Sharpe in 1966 and the other one by Jensen in 1967. In order to measure portfolio per-formance across mutual funds of different risks, the authors developed techniques that ad-justed for risk. Those techniques laid the basis of today’s measures of portfolio perform-ance evaluation (Elton et al., 2011). Sharpe (1966) performed the analysis of 34 mutual funds in the period 1954-1963 in the US market. He found that 23 out of 34 funds under-performed the Dow Jones Industrial Average benchmark and therefore concluded that the market was extremely efficient. The study also showed that funds with smaller expense ra-tios obtained better results. The other 11 funds in the sample showed over performance compared to the benchmark. Jensen (1967) estimated the performance of 115 equity mu-tual funds in the period 1945-1964 and found similar results where he concluded that on average, mutual funds did not outsmart the market and had no manager skill, both when including and excluding management costs. For a long period of time these two studies dominated the research, communicating that additional resources spent on active ment could not add the extra value above investing in the market index. Active manage-ment was therefore regarded as a total waste of money. Resources spent on research to find undervalued stocks were useless and could not be compensated to the investor (Malkiel, 1999). This perspective was consisted with the original efficient market theory, stating that all information available is already reflected into stock prices (Fama, 1970).
On the other hand, Ippolito (1989) examined the performance of 143 mutual funds over the period 1965-1984 and his study showed that mutual funds, excluding expenses, outper-formed the market index. On this basis he argued that mutual fund managers are efficient in investing their money. He also concluded that the return sufficiently covered the high expenses of the funds that had higher fees and costs. Furthermore, he argued that when there is a costly information, his results were consistent with market efficiency and that it supported the modified market hypothesis developed by Grossman and Stiglitz in 1980 (Elton et al., 1993). Elton et al. (1993) argued that this view was incorrect on the basis that Ippolito did not take performance of certain type of assets into account properly. They in-vestigated the informational efficiency of mutual fund performance for the period 1965-1984 in US market. Building on Ippolito’s study, Elton et al. (1993) concluded that manag-ers do not invest their money in an efficient way to cover the cost. Their study shows that actively managed funds’ returns (before expenses) underperformed passive portfolios and higher fees generated the lower performance. In addition, the funds with high fees did worse than the funds with lower fees.
The same year as Ippolito’s study, Grinblatt and Titman (1989) conducted a study free of survivorship bias and concluded that the risk-adjusted gross returns of some mutual funds were significantly positive. Grinblatt and Titman (1993) further conducted a study of a large sample of mutual funds for the period 1976-1985 and found that managers holding portfolios of mutual funds earned significantly positive risk-adjusted returns in their sample period. In turn, Brown and Goetzmann (1995) conducted a study free of survivorship bias for the sample of 372 funds in the period 1976-1988 and found little evidence that the eq-uity funds underperformed a passive benchmark portfolio.
Using a sample of 188 funds for the period 1977-1993, Elton, Gruber and Blake (1996a) conclude that the studied mutual funds in US in general had negative excess returns when adjusted for risk in their multi-factor model. They argue that past performance carries in-formation about the future performance, showing that funds that did well historically have a tendency to do well in the future on a risk-adjusted basis. Carhart (1997) conducted a study including 1892 equity mutual funds from 1962 to 1993 by employing multi-factor models. His findings were that the majority of the funds underperformed the market index by the amount of their expenses. He argues for three rules of thumb regarding the choice of fund. Firstly, one should not buy funds that have records of persistently poor perform-ance. Secondly, funds that performed well previous year most likely will do better than av-erage next year, but not in the following years. Thirdly, one should avoid funds with high expenses since it affects performance negatively. Carhart concluded that the findings did not support the existence of skilled or informed mutual fund portfolio managers. On the other hand, Daniel, Grinblatt, Titman and Wermers (1997) examined 2500 equity mutual funds from 1975 to 1994 by using multi-factor models and characteristic based perfor-mance measures. They found some evidence of stock selection ability of the equity mutual funds when examining their performance. Wermers (2012) concluded in their study that their evidence supported the value of actively managed mutual funds.
By estimating the alpha of the CAPM and the FF3FM, Pastor and Stambaugh (2002) found that the majority of the equity funds showed underperformance due to their negative al-phas. Likewise, Elton, Gruber and Blake (2003) used a sample varying from 40 to 108 funds from 1990-1999 in US market and found underperformance by ing multi-index model benchmarks. Fama and French (2009) examined 1374 US equity mutual funds for 1984-2006 and revealed that few funds generate risk-adjusted excess returns sufficient to cover their expenses. They conclude that the actively managed funds in the portfolio is close to the market portfolio, however, the expenses are generating lower returns to inves-tors.
Even though there are numerous empirical studies focusing on US market, there is only lit-tle empirical researches on the performance of Swedish mutual funds. One study by Dahlquist, Engström and Söderlind (2000) examined the relationship between fund attrib-utes and mutual fund performance in the Swedish market from 1993 to 1997. They used a sample of 80 equity funds based in Sweden and investing in Swedish market. It was found that equity funds, net of costs, did not over perform their benchmark characteristics. The results showed a negative alpha of -1.30 percent per year. In addition, they found that lar-ger equity funds have a tendency to underperform smaller equity funds. The authors also found a negative relationship between performance and fees, where funds with high fees performed less well than funds with low fees. However, there were some cases in which funds with high fees over performed funds with low fees when fees were included. This re-sult suggests that high fees or expensive management may generate good performance. However, the good performance is not sufficient to cover the expenses.
In his working paper, Engström (2004) provides evidence on the funds’ portfolio charac-teristics and examines the relationship between performance and investment strategy of the management. His sample consisted of 97 Swedish based mutual funds investing in Sweden during the period 1996-2000. The author overall results found an average net excess return of 1.7 per cent per year. In addition, the majority of the funds (77%) delivered performance between -2 percent and 4 percent annually.
Flam and Vestman (2014) found out, by constructing multi-factor models to evaluate 115 mutual funds’ performance, that actively managed Swedish equity mutual funds generated an average positive alpha of 0.9 per cent per year before expenses and a negative alpha of -0.5 per cent after expenses in the years 1999 to 2009. The authors found that it is good or bad luck that mostly explain the gross returns and not superior skill. They state that fund managers on average cannot compensate investors for management costs. The authors conclude that there is no empirical evidence that managers of Swedish equity mutual funds have superior stock-picking skills and one should choose a passively managed fund with low or no fee over an actively managed fund.
The numerous studies regarding the topic of mutual fund performance evaluation have found various results depending on the time span, the sample size and techniques used in the analysis. This thesis uses a different, and more recent time span along with the different funds in the sample size. The sample size and the country studied also differs from the other studies. The numerous studies have mostly been conducted in the US market, whereas the European market has been left much unexplored, especially the Swedish mar-ket where only three studies have been found.
3
Methodology
This section covers the research methods which are used in the study and the selection of funds which consists of time period, data and impact on survivorship bias. Moreover, the data sources are defined and the compo-sition of returns and risk-free rate are presented in this section. After all, the variables used in the regression analysis are explained in more detail and the empirical method is presented in this chapter.
3.1
Research methods
According to Kothari (2004), research is an academic activity and consists of defining and redefining problems, formulating research questions or proposed solutions; collecting, ar-ranging and evaluating the data and bringing up implications. Finally, testing if the research questions are being answered by the achieved implications. The aim of the research is to determine answers to questions by applying scientific procedures.
In order to conduct the research it is necessary to determine what philosophies, approaches and choices of data to adopt to it that the research would be consistent and sufficient and presented implications would be reliable. According to Saunders, Lewis and Thornhill (2012), there are four types of research philosophies in business management: positivism, realism, interpretivism and pragmatism. The positivistic view believes in the possibility to observe and describe reality from an objective point of view. For instance, the philosophy can determine ―general‖ relationships and ―general‖ laws or test the theories (Saunders et al., 2012).The authors of this thesis believe to reflect the positivism in this study where the data, based on empirical observations, is collected to describe the objective reality of fund’s performance.
To be able to answer the research question, the deductive research approach was chosen. Based by Saunders et al. (2012), the deductive research approach is used to test the theory and moves from theory to data. In addition, the approach is mainly used for collecting quantitative data, applying controls for validity of data, selecting the samples of a sufficient size. This was also the case in this thesis, where the research question has tested the effi-cient market hypothesis in the Swedish market, based on quantitative fund-data. Moreover, a deductive approach is related to the development of a hypothesis and is based on existing theory and includes the composition of the research strategy to test the hypothesis (Saun-ders et al., 2012). Although, this thesis has not based the research on hypothesis testing ex-plicitly by using H0 and H1 from statistics, the research questions arisen from the theory
were considered as the hypothesis which was needed to be answered.
Following the deductive approach, quantitative data was used in this thesis. The decision to use quantitative data instead of qualitative data (interviews) is due to that if the perform-ance evaluation of mutual funds would have been tested by using qualitative data, it could have resulted in a study concentrated only on strategies the managers use or valuation techniques of the stocks they apply. As far as the authors of this thesis know, the majority of this type of information is confidential in the mutual funds industry. Moreover, the best way to test the efficient market hypothesis was considered by the authors of this thesis to be the quantitative approach. Moreover, the use of quantitative data when measuring per-formance of mutual funds is justified in previous research (Fama & French, 2009; Elton et al., 2011).
3.2
Selection of funds
In order to avoid biases in the sample, only equity based mutual funds which should be de-fined as the actively managed funds were included. The reason for the sample chosen was that passively managed funds did not line up with the purpose of the thesis since they are tracking specific indexes. Actively managed equity mutual fund managers are seeking to over perform the market by selecting the exact securities which seem to be perspective in their analysis (Elton et al., 2011). As the model in this thesis was applied for the Swedish market, the sample was extended with another boundary, namely the Swedish based equity mutual funds, which invests the major part of their capital in Sweden. The other boundary that was set for the sample was that the funds chosen should be surviving for the estimated time period. This means that that the funds should be active during the time period that was studied.
3.2.1 Time period
A time period of ten years for the period 2003-2013 was chosen. The period was chosen due to the exact availability of the data. In addition, the choice of the time span was based by the fact that the longer the time period, the higher the probability to avoid the biased es-timation errors (Bartholdy & Peare, 2005). The importance of this time span was also based by the rapid increase of funds’ asset values in recent time. According to the Swedish In-vestment Fund Association (2014), the Swedish fund market has more than twice as much assets as in year 2003. The authors of this thesis considered that the period of ten years contained sufficient amount of information to present insights and implications and to per-form an in-depth analysis in this study.
3.2.2 Data
The data was collected using Morningstar of Sweden and Thomson Reuters Datastream databases, as well as data provided by the Swedish Investment Fund Association, which supplies the data of the operating funds in Sweden. First of all, 108 Swedish based equity mutual funds investing in Sweden were found. The funds were sorted out in line with our timeline (2003-2013) and the funds which were out of the time period were eliminated since only ten years data was needed. The names and the ISIN codes of a total of 42 equity mutual funds investing in Sweden were extracted from Morningstar of Sweden. After-wards, Datastream was used in order to get the monthly Net Asset Values (NAVs) of the funds with the adjustment for dividends. The data of only 21 out of 42 equity mutual fund was provided using this database. Subsequently, the authors of this thesis turned to the Swedish Investment Fund Association to get the data of the remaining funds. The adjusted daily data of 21 equity mutual fund was presented and the monthly NAVs were obtained from this data by taking the adjusted closing NAV value of every month in order to be in line with the remaining fund data obtained from the Datastream database. Hence, the total number of funds in the sample was 42.
The data collected from Datastream was considered to be secondary data, since this type of data include raw data or was used previously for some other purposes (Saunders et al., 2012). Even though the data is secondary data, the authors of this thesis assume that Thomson Reuters Datastream is a reliable resource since previous academics have used it for their empirical studies (Dalquist, Martinez & Söderlind, 2014) and it is widespread be-tween the practitioners in finance. Moreover, the Swedish Investment Fund Association provides their data to Datastream for onward transmission to the media.
3.2.2.1 Return
Mutual funds are traded using the Net Asset Values (NAV). In other words, it is the term of the underlying securities of the fund per share. The NAV is calculated one time per day at the end of the trading day and reflects the mutual fund’s share price for the next trading day (Farlex Financial Dictionary, 2009). The NAV comprises of the market value of the different assets that the fund holds and dividing it by the number of shares in the fund. The NAV includes reinvestments of income and capital gains. The monthly return of the mutual fund was calculated using the following formula:
𝑅𝑡+1= 𝑁𝐴𝑉𝑡+1 − 𝑁𝐴𝑉𝑡
𝑁𝐴𝑉𝑡 ,
where 𝑅𝑡+1 denotes the return in month t+1, 𝑁𝐴𝑉𝑡+1 is the net asset value of the fund on the
last trading day of the month t+1, 𝑁𝐴𝑉𝑡 is the net asset value for the fund the last trading day
at month t (Simons, 1998).
The analysis was performed by focusing on the equally weighted portfolio. This was done by taking the average of the monthly returns of every fund in order to get the equally weighted portfolio. Monthly excess returns were calculated from February year t to De-cember year t+1. The returns were calculated from January year t, except for 2003, when returns were calculated from February 2003 due to the starting data point of monthly NAV as January 2003.
3.2.2.2 Risk free rate of return and the market return
As the risk free rate, the monthly 90-days treasury bills of Sweden was obtained from the Swedish Central Bank. The monthly rates were chosen in order to be in line with the same time span as the funds’ returns (Fama & French, 2009). The OMX Stockholm 30 Index was used as the market return in this thesis based on previous research.
3.2.2.3 Management fees
The yearly management fees were obtained from the Swedish Morningstar database for most of the funds and other fees were taken from the funds’ prospectus. Subsequently, the yearly fees were adjusted for the monthly data by dividing each fund’s early fee by twelve and as a result obtaining the monthly number. The yearly management fees of the actively managed equity mutual funds varied between 0.3 % and 2.5 % in our sample. The idea to include fees into the analysis of this thesis was due to the claim that if the efficient market hypothesis holds, equity mutual funds managers should not be able to outperform the market. Additionally, to test if underperformance of the funds was due to the expenses they charge.
3.2.2.4 Sorting into deciles
In order to perform the broader analysis, the data was sorted out into deciles (Flam & Vestman, 2014). First of all, the 42 regressions were run against each of the 42 funds net and gross of management fees and 42 alphas were obtained. The alphas were sorted out from the largest to the smallest by value in line with the funds. The funds were sorted out into deciles by the best performing funds to the least performing funds according to the obtained alphas. Each decile was composed by averaging the alphas of the funds in the de-cile. The funds were sorted out into ten deciles that all of the deciles would have an integer number of the funds.
3.2.2.5 Alpha transformation
The observed alphas were denoted as monthly alphas since monthly data was used in this thesis. For comparison purposes, the alphas were annualized and reported as both monthly and annualized alphas in the result section of this thesis. The monthly alpha was annualized by employing the following formula(Betker & Sheehan, 2013):
𝛼𝑎𝑛𝑛𝑢𝑎𝑙 = 1 + 𝛼𝑚𝑜𝑛𝑡 ℎ𝑙𝑦 12 − 1 3.2.3 Impact on survivorship bias
Some of the previous studies have presented that survivorship biases might have a substan-tial impact in estimating funds performance since it can cause an over-estimation of funds returns (Malkiel, 1995; Elton, Gruber & Blake, 1996b). By only using a survivorship bias free screened sample of funds, it was possible to analyze the effect of using only surviving funds in this thesis. For the ten year time period, only funds which survived during this pe-riod were included in the sample in order to avoid the survivorship bias effect in this thesis. Even though it was not tested if the mean returns of surviving funds were statistically dif-ferent from the mean returns when including all funds, and therefore if the alpha was over-estimated in the model, the authors of this thesis relied on the previous studies which stated the importance of survivorship bias and the need to eliminate the dead funds from the sample (Leite et al., 2009).
3.3
Presentation of the model
The model that was used in this thesis was the Fama-French three factor model. As men-tioned before, the lack of Swedish papers using this model and the fact that it is a base for all multi-factor models, was the reason for the choice of the model. Furthermore, Hou, Xue and Zhang (2015) argue that including too many factors, in this case using different modifications of the Fama-French model, does not necessarily mean that the factors can explain the performance better. This also justified why the FF3FM was used in the thesis. Regarding the regression model, two different regressions were performed in this study to be able to answer the research questions and the purpose related to the net- and gross excess returns of management fees. Both regressions were performed by means of ordinary least squares (OLS) regression analysis. The regression equation below was used to run the regression net of the management fees and one more time run the regression gross of the management fees. In the regression equation, country specific factors were used in order to see the power of the test in Sweden.
The model and regression equation can be presented as follows:
𝑅𝑝𝑡 − 𝑅𝑓𝑡 = 𝛼𝑖 + 𝛽𝑖𝑚 𝑅𝑂𝑀𝑋 − Rft SWE + 𝛽𝑖𝑆𝑀𝐵SMBSWE + 𝛽𝑖𝐻𝑀𝐿HMLSWE + 𝜀𝑖𝑡,
where the detailed explanation of the dependent and explanatory variables are covered in the following subsections.
To ensure the validity of the results, first of all, the variables were tested for stationarity. Moreover, both regressions were checked for residual diagnostics: autocorrelation, hetero-scedasticity, normality and miss-specification. The results of the previously mentioned tests had no issues, except for autocorrelation. The regressions were adjusted for autocorrelation problems by applying autoregressive and moving-average processes or the combination of both. The Eviews outputs of residual diagnostics are available upon request.