Investigation of signal fading in lithium formate
EPR dosimeters using a new sensitive method
Emelie Adolfsson, Mattias Karlsson, Gudrun Alm Carlsson, Åsa Carlsson Tedgren,
Eva Lund, Sara Olsson and Håkan Gustafsson
Linköping University Post Print
N.B.: When citing this work, cite the original article.
Original Publication:
Emelie Adolfsson, Mattias Karlsson, Gudrun Alm Carlsson, Åsa Carlsson Tedgren, Eva
Lund, Sara Olsson and Håkan Gustafsson, Investigation of signal fading in lithium formate
EPR dosimeters using a new sensitive method, 2012, Physics in Medicine and Biology, (57),
8, 2209-2217.
http://dx.doi.org/10.1088/0031-9155/57/8/2209
Copyright: Institute of Physics
http://www.iop.org/
Postprint available at: Linköping University Electronic Press
Investigation of signal fading in lithium formate EPR
dosimeters using a new sensitive method
Emelie Adolfsson1, Mattias Karlsson1, Gudrun Alm Carlsson1, Åsa Carlsson Tedgren1,2, Eva Lund1, Sara Olsson3 and Håkan Gustafsson1
1
Department of Medical and Health Sciences (IMH), Radiation Physics, Linköping University, SE 581 85 Linköping, Sweden
2
Swedish Radiation Safety Authority, SE 171 16 Stockholm, Sweden
3Medical Physics and Technology, Central Hospital, SE-351 85 Växjö, Sweden
Corresponding author: Emelie Adolfsson Radiation Physics
Department of Medical and Health Sciences (IMH) SE 581 85 Linköping
Sweden
emelie.adolfsson@liu.se
Abstract
The aim of the present study was to investigate signal fading in lithium formate electron paramagnetic resonance (EPR) dosimeters used for clinical applications in radiotherapy. A new experimental method for determination of signal fading, designed to resolve small changes in signal from slowly decaying unstable radicals was used. Possible signal fading in lithium formate due to different storage temperatures was also tested. Air humidity was kept on a constant level of 33% throughout the experiments.
The conclusion drawn from the investigations was that the EPR signal from lithium formate is stable during at least one month after irradiation and is not sensitive to variations in storage temperature < 40°C when kept at a relative air humidity of 33%. This makes lithium formate a suitable dosimeter for transfer dosimetry in clinical audits.
1. Introduction
Interest in finding a water equivalent and highly sensitive material for electron paramagnetic resonance (EPR) dosimetry has led to a reliable dosimetry system using lithium formate monohydrate (Vestad et al., 2003; Gustafsson et al., 2008; Antonovic et al., 2009; Adolfsson et al., 2010). At present, alanine is the golden standard material used for EPR dosimetry. Compared to alanine, lithium formate has higher sensitivity and is more water equivalent in terms of mass-energy absorption coefficients and density for radiation qualities relevant to radiotherapy (Vestad et al., 2004).
Determination of absorbed dose to water with EPR dosimeters (and other types of solid state detectors) requires the dosimeters to be calibrated. This can be done in a well known radiation quality using an ionization chamber with a calibration coefficient traceable to a primary standard (Adolfsson et al., 2010). For practical reasons, it is not always possible to keep the time between irradiation and readout the same when calibrating the dosimeters and in the dose measurements. Post-irradiation fading of the signal with time, when dosimeters are irradiated and read out at different occasions, is an important factor directly affecting the accuracy of dose measurements.
The literature provides different approaches as to how to perform an experimental investigation of post-irradiation fading in EPR dosimeters. Long-term control of the EPR spectrometer stability is a problem itself and the use of a reference sample (e.g. Mn2+/MgO or ruby crystal) seems to be the standard method today (Anton, 2005; De Angelis et al., 2000; Nagy et al., 2000b; Sleptchonok et al., 2000). Sleptchonok et al. (2000) present a review of different experimental techniques that have been applied in alanine signal stability measurements. Many authors have used alanine rods as reference, to control the stability before and after each series of measurements. However, such reference signals are prone to the same changes as the signals to be monitored and the method cannot be recommended for stability measurements (Sleptchonok et al., 2000). Sleptchonok et al. (2000) and Nagy et al. (2000a), (2000b) presented a study in three parts “Advancements in accuracy of the alanine EPR dosimetry system”. The two first parts concern signal fading in alanine with focus on environmental humidity (Sleptchonok et al., 2000) and influence of irradiation temperature (Nagy et al., 2000a). The third part (Nagy et al., 2000b) is a detailed description of using an adjacent ruby crystal reference sample, the method which was also used in parts 1 and 2. The ruby sample is permanently present in the cavity, in a position different from that of the test sample. One advantage with this method is that variations in signal intensity due to a varying cavity Q-factor can be decreased. However, the test sample and the reference sample are not recorded simultaneously, but one after the other.
For fading measurements of fast decaying radicals, a technique using sweep width of 0 mT and a continuously increasing time scale on the x-axes is the method of choice. Vestad et al. (2003) studied signal fading in formates (among them lithium formate) using this technique by irradiating one sample to 10 Gy with 220 kV x-rays. Readout was made in stable conditions of room-temperature and
humidity. No changes in signal shape or intensity were detected during seven days. However, this method is not accurate enough to resolve small changes in signal intensity from slowly decaying radicals such as lithium formate. Komaguchi et al. (2007) also investigated signal progression in pure lithium formate, using a Mn2+/MgO reference. One sample of lithium formate was stored open to air (relative air humidity 70%) and one sample was sealed from contact with the atmosphere. The results were similar to those reported by Vestad et al. For the sealed sample, no significant drop in signal was seen after the first week but a decrease of approximately 4% was seen after two months. For the open sample, the remaining signal was only 80% after two months, which probably depended on the high air humidity during the experiment. However, the use of only one sample for each measurement makes it difficult to analyze signal fading in detail and to draw statistically valid conclusions about the magnitude of signal drop over time. The results found by both Vestad et al. and Komaguchi et al. have provided valuable information for the development of our dosimetry system, but to quantify signal fading in lithium formate, an experiment that can resolve small changes (within one percent) in signal intensity is needed.
The experimental method described in this work is different from those found in the literature for studies of signal fading in EPR dosimeters. Instead of irradiating one sample at one occasion and following up with several read outs at different time intervals, our method is based on only one readout session but several irradiations at different times. This method has two important advantages: (A) several samples of lithium formate dosimeters are investigated in the same session, which results in reduced uncertainties. (B) No external reference (e.g. Mn2+/MgO or ruby) is needed to monitor spectrometer stability during the studied time interval. This makes it possible to optimise the read-out procedure for the dosimeter signal only, e.g. decreasing the sweep width to cover only the sample peak (for lithium formate that is 3 mT) and using a large field modulation amplitude to improve the signal to noise ratio. This technique is similar to our standard method for high accuracy dose verification measurements without use of external references. (Gustafsson et al., 2008), (Antonovic et al., 2009), (Adolfsson et al., 2010). The type A uncertainty introduced by normalizing to the reference sample is found to be larger than the Q-factor variations during one day (Gustafsson et al., 2008). All dosimeters are read out one by one in a rotating schedule to reduce the type A uncertainty from spectrometer instability.
It has been shown that air humidity has an effect on signal fading (Komaguchi et al., 2007). In this work the humidity was kept constant (33%) to avoid influencing the results. A full investigation of how air humidity affects signal stability is an extensive project and beyond the scope of this article. The aim of this study was to investigate the post-irradiation fading in lithium formate dosimeters using our experimental method described above. Three sets of fading measurements were performed; two concerning fading with time and one concerning fading due to different ambient storage temperatures.
2. Material and methods
2.1 Dosimeters
The dosimeters consisted of 90% (by weight) lithium formate monohydrate and 10% paraffin as a binder. The production process included grinding lithium formate and a series of mixing and heating steps to produce a homogeneous powder of lithium formate and paraffin, for details, see (Gustafsson, 2008), (Antonovic et al., 2009) and (Adolfsson et al., 2010). The powder was manually pressed with a table top pellet press to cylinders of height 4.8 mm and diameter 4.5 mm. To ensure signal homogeneity, all dosimeters used in one experiment belonged to a batch manufactured from the same mixture of lithium formate and paraffin. All batches used were pre-irradiated and read out to verify signal homogeneity, for details see (Antonovic et al., 2009) and (Adolfsson et al., 2010). All dosimeters were stored in a UV-light protected desiccator with a saturated aqueous solution of magnesium chloride to ensure a constant relative humidity of 33%. They were only taken out from the desiccator during the irradiations and the temperature treatment.
2.2 EPR equipment and settings
The dosimeter signal was measured with a BRUKER EleXsys E580 spectrometer with a standard cavity ER 4102ST. The measurement procedure follows our standard protocol for EPR dosimetry with modulation amplitude of 1.2 mT, time constant 328 s, sweep time 168 s and sweep width 0.3 mT.
2.3 Experimental design for post irradiation fading: five days
One batch of 25 dosimeters was used for the five-days fading measurement. The dosimeters were randomized and divided into five groups (five dosimeters in each group) and further irradiated to 20 Gy (in total 23 Gy including the dose from the homogeneity test). All irradiations were performed in a 6 MV photon beam from a linear accelerator. The dosimeters were positioned in a PMMA phantom together with an ionization chamber of Farmer type (NE2571). Group one was irradiated on day one, group two on day two and so on until the fifth day. All dosimeters were stored in glass cans in the desiccator except for the occasion when they were irradiated. Within one hour from the last irradiation the readout session of all dosimeters started. The mean signal from the five dosimeters irradiated in each group was normalized to the mean signal of the last irradiated dosimeters. The mean signal of each group was further normalized to the ionization chamber signal recorded at their irradiation.
2.4 Experimental design for post irradiation fading: 30 days
A second batch of 25 dosimeters were used and divided into five groups with five dosimeters in each. The same experimental setup and irradiation procedure were applied as those described above, but
with a separation of seven days between the irradiations of each group. The EPR readout was performed the day after the last irradiation. With this approach, signal fading was investigated over one month.
2.5 Experimental design for post irradiation fading: ambient storage temperatures
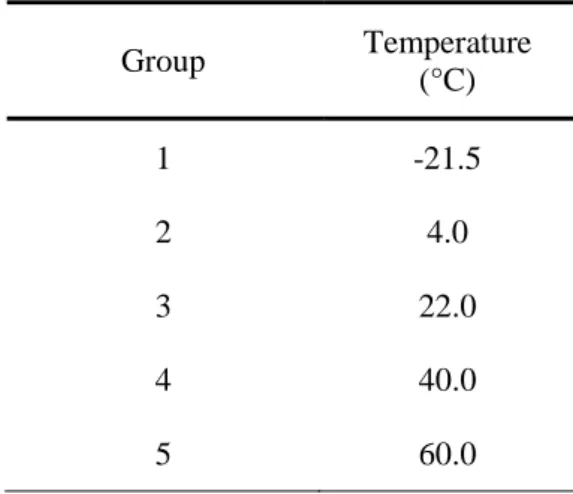
For this experiment, five groups of five dosimeters in each were prepared from a third batch. By accident one dosimeter was destroyed so that one group only consisted of four dosimeters (group 4 in Table 1). All dosimeters were irradiated to 10 Gy for the homogeneity test. After homogeneity verification, the five groups were stored in airtight cans in different temperatures for 24 hours, table 1.
Table 1. Storage temperatures for the five groups
of dosimeters used in the experiment.
Group Temperature (°C) 1 -21.5 2 4.0 3 22.0 4 40.0 5 60.0
The different temperatures were achieved using a conventional freezer (-21.5 °C), a conventional refrigerator (4.0 °C) and two convection ovens (40 °C and 60 °C). The reference group was stored in a desiccator in room temperature (22.0 °C). All dosimeters were stored in air-tight and UV-protected cans and all temperatures were monitored and logged (EasyLog USB Version 5.30, Lascar Electronics Limited, Wiltshire U.K.). Since the temperature varied in cycles in the freezer (-22°C to -21°C) and the refrigerator (2.5°C to 5.5°C), a mean value was taken as the most representative. Readout was performed 12 hours after the end of the temperature treatment, allowing the dosimeters to rest together at room temperature in the desiccator cabinet overnight.
2.6 Practical example
In the experiments presented above (except for the case of testing the influence of storage temperature in 2.4) the dosimeters were kept in a desiccator between irradiation and readout. For mailed dosimetry systems this is not always possible. One practical test of the stability of the dosimetry system when the air humidity was controlled only by keeping the dosimeters of the batch in airtight, UV-protected cans
was performed. One batch of dosimeters, to be used in another experiment, was transported to a clinic in Europe by air (carried in hand-luggage in their cans to avoid storage in extreme temperatures). To control signal stability, four groups of dosimeters from the batch were irradiated to two different dose levels (7 Gy and 20 Gy), monitored using a Farmer-type ionization chamber (NE 2571) as described in section 2.2. Two of the groups were irradiated to one dose level each before transport and the other two when the dosimeters returned. The time separation between the irradiations before and after the transport was five days. The mean signal of the dosimeters in the group irradiated before the transport was normalized to the corresponding mean signal of the dosimeters in the group irradiated after transport. The mean signal of each group was also normalized to the signal recorded by the ion chamber at irradiation (corrected for temperature and pressure).
2.7 Uncertainty evaluation
Evaluation of uncertainties followed the “Guide to the expressions of uncertainty in measurements” (GUM) (International Organization for Standardization, 1995).
Results of the fading measurements were obtained as the quotients of the mean signal,
M
, from a group of n dosimeters, normalized to the signalM
ICfrom the ionization chamber at the irradiation of the group in the PMMA phantom, for dosimeters irradiated t days before readout and from dosimeters irradiated immediately prior to readout. The relative standard uncertainty was calculated as2 0 0 2 2 0 , 0 , 2 0 0 2 , , 2 0 0
)
(
)
(
)
(
)
(
)
(
)
(
/
/
t t t t t IC t IC t t t IC t IC t t t IC t IC t IC t ICM
M
u
M
M
u
M
M
u
M
M
u
M
M
u
M
M
u
M
M
M
M
M
M
M
M
u
The last equality follows since the ion chamber was used as a monitor and the signal was not converted to absorbed dose. The (type A) uncertainty in the ion chamber electrometer reading only depends on the reproducibility of the equipment and was negligible (standard uncertainty = 0.002‰) compared to that in the dosimeter signal.
The relative standard uncertainty in the signal M from a single dosimeter is given by the relative standard deviation determined from the spread of the signals of the dosimeters in the homogeneity test. Using the mean value of n dosimeters from the same batch means that the type A standard uncertainty
is reduced by a factor of . The combined expanded uncertainty is given with a coverage factor k = 2
corresponding to a 95% confidence level.
3. Results
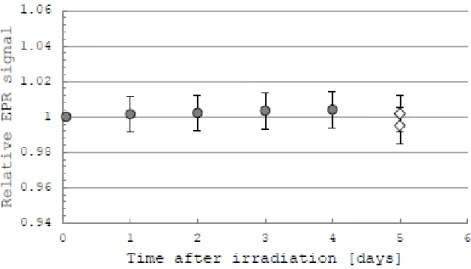
The mean signal from each group (five dosimeters in each) was normalized to the mean signal of the group irradiated on the same day (5 days experiment) or the day before (30 days experiment) the readout of all dosimeters, and is shown in figure 1 for the 5 days experiment and in figure 2 for the 30 days experiment. Included in figures 1 and 2 are also the results from the practical example (section 2.5). Results for two dose levels are shown. For each dose level, the quotient between the mean signals of the group irradiated before transport is normalized to the mean signal of the group irradiated after transport. Error bars show the combined expanded (k = 2) uncertainty corresponding to a 95% confidence interval.
For the batches of dosimeters used in these experiments the relative standard deviation of the dosimeter signals in the homogeneity test was typically 0.8% (1 SD). For the normalized mean signal of 5 dosimeters (section 2.6), the standard uncertainty was then 0.5% and the combined expanded (k = 2) uncertainty 1%, shown as error bars in figures 1-3.
Figure 1. EPR signal (mean value of 5 dosimeters) as function of time after irradiation (filled circles). Values are normalized to the EPR signal measured 1 hour after irradiation. Diamonds show results of the practical example described in section 2.5. The two values show results for the two dose levels used. Error bars show the combined expanded (k=2) uncertainty corresponding to a 95% confidence interval.
Figure 2. The EPR signal (mean value of five dosimeters) as function of time after irradiation (filled circles). Values are normalized to the EPR signal measured 1 day after irradiation. Diamonds show results of the practical example described in section 2.5. The two values show results for the two dose levels used. Error bars show the combined expanded (k=2) uncertainty corresponding to a 95% confidence interval.
As shown in figures 1 and 2, no post-irradiation fading could be detected within the limits (1%) of uncertainty.
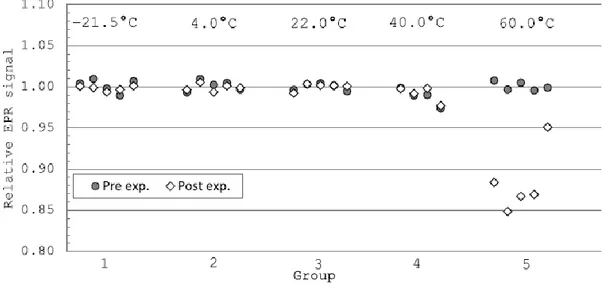
Results of the storage temperature experiment (section 2.4) are shown in figures 3 and 4. Signal values are normalized to the mean signal recorded for the group of dosimeters stored at room temperature (22.0 °C) in the desiccator (33% RH) in both read outs of the dosimeters. To demonstrate the robustness of the dosimetry system, the quotients of the EPR signals before and after temperature treatment for each individual dosimeter is shown in figure 4.
Figure 3. EPR signals (mean values for the dosimeters in each group) after storage of the dosimeters during 24 hours in different temperatures as indicated. Values are normalized to the EPR signal recorded for group 3 in both readouts. Group 3 was stored in the desiccator in room temperature. Error bars show the expanded (k=2)
combined uncertainty corresponding to a 95% confidence interval. Error bars for group 5 was determined using the spread of values in this group after storage in 60°C (see figure 4).
No significant fading (within 1%) of the post-irradiation signal was seen for the dosimeters stored at temperatures in the interval -21.5°C to 40.0°C. All dosimeters stored in the highest temperature, 60°C, showed a significant signal decrease, ranging from 4% to 14%. This is explained by liquefaction of the paraffin, which also could be seen as a change in transparency of the dosimeters.
Figure 4. EPR signals before the temperature treatment (filled circles) and after (diamonds) for individual dosimeters in the batch. The signal values for the two series were normalized to the mean value of the EPR signals of the 5 dosimeters in group 3 for the respective readouts (reference dosimeters stored in room temperature).
Figure 4 shows that the spread in signal values between the dosimeters in the batch is considerably larger than the spread in signal values for the same dosimeter in repeated readouts except for the dosimeters stored at 60°C where the stability of the dosimeters was lost due to liquefaction of the paraffin.
4. Discussion
The experimental method used to measure signal fading in this work is based on several irradiations at different time intervals and only one readout. It is a new method for determination of signal fading, based on the same principles as our standard accurate EPR measurements without external reference (Gustafsson et al., 2008; Antonovic et al., 2009; Adolfsson et al., 2010). The absence of a reference sample enables a narrower sweep width and hence more sampling points concentrated over the signal
of interest (i.e 3 mT for lithium formate compared to 10.5 mT for Mn2+/MgO reference). Also, several dosimeters are investigated for signal fading, which leads to decreased uncertainties.
Initial clinical measurements (Gustafsson et al., 2008; Antonovic et al., 2009) have shown that the EPR dosimetry system using lithium formate can be used to determine absorbed dose to water with high accuracy. The dosimetric properties of lithium formate and the robustness of the system make it suitable as a transfer dosimetry system in a clinical radiotherapy audit programme. Gustafsson et al. (2008) showed that the lithium formate EPR system can determine absorbed doses to water in an IMRT phantom above 3 Gy within a combined expanded (k = 2) uncertainty of 2.5% . In clinical audits, a common pass criterion in reference conditions is that the measured and the planned dose values should agree to within 5% (Izewska and Andreo, 2000). In order to ensure that the tolerance level is fulfilled; the signal fading should not be larger than about 1%, taken into account the uncertainties of the dosimetry system.
Within the reported uncertainties, no signal fading could be observed in lithium formate dosimeters during one month after irradiation. Except for the time during irradiation and readout, the dosimeters were stored at a constant humidity of 33% and protected from UV light. The result from this experiment is comparable with those found by Vestad et al. (2003) (no signal fading during one week after irradiation). Komaguchi et al. (2007) showed a decrease of approximately 4% in signal intensity from irradiated lithium formate kept in sealed tubes during the first two months but in the time period ending five days after irradiation no conclusions about signal fading could be drawn.
Dependence of storing temperature was only observed for the highest temperature, 60°C, where a significant drop of signal intensity was shown. The cause for this decrease was the melting of the paraffin binding substance. The melting point for paraffin wax lies between approximately 38.0 °C (C20H42) and 74.7 °C (C35H72) depending on its composition (Hodgman et al., 1960-1961). When paraffin starts to liquefy, the crystal structure of the dosimeter material changes and this is suspected to cause the decrease of the EPR signal.
Considering that the dosimeters have been exposed to different storage conditions, the reproducibility of the dosimeter readings demonstrated in figure 4 (except for group 5, 60°C) is worth noticing. The spread in signal values between the dosimeters in the batch is considerably larger than the spread in signal values for an individual dosimeter in repeated readouts. The figure nicely demonstrates the robustness of the dosimetry system. Uncertainty of measurements could possibly be further reduced by taking into account the individual sensitivities of the dosimeters allowing still more sensitive fading experiments.
5. Conclusions
Signal fading in lithium formate was determined using a new experimental method based on several irradiations separated in time and one readout session. No signal fading (within uncertainty limits of ±
1%) in lithium formate dosimeters could be detected up to one month after irradiation. Varying temperature conditions within a reasonable range (between -20°C and 40°C) did not either have any significant impact on signal fading. At temperatures above 40°C the paraffin binding material melted and signal stability was lost. The dosimeters are thus reliable to use in controlled clinical measurements and the dosimetry system a well-suited candidate for transfer dosimetry in clinical audits.
Acknowledgements
This work was supported by grants from the Swedish Cancer foundation (CF), contract number 10 0443 and FORSS contract number 86231. The authors would like to thank Laura Antonovic for valuable discussions before starting this project.