Institutionen för systemteknik
Department of Electrical Engineering (ISY)
Examensarbete
Design of Autonomous Low Power Sensor for Soil Moisture
Measurement
Master thesis performed at Electronics Systems of
ISY in Linköping University
by
Zubair Ahmed
LiTH-ISY-EX--12/4639--SE
Linköping 2012
Department of Electrical
Engineering Linköping University
SE-581 83 Linköping, Sweden
Linköpings tekniska högskola
Institutionen för systemteknik
SE-581 83 Linköping
Design of Autonomous Low Power Sensor for Soil Moisture
Measurement
Master thesis performed at Electronics Systems of
Linköping Institute of Technology
by
Zubair Ahmed
LiTH-ISY-EX--12/4639--SE
Supervisor: Peter Johansson
Examiner: Dr. J Jacob Wikner
TABLE OF CONTENTS
Chapter 1 introduction...15
1.1 Introduction...15
1.2 Problem Description...15
1.3 Project Background...15
1.4 Structure of the Report...16
1.5 Results...16
Chapter 2 Literature Review...17
2.1 Introduction...17 2.2 What is droughts...17 2.2.1 Impact of droughts...17 2.2.2 Droughts Types...20 2.2.2.1 Meteorological Drought ...20 2.2.2.2 Agricultural Drought ...20 2.2.2.3 Hydrological Drought ...20 2.2.2.4 Socioeconomic Drought ...20
2.3 Sensor and Sensing...21
2.4 Classifications and Examples of Sensors...22
2.5 How Sensor Works...22
2.6 Sensor Node Architecture ...23
2.7 Communication Interfaces...24
2.7.1 I2C (Inter-Integrated Circuit)...24
2.7.2 SPI (Serial Peripheral Interface)...26
2.7.3 USB (Universal serial Bus) ...26
2.8 Wireless Sensor Network...27
2.8.1 Sensor Network Protocols...27
2.8.1.1 The architecture of Protocol Stack ...28
2.8.2 IEEE 802.15 Standard Family...28
2.8.3 IEEE 802.15.4 protocols...30
2.8.4 Data Centric protocols...30
2.8.5 Wireless Sensor Network Topologies...34
2.9 ZigBee...34
2.10 6LoWPAN...35
2.11 ONE NET...35
2.12 DASH7...36
2.13 IEEE 1902.1 (RuBee)...36
2.14 Soil Moisture Measurements Techniques...36
2.14.1 Dielectric Constant Soil Moisture Probes...36
2.14.2 Resistive Soil Moisture Sensor...38
2.15 Currently Available Low Power Sensors for Soil Moisture...40
2.15.1 VH400 Series Soil Moisture Sensor...40
2.15.2 EC-5 Soil Moisture Sensor...41
2.15.3 Arduino Compatible Soil Moisture Sensor...42
2.16 Conclusions...43
Chapter 3 Implementation of Low Power Sensor Network...45
3.1 Introduction...45
3.3 System outline...46
3.4 Sensor Power System...47
3.4.1 Power Management Unit (PMU)...47
3.4.1.1 Solar Cell...48
3.4.1.2 Solar Cell V-I Characteristics...49
3.4.1.3 Supercapacitor...50
3.4.1.4 Battery Power...51
3.4.1.5 Switching Power Multiplexer...53
3.4.1.6 Voltage Regulator...54
3.5 Sensor Unit...55
3.5.1 Selected Component...56
3.5.1.1 Weight Fork/Fork Coupler...56
3.5.1.2 Microcontroller (MCU)...57
3.5.1.3 Real Time Clock (RTC)...57
3.5.1.4 ZigBee Module...57
3.6 Master unit...57
3.6.1 Master Unit Operation...58
3.6.1.1 Multiplexer...59
3.6.1.2 Memory Card...59
3.7 Conclusions...59
Chapter 4 Hardware Setup and Results...61
4.1 Introduction...61
4.2 Previous system...61
4.2.1 Soil Resistance ...62
4.2.2 Real Time Clock (RTC)...62
4.2.3 SD Memory Card...63
4.2.4 Bluetooth Module...64
4.3 PMU Hardware Setup...65
4.3.1 Measurements...66
4.3.2 Operation and Results...68
4.4 Complete system...74
4.5 Conclusions...74
Chapter 5 Discussion and Future Work...75
5.1 Discussion...75
5.2 Future Work...77
Acknowledgment
In completing of this project, first I would like to thanks to my examiner Dr. J Jacob Wikner for his great motivations, help and guidance in the research for this thesis project.
I would also like to thank to my brother Dr. Sajid Ahmed for his support during the project and for his help in troubleshooting of the hardware.
And also many thanks to my supervisor Peter johansson and Mr. Irfan Kazim for helping me in setup the hardware design and for their guidance in purchasing the components for this project.
Abstract
Drought is the most severe disaster compared to other disasters in human civilization and their impacts are serious which can cause hungur, thrist, food shortages, loss of livestock directly effects the human life. The main objective of this project is to develop an early warning system (EWS) [3] for drought indices by using wireless sensor networks (WSNs) which is the only way forward for an on-site monitoring and validation of locally defined drought indices [3].
The designed wireless sensor network (WSN) consisting of a sensor unit, a master unit and a sensor power management unit (PMU). The sensor unit measures the moisture of the soil and transmitt the measured data through ZigBee module to the master unit. A real time clock (RTC) is also used in the sensor unit which records the information of second, minute, hour, day, month of day and year about when or what time the measurement taken. The master unit consisting of a SD-card and Bluetooth module. SD-SD-card is used to store measured data from other sensor units and it is possible to take out the reading of measured data from the master unit by accessing the SD-card via Bluetooth inside the master unit to a PC or a smartphone mobile.
To manage the power in the sensor unit and to make sensor alive for several years, the power management unit (PMU) manages the power level between two energy storage buffers (i.e., a supercapacitor and a Li+ ion battery) for a sensor node.
ILLUSTRATION INDEX
Figure 1: Map of dryland basins of South Africa...18
Figure 2: The variability of rainfall at churchhill dam from 1951 to 2009 focusing on drought...19
Figure 3: The interrelationship between different types of droughts, longer the drought greater the dependency will occurs of managing the available reservoirs...21
Figure 4: Sensing operation... 23
Figure 5: Basic sensor node architecture... 24
Figure 6: Standard communication Protocol in I2C bus...25
Figure 7: The new protocol in I2C bus showed with the first 2 bytes of a transfer and the 10-bit address...25
Figure 8: SPI Communication Examples... 26
Figure 9: Overview of a wireless sensor network...27
Figure 10: Architecture of sensor network's protocols...28
Figure 11: IEEE 802.15.4 and related protocols [16]...30
Figure 12: Example Address Centric (AC) routing...31
Figure 13: Example Direct Centric (DC) routing...32
Figure 14: Impolsion problem in nodes... 33
Figure 15: The overlap problem in nodes. A and B are covering an overlapped area and C is getting the same copy of data form A and B [17]... 33
Figure 16: Network topologies in IEEE 802.15.4...34
Figure 17: ZigBee stack layer... 35
Figure 18: TDR sensor... 38
Figure 19: Various soil moisture sensing pins. A showing insulated pins, B showing non-insulated pins and C showing stainless steel [29]... 39
Figure 20: VH400 series soil moisture sensor probe...41
Figure 21: EC – 5 soil moisture sensor... 42
Figure 22: Arduino compatible coil moisture sensor...43
Figure 23: Block diagram of proposed sensor network system...46
Figure 24: Block diagram of Power Management Unit (PMU). ...47
Figure 26: Equivalent circuit of a solar cell...49
Figure 27: I-V Characteristics of a Solar Cell...50
Figure 28: A supercapacitor of 1 Farad...51
Figure 29: Li+ ion rechargeable battery...52
Figure 30: Circuit diagram of Li+ ion battery charger controller...53
Figure 31: Switching power multiplexer circuit diagram...54
Figure 32: Voltage regulator circuit diagram...55
Figure 33: Systematic block diagram of the sensor unit...56
Figure 34: Block diagram of master unit...58
Figure 35: Samples of dry and moist soil in the black box and the connections is showing the measurement of current flowing through the soil samples...62
Figure 36: I²C transmission (The image taken from the channel analyzer)...63
Figure 37: SD-card pins are showing connections to the MCU for SPI communication protocol...64
Figure 38: Sensor's Power Management Unit (PMU) hardware setup...66
Figure 39: Low battery function of MAX1795...70
Figure 40: Charging of supercapacitor...71
Figure 41: Charging of nokia battery with MAX1811...72
Figure 42: Switching between supercapacitor and Li+ion battery by TPS2113PW...73
Figure 43: Example of duty cycling activity and power consumption of a sensor node...80
Figure 44: Master unit schematic diagram... 81
Figure 45: Sensor unit schematic diagram...82
INDEX OF TABLES
Table 1: Classification and examples of sensors...22
Table 2: IEEE 802.15.4 and later communication standards and their properties...29
Table 3: Pins functions for the memory card used in figure 37 to connect to the microcontroller...64
Table 4: Identification packages to communicate with MCU...65
Table 5: Typical power consumption values of sensor unit's components...66
Table 6: MAX1795 component values... 69
Table 7: MAX1795 operating modes and their output results...70
Table 8: MAX1811 components values... 71
Table 9: TPS2113PW components values... 72
Table 10: Modules and power ICs with part numbers and prices used in sensor, master and power management unit... 77
TABLE OF ACRONYMS AND ABBREVIATIONS
Acronym Spell-out Explanation Reference
EWS Early Warning System A system which warning about
droughts level SIDA
SD Static DRAM Data storage device
WSN Wireless Sensor Network
--GSM Global System for Mobile Communication technology
RTC Real Time Clock System Clock
DAC Digital to Analog Converter Converts digital signal to analog ADC Analog to Digital Converter Converts analog signal to digital
WSAN Wireless Sensor and Actuator Network -- [1]
SPI Serial Peripheral Interface Communication protocol I2C Inter Integrated Circuit Communication protocol
USB Universal Serial Bus Communication protocol
CS Chip Select Selection of the unit when using
SPI communication protocol MISO Master Input Slave Output Data line master and slave in
SPI communication protocol
MOSI Master Out Slave Input
--SCLK/SCK Serial Clock System clock
RF Radio Frequency Radio signal
MAC Medium Access Control OSI model layer
WPAN Wireless Personal Area Network
--LR-WPAN Low Rate-Wireless Personal Area
Network
--PHY Physical Layer OSI model layer
VLC Visible Light Communication Communication technology
[16]
FFD Full Function Device Sink Node [16]
RFD Reduced Function Device End Node [16]
BPSK Binary Phase Shift Keying Data modulation technique O-QPSK Orthogonal Quadrature PSK Data modulation technique AC routing Address Centric routing WSN routing protocol DC routing Data Centric routing WSN routing protocol SPIN Sensor Protocol for Information via
Acronym Spell-out Explanation Reference
LEACH Low Energy Adaptive Clustering
Hierarchy WSN routing protocol
SSP Security Service Provider ZigBee Stack Layer [13]
ZDO ZigBee Device Object ZigBee Stack Layer [16]
FSK Frequency Phase Shift Keying Data modulation
RFID Radio Frequency Identification [16]
EMI Electromagnetic Interference Interference rubee.com
EMC Electromagnetic Compatibility rubee.com
TDR Time Domain Reflectometry Soil moisture measurement technique
FDR Frequency Domain Reflectometry Soil moisture measurement technique
PCB Printed Circuit Board
VWC Volumetric Water Contents Water Contents [31]
GWC Gravimetric Water Contents Water Contents [31]
Li+ ion Lithium Ion Battery chemical type
NiMH Nickel Metal Hybrid Battery chemical type
NFC Near Field Communication Communication protocol
PV Photovoltaic Photons radiation effect
MPP Maximum Power Point Solar cell maximum voltage
point EH-WSNs Energy Harvesting Wireless Sensor
Nodes
ESR Equivalent Series Resistance Resistance
Ni-Cd Nickel Cadium Battery chemical type
MCU Microcontroller
BCD Binary Coded Decimal Encoding technique
UART Universal Asynchronous Receiver/Transmitter
ACK Acknowledgment Communication Status
NACK No Acknowledgment Communication Status
SoC System on Chip
PMU Power Management Unit A unit which manage power in a
Chapter 1 Introduction
1.1 Introduction
Today the wireless sensor networks (WSNs) have became the most dominant and promising technology. Since this technology has been involved in every field of science and technology such as, environment monitoring, medical bio-sciences, chemical industries, industrial automation, military projects, security, home automation, agriculture, traveling and transportation, electronic industries and weaponry.
A wireless sensor network links the physical sens to the digital world for capturing and revealing physically phenomena and converting these into a form that can be processed, stored and acted upon it [1].
The work performed in this project is the development of an independent low power, maintenance free and a long life sensor module capable of measuring soil moisture. The sensor is capable to measuring moisture level in the soil by means of resistance in the soil and able to receive and transmit the measured quantity of moisture of soil to the other sensors. A master unit has also been designed which receive data from other sensor units. The master unit contain a SD memory card which stores measured data from large number of sensor units. Therefore, eliminating the need of internal ROM inside the sensor units. It is also possible for measured data to copy it from the master unit to a PC or a mobile using Bluetooth module to process it further and for measurements.
1.2 Problem Description
Drought is the most complex and a kind of silent disaster among other natural disasters and it severely affects the people's life than any other natural disasters [2]. The impact of drought is that it is the main cause of destroying field corps which leads to the problems of acute food shortage, livestock, hunger and even starvation and other health issues [3]. Therefore, the main objective of this project is to develop a low cost, energy efficient, low power sensor network, monitoring the soil moisture in the field corps as an early warning system for drought (EWS) [3]. The sensor network should able to provide dense spatial information about water deficit and also should able to indicate specified threshold level of dryness in the chosen area and send an alert for to mitigate the problems of drought in the field corps.
1.3 Project Background
This thesis work continued from the last project ''A low power sensor module for soil moisture measurement with a focus on Bluetooth'' performed at ISY Department of Linkoping University which was the project mission from SMHI, SIDA (Swedish International Development Cooperation
Agency) and CSPR (Centre for Climate Science and Policy Research) in Norrköping (Department of Water) [4]. The project original name was ' Local-scale early warnings for drought – can they
increase community resilience?'.
The scenario chosen for this project was the limpopo located in South Africa around the limpopo river which spans four countries, South Africa, Mozambique, Botswana and Zimbabwe covering the large area for irrigation and grazing. The project aim was to design a low power self power management prototype wireless sensor network as an early-warning system (EWS) [3] for monitoring and validation of locally defined drought indices [3] in the field corps which should be a robust, energy efficient, self power managing, capable of running for several years without maintenance and must cope with natural stresses. The system design consisting of a sensor module called sensor unit measuring the soil moisture, main unit called master unit that handle with the data from the multiple sensors and a self power management unit (PMU). A single sensor unit may performs various tasks such as measurement of soil moisture, sending data to the main unit and collecting data from the other sensor units via a ZigBee module. A master unit which collects data from other sensor units can also be communicate with a PC or a mobile using Bluetooth module to store and processing of data.
1.4 Structure of the Report
The report is describing, first an introduction to the project and problem description then literature review and theory with some fundamental concepts of sensor and wireless sensor networks and then a survey to WSN protocols. In the final portion the report is describing about hardware design of the project, measurements and results and then discussion and future work.
Chapter 1 provides an introduction to the project work and its background with problem description. Chapter 2 defines droughts, impact of droughts and drought types, some basic definitions of sensing and sensors, soil moisture measurement techniques, sensor architecture, communication interfaces, wireless sensor network and WSN protocols, currently available low power sensor modules and then conclusion. Chapter 3 defines the hardware implementations of low power sensor module, includes the implementation of the sensor power management system and implementation of sensor and master unit with detail and functions of their components describing methods and interfaces. Chapter 4 gives the information about hardware setup and results and finally Chapter 5 is about the discussion and future work.
1.5 Results
The protoype design of wireless sensor network (WSN) consists of a self power managing unit (PMU), a sensor unit which measures the moisture of the soil and a master unit which gather the measured data from other sensor units. Each unit have been designed and tested individually on a breadboard. A PCB of prototype wireless sensor network (WSN) is also designed which integrates all three systems (i.e.; sensor unit, master unit and sensor power management unit). The sensor and master units have been designed and implemented in the previous work of this project. In this report we have developed a sensor power source which is a self power managing system and an energy harvesting source for an autonomous sensor, capable of running for many years without any maintenance.
Chapter 2 Literature Review
2.1 Introduction
The literature review for this project was started from the problems and impacts caused by the droughts in the field corps. The drought level and its condition would be monitor using wireless sensor by measuring the moisture level in the soil using sensors. Different basic terminologies have been taken in the literature review for the project work such as, drought and droughts types, sensing and sensors, wireless sensor network and WSN architecture, WSN standards and its protocols and network topologies, soil moisture sensing methods and currently available low power soil moisture sensors.
2.2 What is droughts
Drought has no specific or proper definition. It is hard to define drought, because droughts having different natural properties varies with different areas of the world [5]. It varies as climate changes such as reduced rainfall and level of underground water varies from region to region [6]. It happens almost every year in many area of the world [5] and remains for a season. Drought's impacts are severe to human life such as acute food shortage and loss of livestock [3]. In general, drought caused by shortage of rainfall over an extended period of time, usually for a season (i.e., from 5 to 8 months) resulting in water shortage for agricultural or for an environmental sectors [6]. It is very important to make difference between drought and aridity. Because, the aridity is the permanent state of low rainfall in certain areas on earth such as desert and drought is seasonal which occurs temporarily [5].
2.2.1 Impact of droughts
Drought severely affects the livelihood of million of peoples around the world. A serious drought can cause a disaster-triggering agent that exacerbates social and economic problems [7] such as, food shortages, loss of livestock due to depletion of pasture and water resources as well as cause to health issues. The impacts also cause school drop-outs and migration of people from rural to urban areas [3] and reduces the overall livelihood security of a society [7].
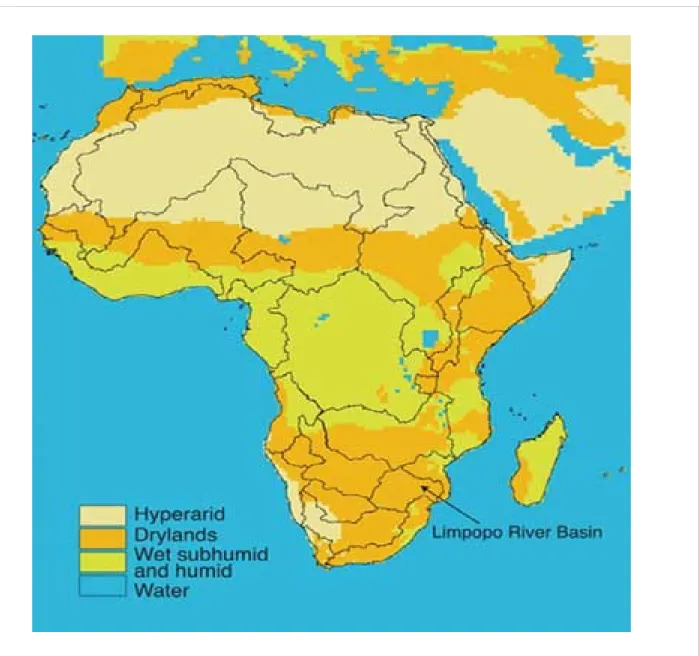
As the chosen scenario for the thesis work was the limpopo river basin located in South Africa, where droughts affects the livelihood of 200 million people living out there [7]. Therefore, the study done in this project is about droughts mainly focused on the areas of South Africa where droughts problems are severe than other countries relatively and it is generally acknowledged that low resources of agriculture is no longer capable of meeting the livelihood demands due to rising populations in these fragile dryland environments of South Africa [7]. Figure 1 is showing the map of effected areas of South Africa due to fragile dryland environments.
The drylands is the common name of arid, semiarid and dry subhumid ecosystems that are characterized by low and irregular rainfall and high evapotranspiration and cyclical droughts. In areas with summer rainfall, arid zones typically receive less than 400 mm of rainfall annually, while semi-arid and dry subhumid zones receive about 400-600 mm and more than 600 mm respectively [7].
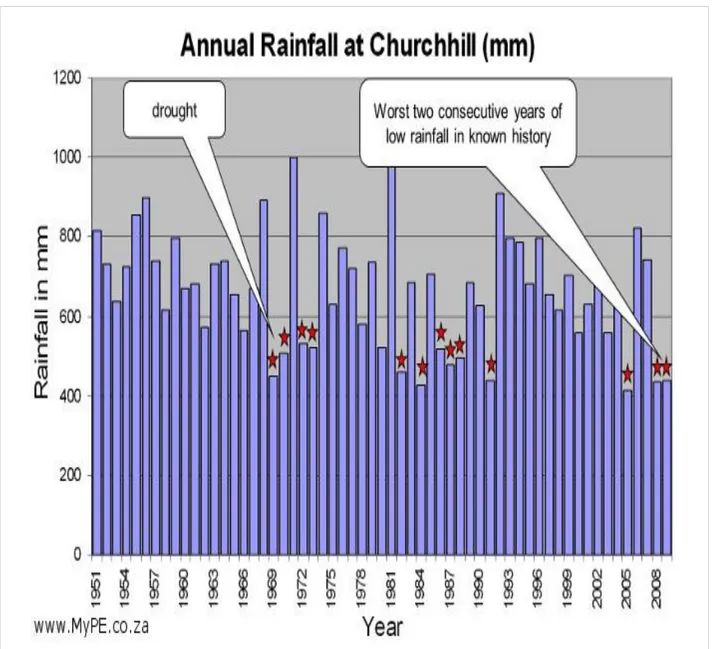
The irregular rainfalls is the major fact of great variability in the climate of South Africa. The chart in figure 2 shows the series of consecutive rainfall in eastern cape at churchhill dam of South Africa from year 1951 to 2009 [8]. The series of years has been shown horizontally and vertically it shows the rainfall in millimeter (mm).
The impacts brought by drought are devastating. The year 1992 was the most widespread droughts over last 45 years. Last lowest consecutive rainfall was from 2008 to 2009 [8].
2.2.2 Droughts Types
There are four types of drought which have been discussed in the section as, • Meteorological Drought
• Agricultural Drought • Hydrological Drought and • Socioeconomic Drought
The four types of droughts are explained as under,
2.2.2.1 Meteorological Drought
Meteorological drought is defined as, it is a predetermined level of precipitation by a precipitation deficiency threshold over a predetermined period of time [9] on the order of months or years during which the actual moisture supply at a given place consistently falls below the climatically appropriate moisture supply [10]. However the definition varies across different areas where the normal rainfall varies.
2.2.2.2 Agricultural Drought
Agricultural drought defines how agriculture is effected by drought. It focuses on rainfall lacks, the difference between actual and potential evapotranspiration (the sum of evaporation and transpiration from plants), soil moisture of lacks or reduced groundwater. This is compared to how much water the crops requires or how much water the cattle need. Agricultural drought usually occurs during or after a meteorological drought but before hydrological drought [5] [6] [7].
2.2.2.3 Hydrological Drought
Hydrological drought cause due to deficiency of surface or subsurface water supplies [10] such as lack of water reservoirs, lakes and groundwater. Hydrological drought is often lagging in measurement compared to other drought indicators [10] as levels in groundwater or lakes not directly effected by rainfall [5] [6].
2.2.2.4 Socioeconomic Drought
Socioeconomic drought deals with, when lack of water affects the quality of life and health of people, when demand exceeds the supply of a financial product that is dependent on water, then the conditions of water resources, livestock feeds, hydropower define the socioeconomic drought [5] [6].
Figure 3: shows the relationship between the different types of drought. Meteorological droughts occur more frequently than of the rest because it can take several months before the precipitation of the lack effects the water supplies and groundwater.
2.3 Sensor and Sensing
A sensor is an electronic device which sens the physical phenomena or physical quantity emits from a object or material or from a process such as, heat, cold, pressure, movement, light waves, sound waves, change of states of a process includes sensing of hundreds of physical quantities or processes. An object performing such sensing tasks is called sensor. We can refer the phenomena of sensing by taking an example of human senses such as, a human body equipped with touching and remote sensing. The feeling of the heat, cold, moisture of an object or material, bitter, sweet, salt and so on. All are the examples of touching sensors and the sensing that are able to capture the optical information from the environment (eyes), acoustic information such as sound (voice hearing by ears) and smells (sensing by nose) are the examples of remote sensors as they do not
Figure 3: The interrelationship between different types of droughts, longer the drought greater the dependency will occurs of managing the available reservoirs.
need to touch the monitored object to gather the information. From a technical perspective, a sensor is a device which translates physical parameters or events in the physical world into electrical signals that can be measured and analyzed. Or simply a sensor is a transducer which converts energy from the physical world into the electrical energy which is able to pass to a computing system or to a controller [1].
2.4 Classifications and Examples of Sensors
The choice of selecting a sensor for an application depends on the physical property of an object to be monitored for example such properties include temperature, pressure, light, sound, movement, moisture or humidity [1] and so on. Table 1 shows the classification and some common examples of sensors according to their physical properties.
Type Examples
Temperature Thermistors & Thermocoupler
Pressure Pressure gauges & Barometers
Optical Photodiodes, Infrared sensors & CCD sensors
Acoustic Piezoelectric Resonators & Microphones
Mechanical Strain gauges, Capacitive Diaphragms & Piezoresistive cells
Motion Vibration accelerometers & Photo sensors
Flow Anemometers & Mass air flow sensors
Position GPS sensors & Ultrasound-based sensors
Electromagnetic Magnetometers
Humidity Capacitive and resistive sensors & MEMS-based humidity sensors
Radiation Ionization detectors, Geiger - Mueller counters
Table 1: Classification and examples of sensors.
2.5 How Sensor Works
As we discussed earlier a sensor is a transducer which transforms one form of energy into another form of energy (e.g., heat, radiations, light energy into electrical signals), in physical world this phenomena often referred to as process, system or plant [1]. A sensor may perform its operation based on sensing-conditioning-signal processing as shown in figure 4.
When a sensor sens a physical quantity from a process it gives us the response in the form of electrical signal and the resulting electrical signal is then fed to the signal conditioning, where variety of operations can be applied to the resulting signal to prepare it for further use such as, signal amplification and filtering to remove unwanted noise [1] and interference etc. In order to keep the information for observation that what we are measuring using sensors, the electrical signal is then converted into digital signal by using digital-to-analog converter ( DAC ) which is then understandable by a processor for further processing, storing and visualization [1]. For example a temperature sensor can convert the temperature corresponds to its measuring voltages (electrical signal). The ADC is used to measure the voltages and convert it to a digital number which is readable and understandable to a processor. The processor take the digital number, process it and calculate the temperature.
Modern sensor networks have complete feedback loop (i.e., include sensing and data acquisition) which allows them to directly control the physical world and called as wireless sensor and actuator network (WSAN) [1] which takes commands from the processing device (controller) and transforms these commands into input signals for the actuator, which then interacts with a physical process, thereby forming a closed control loop [1].
2.6 Sensor Node Architecture
A basic sensor node at least consist of four subsystems which defines the architecture of a sensor node. The sensor architecture defines the hardware design process of a sensor where the choice of hardware components plays important role in the cost, size and energy consumption [11]. A sensor node is the central elements in a wireless sensor network (WSN), the sensing, processing and communication take place via that sensor node [1]. The quality, size and frequency of the sensed data that can be extracted from the network are influenced by the physical resources available to the node. Therefore, the design process of a wireless sensor node is a critical step [2]. A sensor node may consist of the subsystems like sensor subsystem, processing subsystem, communication subsystem and the power subsystem as shown in figure 5 redrawn from [11].
All the units in the architecture are controlled by processing subsystem using appropriate communication protocols and data-processing algorithms and it is possible to extend the architecture by some additional functions which leads sensor to more capabilities like location awareness, mobility, energy replenishing system etc [11].
2.7 Communication Interfaces
In a sensor node all subsystems are connected to the processing unit as described in section 2.6. So choosing a right type of processor and subsystems interface technique plays vital role in performance and as well as in the energy consumption. The choice of communication interfaces between serial interfaces are mostly serial peripheral interface (SPI) and inter-integrated circuit (I2C) or some time universal serial bus (USB).
2.7.1 I
2C (Inter-Integrated Circuit)
I²C protocol developed by Philips Semiconductor over more than 20 years ago. It is a multimaster, half duplex and synchronous serial communication bus and has initially rate of 100 kbps (Standard-mode) but at present most of the components supports 400 kbps I²C transmission rate. The I²C has two modes of operating speed, Fast mode with a rate of 400 kbps and High speed mode (Hs-mode) with a transmission rate of 3.4 Mbps [1].
The easiest way to use I²C bus is a master and one or more slaves. This way master is in control of the bus and no arbitration (arbitration between two master devices) take place. The earlier versions of I²C bus was using 7-bit addressing which mean that, theoretically one can have 128 (27) connected devices. However, there are a number of reserved addresses (4 bits are reserved), which allowing 112 (i.e., 27-24) devices to be uniquely addressed, but later this turn out to be
insufficient due to the increasing number of devices. Now I2C using 10-bit addressing and this
makes it possible to have up to 1008 (i.e., 210-24) devices connected.
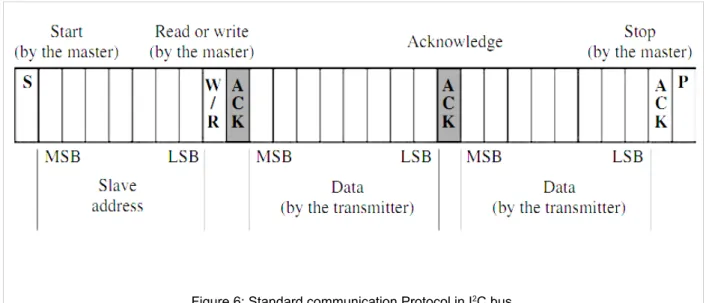
In the standard-mode protocol shown in figure 6, a master device flags the start condition (S) and transmits slave’s 7-bit address, then the master defines read/write interest. At the sane time, slave sends an acknowledgment (ACK). Afterward, the data transmitter sends a 1-byte (8-bits) data, which is then acknowledged by the receiver. If there is still data to be sent, the transmitter keeps on sending and the receiver keeps on acknowledging in return. Finally, the master raises the stop flag (stop condition) to signify the end of a communication. In the new protocol shown in figure 7, after the start condition (S), a leading 11110 introduces the 10-bit addressing scheme. The last two address bits of the 1st byte concatenated with the eight bits of the 2nd byte form the whole 10-bit address. Devices that only use 7-bit addressing simply ignore messages with the leading 11110 [1].
Figure 7: The new protocol in I2C bus showed with the first 2 bytes of a transfer and the 10-bit address.
2.7.2 SPI (Serial Peripheral Interface)
SPI is a high speed serial communication protocol developed in 1980s by Motorola. The SPI is full duplex synchronous serial bus. The SPI uses a master/slave relationship where the master starts communication and control the clock. Since it is a full-duplex transmission of data in both directions simultaneously so simplest approach is to use two units as, one master and one slave. The Chip Select (CS) must be used when there is only one slave to choose.
The data rate for SPI may come up to a few Mbps. The SPI has no form of addressing to the slave units without communicating with the device selected by SC. SPI uses four ports MOSI (Master Output Slave Input), MISO (Master Input Slave Output), SCLK and CS [12] [13].
Figure 8 is an example of the SPI transmission where both readings can be done in descending or rising edge of clock depending on the CPHA, and CPOL are set. The CPOL determines whether the clock signal to start high or low depending on the CPHA data is read by the rising or by falling edge. The figure 8 has shown two examples where CPHA = 0 then readout occurs at the falling edge and for CPOL = 1, the falling edge = 0 for CPOL [4].
2.7.3 USB (Universal serial Bus)
USB is the only communications protocol which is not wireless. If we use USB communication, the major advantage of USB protocol is that when connecting to a computer, this would not put any communicating load on the battery and result in low power consumption in master unit. The USB protocol is very fast as compared to previous methods of communication protocol. There are various versions of USB communication seperated according to their data rates.
USB Version Data Rate
USB 1.0 1.5 Mbps
USB 1.1 12 Mbps
USB 2.0 480 Mbps
USB 3.0 5 Gbps
2.8 Wireless Sensor Network
A wireless sensor network comprises of sensor nodes separated remotely in a geographically area. A wireless sensor network may contain more than hundreds and thousands of autonomic,self-organizing nodes and co-operating with each other to performs measuring, computing, data processing, environmental monitoring that gives someone the ability to observe and react to events in a specified environment. The sensors in the network connected directly to the controllers and processing stations using local area network (LAN) [1], and these sensors in the network can communicate wirelessly to a centralized processing station [1].
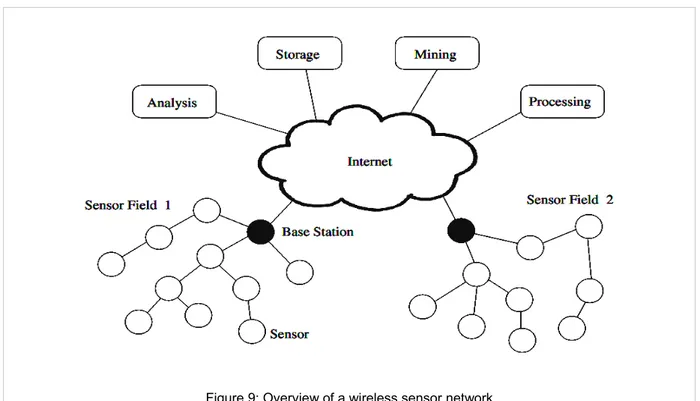
In a sensor network the capabilities of sensors may vary widely for example, a simple sensor node can have just single task of sensing physical phenomena and communicates information about observed physical environment. While a sensor with more enhanced features may have various tasks with more complex devices and different sensing techniques (e.g., acoustic, optical, magnetic) and may include with different communication capabilities such as, using ultrasound, infrared, or RF - based with varying data rate and latencies [1]. Figure 9 is showing a general view to a wireless sensor network.
2.8.1 Sensor Network Protocols
Sensor nodes share the communication channel to transmit their data to the other sensors with the certain set of rules called network protocols. These protocols have very strong impact on network's performance and efficiency. The recent design factors and challenges for wireless sensor network's protocols are the energy consumption, robustness to environment and scalability to number of
sensor nodes [14]. A well chosen plan for the use of protocols in a sensor network may leads to a better solution to these types of challenges such as, low latency, reduction in data transmission and receiving over the wireless channel (i.e., aggregation of data) and maximization of network life time (i.e., energy aware routing) will give hand to the energy depletion challenge [12]. Most of the sensor networks uses MAC (medium access control) protocol which considered to be as sub-layer of the data link layer of the OSI reference model [1].
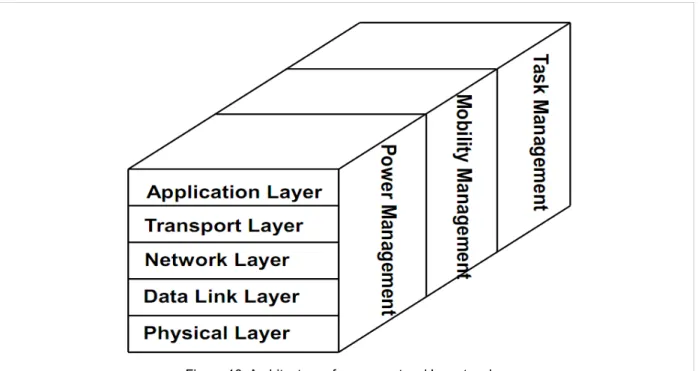
2.8.1.1 The architecture of Protocol Stack
The protocol stack of a sensor network defines the integration of power and routing (i.e., energy aware routing) and integrate the data with networking protocols (i.e., data aggregation) allows to communicate power efficiently through the wireless channel and give promising performance of the sensor nodes (i.e., task management plane) [14].
The figure 10 redrawn from [14] is showing the architecture of protocol stack made up of application layer, transport layer, network layer, data link layer, physical layer, power management, mobility management, and task management planes [14].
There are two major protocols mainly used in the Wireless Personal Area Network (WPAN) for low power and low data rates are, IEEE 802.15.4 and ZigBee stack [15].
2.8.2 IEEE 802.15 Standard Family
IEEE 802.15 family have many standards which are targeted at WPANs [16]. The targeted standards are,
• 802.15.1: Lower layers of Bluetooth 1.x protocol stack.
• 802.15.2: The standard include adaptive frequency hopping, power control, and techniques to avoid same frequencies in the network.
• 802.15.2: The standard include adaptive frequency hopping, power control, and techniques to avoid same frequencies in the network.
• 802.15.3: The starndard design for high speed WPAN for multimedia applications with data rates from 55 MB/s up to several GB/s.
• 802.15.4: The standard uses Physical (PHY) and Medium Access Control (MAC) layers for Low Rate-Wireless Personal Area Networks (LR-WPANs).
• 802.15.5: Mesh networking functionality for above WPANs.
• 802.15.6: Body Area Network (BAN) which operate in and around the human body. • 802.15.7: PHY/MAC for Visible Light Communications (VLC) [16].
Some later standards after IEEE 802.15.4 standard and their properties are listed below in table 2.
Standard Frequency (MHZ) Data rate (kbps) Protocol Layers Security Encryption PHY MAC NTWK TRP APS ACL
IEEE 802.15.4 868 20 - 915 40 - 2400 250 ZigBee1 - -6LoWPAN 2 - -DASH7 433 27.8 IEEE1902.1 (RuBee) 0.13 1.2
Table 2: IEEE 802.15.4 and later communication standards and their properties.
Supports Doesnot Supports
1 Uses IEEE 802.15.4 as PHY and MAC layers 2 Uses IEEE 802.15.4 as PHY layer
2.8.3 IEEE 802.15.4 protocols
The IEEE 802.15.4 is the standard from the IEEE family. IEEE 802.15.4 is relatively popular standard for Physical (PHY) and Medium Access Control (MAC) layers focusing on low data rate, low complexity and low power consumption Wireless Personal Area Networks (WPANs) [15], and therefore used as basis for other standards shown in figure 11.
The IEEE 802.15.4 standard supports three types of network devices: • Personal Area Network (PAN) coordinator
• Coordinators and • Devices
The PAN coordinator initiates the network and serves as gateway to the other networks. The coordinators collaborate with each other for data routing and network self-organization and the devices do not have the ability for routing the data and can communicate only with coordinators [16]. IEEE 802.15.4 standard defines two types of devices to reduces the complexity in a network, a Full Function Device (FFD) and Reduced Function Device (RFD) [16] that can communicate only with the FFD but the FFD can communicate with both RFDs and FFDs in the network. The IEEE standard 802.15.4 also supports two PHY layer options as, low frequency band 868/915 MHz uses BPSK modulation and high frequency band uses 2.4 GHz PHY uses Offset Quadrature Phase Shift Keying (O-QPSK) modulation [15] to transmit data.
2.8.4 Data Centric protocols
Data centric is routing protocol algorithm for unstructured wireless sensor networks where no: of sensors deployed randomly which is not a good plan to assign global identifiers to each sensor node due to those absolute number of sensors' deployment in a region and this lack of global identification between the deployed sensors makes difficulty in selecting a specific number of sensor nodes to be queried [17]. Therefore, data will be transmitted from each sensor node with significant redundancy which is an ine cient routing protocol and will take much time to deliver theffi
data. This problem of routing in a sensor network has led to data centric routing, where routes are created between the addressable nodes and managed in the network layer of the communication stack [17].
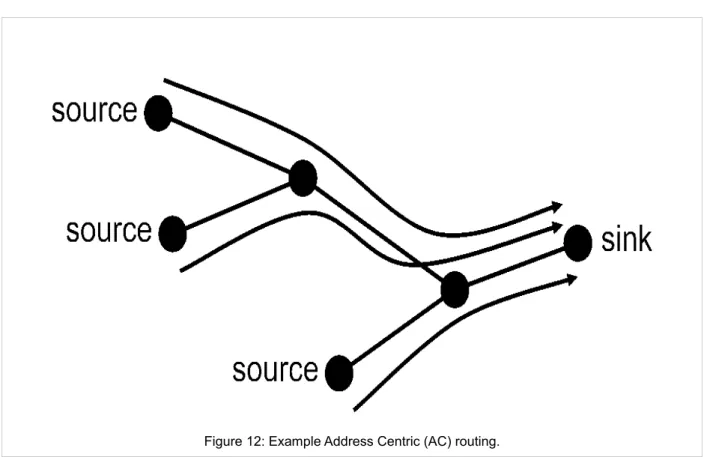
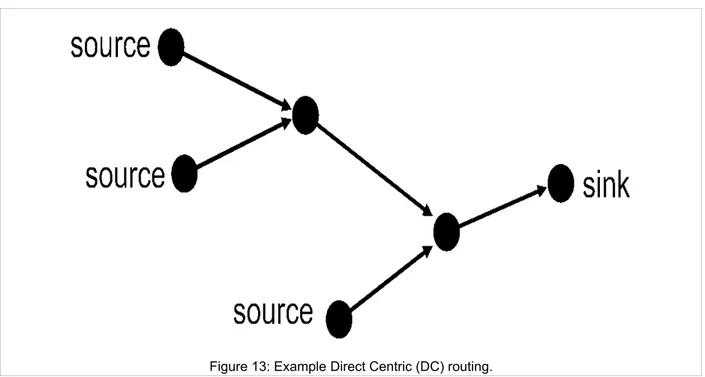
The data centric routing has further its two types as, • Address Centric ( AC) routing
• Data Centric (DC) routing
In Address Centric (AC) routing each sensor node sends its data independently to the sink shown in example of figure 12, where total no: of transmission are 8 as, 3 + 3 + 2 = 8 [18] which is not good enough in energy efficiency. On the other hand Data Centric (DC) routing form a data aggregation tree, where at every sensor node we wait for until all its sources have sent their data and then aggregate their data to send to the parent (sink). This way we reduce the total transmission from 8 to 5 in the same example as it has shown in figure 13 which saves energy compared to the Address Centric (AC) routing.
The first Data Centric (DC) protocol developed was ”SPIN” [19] which consider data negotitaion between nodes in order to reduce the transmissions and save energy [17]. Other similar protocols such as Direct Diffusion, LEACH [20] developed later and has became successful in Data Centric (DC) routing.
Similar concepts to the above protocols are gossiping and flooding [17]. The flooding is easy to implement but it has some drawbacks. Such as, in flooding protocol each sensor node receives and tarnsmitt data to all of its neighbors sensor nodes and this continues until the data reach to the desired location or until the maximum number of hops for the packet data is reached [17] cause large transmissions and energy hungry. The main darwaback in flooding are the impolsion and overlap problem shown in figure 14 and figure 15 redrwan from [17]. Impolsion occurs due to duplicated messages sent to the same node, and overlap problem is when two nodes sensing the common region and transmitt the same data information to the same neighbor, results in large transmission and consumes large amount of energy [17]. On the other gossiping is the enhanced version of flooding which solves the problem of impolsion by selecting a random node to transmitt information rather than broadcasting to all the neighbouring sensors. However this may produce delays in propagation of data through the deployed nodes [17].
Figure 14: Impolsion problem in nodes.
Figure 15: The overlap problem in nodes. A and B are covering an overlapped area and C is getting the same copy of data form A and B [17].
2.8.5 Wireless Sensor Network Topologies
The network topologies defines how FFDs and RFDs relate and communicate with each other. A 802.15.4 network always has one FFD device that acts as a PAN coordinator. The PAN coordinator initiates the network and operates often as a gateway to other networks [16] and communicates with other RFDs in the network using three common topologies as, star, peer to peer (also called mesh) and Tree (clustered) as shown in 16.
In peer to peer or mesh topology all the nodes or devices communiate with each other and without need of to go through a PAN device [21], but except of two RFDs with each other. In the peer-to- peer topology, an arbitrary array of connections can be created between a FFD and the PAN coordinator [15]. One advantage of peer-to-peer topology is that each peer device can be functioned as both a client and a server.
In star topology networking a PAN device act as centralized communications hub. All the communication between nodes, routed via centralized PAN coordinator [21] and each node can not communicate directly with each other in the star network [15].
The tree networks uses PAN as the main communication router and often called root node. Further down in the hierarchy FFD comes as central hub and this based on RFDs which only can communicate with FFDs of the root node. Most of the devices in cluster trees are FFDs [15].
2.9 ZigBee
ZigBee is an IEEE 802.15.4 standard with business and consumer devices, deigned for lower data rates, longer life and to provide high efficient connectivity between small packets devices. The ZigBee standard promotes network and application layers on top of the IEEE 802.15.4 PHY and MAC layers [16] and these PHY and MAC layers consisting the RF and communication
components that communicate with other devices. The ZigBee stack contains the networking layer, an application support sub-layer and a security service provider (SSP) [15] as shown in figure 17.
In a ZigBee platform the SSP deals with the methods for data encryption, key generation, key distribution, and authentication. The ZigBee Device Object (ZDO) manages the network by assigning the role of the device within the network (as a coordinator or as an end device), discovers other devices and determines which application services they provide, and establish a secure relationship between network devices [16].
2.10 6LoWPAN
IPv6 over Low power Wireless Personal Area Networks (6LoWPAN) [16] is the international Open standard they enables the wireless '' internet of things'' and brings IP to the smallest of devices, i.e., sensors and controllers [22]. It enables the transmission of IP packets using IEEE 802.15.4 in the sensor networks which can act seamlessly as a part of the global Internet, thus enabling the use of wide range of existing IP-based applications and technologies [16].
2.11 ONE NET
ONE-NET is an open source standard for sensor network designed for low cost, low power contol networks [23]. A WSN specification for ONE NET uses IEEE 802.15.4 compatible transceivers while specifying MAC and routing layers [16]. It uses UHF (Ultra High Frequency) ISM (Industry Scientific and Medical) radio transceivers and operates in 868 Mhz frequency band. The ONE-NET uses wide band FSK (Frequency Shift Keying) for encoded data transmission. The ONE NET feature with dynamic data rate protocol operates with the basic data rate of 38 kbit/s and the specification per node of dynamic data rate configuration allows up to 230 kbit/s data rates [23]. In ONE-NET all transmissions are encrypted with XTEA2 algorithm and ONE-NET supports low duty cycling for battery powered devices [16].
2.12 DASH7
DASH7 is a wireless communication technology based on ISO 18000-7 standard is an open source wireless sensor networking targeted at very low rate data, lower power, and longer range applications which operates in the 433 MHz unlicensed ISM band [24].
The DASH7 comprises of the following key features [25]. • Range: Adjustable from 10 meters to 10 kilometers. • Power: less than 1 milliwatt.
• Data Rate: Dynamically adjustable from 28 kbps to 200 kbps. • Frequency: 433.92 MHz (available worldwide).
• Signal Propagation: Signal has the ability of penetration in concrete wall and water. • Latency: For worst case it has latency less than 2 sec.
• Security: 128-bit AES and public key availability. • Standard: ISO/IEC 18000-7.
DASH7 takes 0 dBm power for transmission on a nominal range of 250m, compared to 75m range of ZigBee and 10m range of Bluetoot [16].
2.13 IEEE 1902.1 (RuBee)
IEEE 1902.1 (RuBee) is an active two way wireless protocol similar to 1802 protocols which fills the gap between WSN and Radio Frequency Identification (RFID) technologies [16]. It is an alternative solution to RFID and is a packet based wireless technology purely based on magnetic waves thus works fine in water and other metals either [26] [16]. The signal in RuBee does not include electric field component but the technology is using magnetic dipole antennas [16]. RuBee designed for high security purposes such as human safety, intrinsic safety (IS) for safe operation of electronic devices and equipments, EMI and EMC for security asset visibility network in harsh environments [26].
2.14 Soil Moisture Measurements Techniques
There are several techniques to measure moisture of the soil. In this section we will discuss just two major techniques which are currently popular because they utilize the electrical properties, good accuracy, quick response and less measurement time and these techniques are quite ease to implement in a WSN application. But it is very important to consider and to achieve a suitable compromise of complexity, price accuracy, and to analyze the advantages and disadvantages of each technique [15].
2.14.1
Dielectric Constant Soil Moisture Probes
In this method moisture of the soil is determined by the measurement of dielectric constant of the soil that is highly depend on the moisture contents in the soil. The dielectric constant of a dry soil is between 3 to 5 [28]. Therefore, as the moisture contents changes in the soil dielectric constant will
change accordingly. There are two major techniques which measure moisture contents in the soil named as,
• Time domain reflectometry (TDR)
• Frequency domain reflectrometry (FDR)
Both techniques uses capacitive property to measure moisture level in the soil such as, capacitance between two plates. Both these measure capacitance of any dielectric material (in this case is soil). The plates are usually cylindrical shaped electrodes called probes and we insert the probes in the soil which results in that the soil become as part of the dielectric.
The TDR technique uses electromagnetic waves which propagates through the probes to its end injected into the soil. The probes (at most two or three probes) are shown in figure 18 which are parallel and inserted into the soil. These probes are serves as the waveguides. When an electrical pulse is applied the wave travels through these waveguides to the end of waveguide and then reflected back. The soil moisture level is measured with respect to travel time of wave through waveguide and its reflected back to the initial end of waveguide. Larger the di-electric constant of the soil, longer the travel time. On the other hand, the FDR technique using the propagation of RF wave (electromagnetic signal) throgh waveguide and the soil moisture is measured by difference between the frequency of onward and relfected wave.
Following are some advantages and disadvantages of TDR and FDR techniques, Advantages:
• These techniques are relatively accurate to (±1-2%) with great sensitivity. • Continues reading and these system are unaffected by soil mineralogy.
• TDR technique is more accurate than FDR and less affected by soil minerals [15].
In general TDR is more expensive to implement than FDR due to its expensive equipments. On the other hand FDR is preferable due to its reasonable accuracy and affordability [15].
Disadvantages:
• Expensive to implement.
• Reading error occur if probes does not make the good contact with the soil.
Figure 18 is showing the components of a TDR soil moisture sensor includes three probes (waveguides) connected to the instrument through a cable and voltage pulse generator to generate a electrical pusle.
2.14.2
Resistive Soil Moisture Sensor
This method of soil moisture is a cheap, low tech and quick in measuring the level of moisture. The resistive based soil moisture sensor measures the moisture levels in terms of electrical resistance of the soil which varies as the function of change in moisture content of the soil [29]. The principle key to implement this method is the voltage divider circuit which read out the voltage drop across the soil sample and convert the voltage drop reading to moisture level of the soil [15]. As the moisture level increases resistance of the metal (usually metal pins) decreases i.e., conductance of the metal will increase and similarly when moisture level decreases the resistance of the metal increases i.e., conductance will decrease. Some common examples of resistive type soil moisture sensors are moisture pins [29] shown in figure 19.
The main disadvantage of this type of method is that it has poor accuracy, slow response time and final reading affected by the soil mineralogy [15].
Based on resistive soil moisture method there are some cheap and locally designed soil moisture sensors which could be feasible in future work. The web-links for those locally designed resistive based soil moisture sensors are as follows,
http://www.cheapvegetablegardener.com/2009/03/how-to-make-cheap-soil-moisture-sensor.html (Internet; accessed 27 September 2012)
http://gardenbot.org/howTo/soilMoisture/#The_local_circuit_-_simple_voltage (Internet; accessed 27 September 2012)
http://www.coastal.org/spec_sheets/s1201-SoilMoistureSensor.pdf
(Internet; accessed 29 September 2012)
Figure 19: Various soil moisture sensing pins. A showing insulated pins, B showing non-insulated pins and C showing stainless steel [29].
There are also several other famous moisture sensing methods as well in the vicinity such as neutron probe, tensionmeter, gypsum bock moisture sensing, WETCORR moisture-temperature sensing, thermal heat-sink method so on. But here we have discussed the soil moisture sensing methods which are important in aspect of the electronics sensors.
2.15 Currently Available Low Power Sensors for Soil Moisture
Various soil moisture sensors have been reviewed during the project work with respect to their reliability, robustness, sensor life and also looked at the built-in integrated features such as built-in radio transceiver for wireless networking, built-in microcontroller, low power consumption, self power management, range of communication as well as cost effectiveness. But some of devices require external radio wireless devices and some devices are using built-in micro strip printed circuit board (PCB) antenna for networking.
Following are some basic soil moisture sensors with their features and specifications reviewed during the project work.
2.15.1
VH400 Series Soil Moisture Sensor
VH400 soil moisture sensors measures the dielectric constant of the soil using transmission line techniques. It is insensitive to water salinity (salt contents in water) and do not corrode over time [30].
Following key points which define features and applications which can be used with the VH400 series soil moisture sensor.
Features and specifications:
• Low cost with volume pricing. • Small size.
• Power consumption less than 7 mA.
• Measures Volumetric Water Content (VWC). • Output voltage is proportional to moisture level. • Wide supplyrange 3.3 to 20 VDC.
• Can be buried and is water proof [30]. Applications:
• Irrigation and sprinkler systems. • Environmental monitoring. • Rain and weather monitoring.
Following is the weblink for VH400 series soil moisture sensor for its price and availability.
http://www.vegetronix.com/Products/Soil-Moisture-Sensor-Probes.phtml (Internet; accessed 1 November 2012)
2.15.2
EC-5 Soil Moisture Sensor
The decagon EC-5 soil moisture sensors is a reliable, accurate and low cost sensor for measuring moisture level of the soil. It is characterized by its low power consumption and its fast measurement [31].
EC-5 soil moisture sensor have the following set of features: • Good accuracy with fine calibration.
• Range of measurement: EC-5: 0 to 100% VWC. • Fast measurement time of 10 mSecs.
• Power range: 3VDC at 10 mA.
• Interface to InteleCell (InteleCell is a wireless datalogger use to connect EC-5 to the Internet).
The weblink shows the price, avaialbity and product description for EC-5 soil moisture sensor.
http://www.intelesense.net/products/index.php?
crn=203&rn=343&action=show_detail (Internet; accessed 1 November 2012)
Figure 21 is showing the ECH2O (version 5) soil moisture sensor. It calculates the change in
di-electric constant to find out the Volumetric Water Contents (VWC) from 0 to 100% of all type of soils with high frequency and gives accurate measurement [31].
2.15.3
Arduino Compatible Soil Moisture Sensor
Figure 22 is showing Arduino compatible soil moisture sensor. It is a cheap and low tech soil moisture sensor which is able read the amount of moisture present in the soil surrounding. The sensor has two probes which allows to pass the current through soil and reads out the resistance to get the moisture level. The main advantage of this sensor is it is using immersion gold [32] which protects the nickel from oxidation and do not corrode over time.
Arduino based soil moisture sensor have the following low power operating characteristics: • Power supply: 3.3 V or 5 V
• Output voltage signal: 0~4.2 V • Current: 35 mA
Other than all above sensors there are some variety of soil moisture sensors are available at:
http://catalogs.indiamart.com/products/soil-moisture-sensors.html
(Internet; accessed 1 November 2012)
2.16 Conclusions
Chapter 2 has provided basic concepts and gives enough details about the topics which are covered in this chapter. The initial part of this chapter is defining about the basic definition of drought, droughts types and its impacts in South Africa. Then it is throughly discussed about basics of sensor and sesing, wireless sensor standards such as ZigBee (IEEE 802.15.4), newly developed standards such as, RuBee (IEEE1902.1), DASH7, ONE NET. This chapter also covers the topics such as, wireless sensor protocols (i.e., efficient energy protocols) and routing (i.e., Address Centric (AC) routing and Data Centric (DC) routing). The final part of this chapter has proposed different soil moisture sensing techniques and comparison between different curretly available soil moisture sensors in the market with respect to their speed, reliability, cost, features and power consumptions.
Chapter 3 Implementation of Low Power
Sensor Network
3.1 Introduction
The main objectives of this project is to implement an independent, robust to natural stresses, self managing and low power sensor module measuring moisture of the soil. The sensor network includes the implementation of three systems on a single printed circuit board (PCB) as the prototype sensor network. The 1st system is the sensor power system which gives power to the
sensor units. The sensor and master unit are the 2nd and 3rd syetem in the protoype design. The
power system consisting of two solar cells which provide power to the supercapacitor and the battery and a power control circuitry which manages and controls the power to the sensor units called power management unit (PMU). The power management unit manages the power between supercapacitor and battery in such a way when the solar energy is available, power will be deliver by the main path to the sensor unit (i.e., in this case supercapacitor will be as the primary source of power) and when there will be no solar energy and if supercapacitor gets below its threshold voltage then the power will be delivered by the battery (i.e., backup path). The 2nd system in the
prototype design is the sensor unit consisting of a fork coupler which is using to measure the soil resistance, a low power XBee module to transfer the data from other sensor units to the master unit, a micro-controller and a Real Time Clock (RTC) in order to keep record of the data i.e., when and at what time data was taken. The 3rd system is the master unit consisting of a micro-controller,
a RTC, SD memory card for storage of data collected from the sensor units, a XBee module, a Bluetooth device to fetch data from the SD-card to the personal computer (PC) or mobile using USB or NFC communication and a data multiplexer (UTC 4053) which will select the incoming data from other sensors that either the data should be sent to XBee or to the Bluetooth device.
3.2 Previous system
The sensor and master units are designed the previous system of the previous project work ”En lågeffektsmodul för markfuktsmätning med fokus på Bluetooth” implemented by mr. Joel Nordh at ISY department in linkoping university [4]. Great appreciation to his work that throughtout the project he done the debugging of different devices in terms of power consumption, life time,
reliability, speed and communication range of devices. Most importantly there were different experiments done in measuring moisture of the soil to cope with the natural stresses and to make a robustness and an autonomous sensor design.
As described earlier the sensor unit consisting of a fork coupler which is used to measure resistance in of the soil. The microcontroller in the sensor unit using RTC which activate the microcontroller for a predetermined time whenever there is a measurement or the resistance in the soil changes. After when the measurement take place the measured data will be sent to the master unit using XBee module in the sensor unit. The master unit is also consisting of a microcontroller which handle with the two different communication protocols (i.e., XBee and Bluetooth). If XBee is activated it means data is retrieved from adjacent sensor units and will be written to a file on the memory card. Where each sensor having its own individual file. The Bluetooth device is used to connect the master unit with a PC or a mobile so that the data stored in the memory card can be downloaded. Once the file is downloaded or read by mobile, the file will be erased so that new data may attributed.
This report is mainly discussing about the implementation of power system of the sensor and power management in the sensor. The hardware implementation of the sensor and master unit is also described in the later section of this chapter.
3.3 System outline
Figure 23 is showing the subsystems interfaces of the proposed sensor network.
3.4 Sensor Power System
The idea of self power managing system for an autonomous sensor taken from a research article ”Solar Power Source for Autonomous Sensors” by ”InTechOpen” (is a leading global publisher of Journals and Books). The low power consumption has a big role in the wireless sensor networks (WSN) design. The poroposed power subsystem of the sensor should be inexhaustible power source capable of delivering the power to the sensor for very long period of time. The power should mainly be through supercapacitor when solar energy is available, this way the power subsystem will capable of holding the stored energy [33] in the battery for a long time. The subsystem consisting of two small solar cells capable of delivering 4 volts and 200 mA of current. Since its because the solar energy is the most effective and efficient, and cost free energy for the outdoor sensors. This is why the the power subsystem for the sensor chosen with the solar cells which will be able to deliver enough power to both for charhing the battery and the supercapacitor to run sensor node [33]. The components of subsystem are, two PhotoVoltaic (PV) panel, a Li+ ion battery, a supercapacitor of 1 F, a power management circuitry which includes the components such as DC-DC boost converter (MAX1795), charge controller (MAX1811) and a power multiplexer (TPS2113PW). The power management unit is designed in such a way that it based on practical application and automatically manages the solar energy for battery and supercapacitor charging and store it efficiently and minimizing the strain on the battery so that battery could not suffer by the aging problem due to less charging/discharging cycles.
3.4.1 Power Management Unit (PMU)
Figure 24 is the system block daigram of power management unit (PMU) redrawn from [33]. The system block is showing the ”main” (red) and ”backup” (blue) path and showing how components in the PMU are connected.
The sensor power system should able to deliver rated voltage of 2 V to 5.5 V to the wireless sensor node. The PMU has two paths ”main” and the ”backup” path and each path has different level of current. Since the ”main” path is crirtical thus we require to maximize the efficiency of the ”main” path [33]. The ”main” path is the default path when the solar energy is available and provides required amount of current and voltage to the wireless sensor node without degrading the supercapacitor and at the same time it also replenish the energy into the supercapacitor [33]. There are three sub-components comes in the ”main” path as shown in figure 24. The 1st
component is DC-DC conveter which boost the energy extract the PV panel so that we can acquire the required amount of current and voltage. The 2nd sub-component in the ”main” path is the
swithching power multiplexers which gives the highest priority to the ”main” path when there will be enough energy available in the supercapacitor and if the energy gets below pre-defined threshold value on ”main” path, the power switching multiplexer will automatically select the ”backup” path and provides energy to sensor node from the secondary source of energy ( i.e., Battery ).
3.4.1.1 Solar Cell
The energy scavenging solar cell has the main role in the sensor power system which keeps the sensor life for years. This is the primary source of energy which replenish the charge in both supercapcitor and the battery and at the same it is also able run a sensor node. The solar cell which is chosen in implementating the power management unit (PMU) is shown in figure 25 and have the following specifications:
• Solar cell type: polycrystalline • Voltage: 2 V
• Current: 200 mA
• Dimensions: 66x95x6 mm • Wattage: 0.4 W
As the solar cells have a single operating point known as the Maximum Power Point (MPP). Therefore, the operating point may moves along the V-I characterstics curve depending on the weather condition such as, the incident solar radiations in sunny weather are good enough and in the cloudy weather sun radiations are become weak so therefore, during such situation of weak sun radiations it is difficult and costly to track the MPP with the commercial solar trackers.
3.4.1.2 Solar Cell V-I Characteristics
When the sun radiations falls on the juntions of the solar cell i.e., surface of solar cell well known as photovoltaic effect (junction formed between n-type silicon wafer and p-type layer which governs the diode characterstics) then charge gets flow through external circuit or wire.
As we know current through the diode is given by,
I
d=
I
o
e
AVd– 1
(3.1)The above equation is taken from the standard V-I equation for a diode [34]. By refering the figure 26 the current flows through the wires is,
I = I
SC−
I
o
e
AVd– 1
(3.2)where Isc is the short circuit current, Io is the reverse saturation current of the diode and A is the temparture dependent constant,
A=q /KT
[34].Figure 27 is showing the V-I curve of a solar cell and its power output. With no load no currents will flow through the wire but the voltage will be at maximum at the output called open circuit voltage Voc and when the wires are short the short-circuit current Isc will flow through the wires with 0 V at output. In both cases no power will be delivered by the solar cell because, it require to be load