Direct Bandpass Sampling of Multiple Distinct RF Signals
Dennis M. Akos,
Member, IEEE,Michael Stockmaster,
Member,IEEE,
James B. Y. Tsui,
Fellow, IEEE,and Joe Caschera
Abstract— A goal in the software radio design philosophy is to place the analog-to-digital converter as near the antenna as possible. This objective has been demonstrated for the case of a single input signal. Bandpass sampling has been applied to downconvert, or intentionally alias, the information bandwidth of a radio frequency (RF) signal to a desired intermediate frequency. The design of the software radio becomes more interesting when two or more distinct signals are received. The traditional ap-proach for multiple signals would be to bandpass sample a continuous span of spectrum containing all the desired signals. The disadvantage with this approach is that the sampling rate and associated discrete processing rate are based on the span of spectrum as opposed to the information bandwidths of the signals of interest.
Proposed here is a technique to determine the absolute min-imum sampling frequency for direct digitization of multiple, nonadjacent, frequency bands. The entire process is based on the calculation of a single parameter—the sampling frequency. The result is a simple, yet elegant, front-end design for the reception and bandpass sampling of multiple RF signals. Experimental results using RF transmissions from the U.S. Global Positioning System—Standard Position Service (GPS-SPS) and the Russian Global Navigation Satellite System (GLONASS) are used to illustrate and verify the theory.
Index Terms— Analog-to-digital conversion, code-division multiple-access, global positioning system, sampling methods, signal sampling/reconstruction, software radio.
I. INTRODUCTION
T
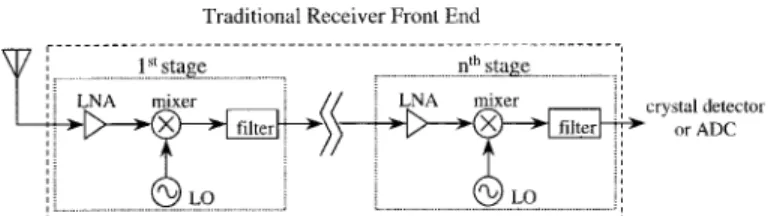
HE CONSTRUCTION of a software radio is based on two simple design goals [1]. First, the analog-to-digital converter (ADC) should be placed as near the antenna as possible in the chain of radio frequency (RF) front-end compo-nents. Second, the resulting samples should be processed on a programmable micro or signal processor. These two guidelines will enable the realization of all the benefits associated with the software radio.Traditionally, a front end consists of multiple stages of amplification, filtering, and downconversion to process a single RF transmission, as depicted in Fig. 1. In following the premise of moving the ADC as close as possible to the antenna, a minimal set of front-end components can be obtained as shown in the second configuration of Fig. 1. These compo-nents can be targeted to operate on a single RF transmission or across a spread of frequencies containing multiple RF
Paper approved by S. Gelfand, the Editor for Transmission Systems of the IEEE Communications Society. Manuscript received November 5, 1997; revised November 29, 1998.
D. M. Akos is with Lule˚a Technical University, Lule˚a, Sweden (e-mail: dma@sm.luth.se).
M. Stockmaster is with Rockwell Collins, Cedar Rapids, IA USA. J. B. Tsui and J. Caschera are with Wright-Patterson Air Force Base, Dayton, OH 45433-7331 USA.
Publisher Item Identifier S 0090-6778(99)05228-9.
(a)
(b)
Fig. 1. Traditional and direct digitization front-end designs.
transmissions, as would be the case in a true software radio. This minimal set consists of the antenna, amplifier(s) to achieve the necessary gain to trigger the ADC, filter(s) to limit the desired bandwidth, and the ADC. In this configuration the RF signal is sampled directly, as no downconversion is performed.
Ideally, the ADC would operate at slightly higher than twice the greatest carrier frequency of interest so that the resulting information bandwidth ( ) would contain all frequencies from DC up to /2. The processor, via software, could then be used to digitally filter, decimate, and further process a particular RF transmission. Thus, a single hardware configuration could operate as multiple receivers simply by changing the software programming.
The caveat here is the current lack of real time pro-grammable processing power. In the examples which follow, the highest frequency of interest is approximately 1.6 GHz, which would require a sampling frequency of greater than 3.2 GHz. With present technology, it is inconceivable to imagine any discrete system capable of processing samples at that rate. Alternatives must be considered. One possible option would be to include one or more frequency translation stages. However, this adds additional hardware between the antenna and ADC contrary to the software radio design philosophy. A second option, which does adhere to the design goals, is the utilization of bandpass sampling.
Bandpass sampling is the intentional aliasing of the in-formation bandwidth of the signal [2], [3]. The sampling frequency requirement is no longer based on the frequency of the RF carrier, but rather on the information bandwidth of the signal. Thus, the resulting processing rate can be significantly reduced. This has been successfully implemented
desired information bandwidth is on the order of 40 MHz. The following proposes a front-end design suitable for use with the software radio utilizing present processor technology. The resulting sample and computation rates are based strictly on the information bandwidths of the desired transmissions. The theory can be extended to include any arbitrary number of signals. What follows is a description of single signal bandpass sampling, which is then extended to multiple signal bandpass sampling. A hardware implementation of the technique for two signals is presented as an example. Finally, a further reduction in sampling/processing rate requirements is proposed and implemented when the input signals use code-division multiple-access (CDMA) modulation.
II. BANDPASS SAMPLING
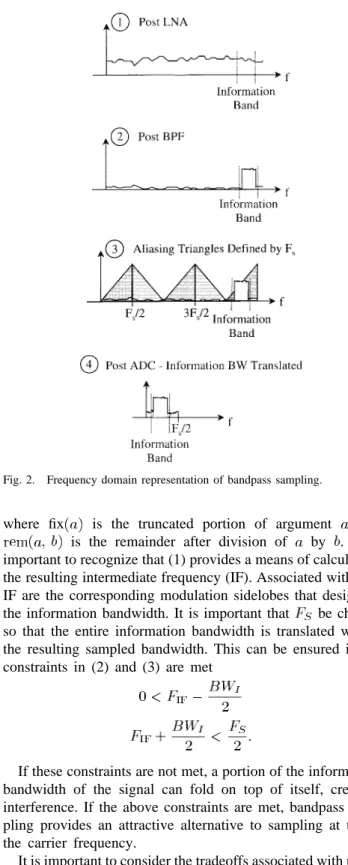
Bandpass sampling is the technique of undersampling a modulated signal to achieve frequency translation via in-tentional aliasing [2], [3]. A high-level frequency-domain depiction of this process, based on the direct sampling front end from Fig. 1, is presented as a four-stage process in Fig. 2. The signal enters through the antenna and is processed by the low-noise amplifier (LNA) amplifying all frequencies within the bandwidth of this component (stage 1). The am-plified signal then passes through a narrow bandpass filter centered above the carrier frequency. This filter attenuates frequencies outside of the information band (stage 2). Next a sampling frequency is selected, which defines the resulting sampled bandwidth as well as the arrangement of the aliasing triangles depicted in stage 3. After sampling, the information band, as well as noise from each aliasing triangle within the analog input bandwidth of the ADC, is folded into the resulting sampled bandwidth (stage 4). Thus, the information band is translated without any local oscillator mixing and image filtering.
A mathematical relationship describing the translation of the carrier frequency to the resulting intermediate frequency is developed as a function of sampling frequency and presented in
if fix is even
odd
(1)
Fig. 2. Frequency domain representation of bandpass sampling.
where fix is the truncated portion of argument and is the remainder after division of by . It is important to recognize that (1) provides a means of calculating the resulting intermediate frequency (IF). Associated with this IF are the corresponding modulation sidelobes that designate the information bandwidth. It is important that be chosen so that the entire information bandwidth is translated within the resulting sampled bandwidth. This can be ensured if the constraints in (2) and (3) are met
(2) (3) If these constraints are not met, a portion of the information bandwidth of the signal can fold on top of itself, creating interference. If the above constraints are met, bandpass sam-pling provides an attractive alternative to samsam-pling at twice the carrier frequency.
It is important to consider the tradeoffs associated with using bandpass sampling in comparison with traditional sampling. Again, the primary advantage is that sampling frequency and consequent processing rate are proportional to the information bandwidth rather than the carrier frequency. Bandpass sam-pling has some fairly unique hardware requirements that may be considered disadvantages. One critical requirement is that the analog input bandwidth of the ADC must accommodate the RF carrier, although its sampling frequency can be much less. A narrow bandpass filter centered about the RF carrier with steep rolloff is a second requirement. This filter must attenuate
Fig. 3. Bandpass sampling of multiple signals.
all frequency energy, essentially noise, outside the information bandwidth. This is important, as all frequency energy from DC to the input analog bandwidth of the ADC will fold or alias into the resulting passband, thus affecting the signal-to-noise ratio (SNR) of the information band. In the case of high-frequency narrow-band signals, the necessary bandpass filter may require an extremely high .
III. MULTIPLE SIGNALBANDPASS SAMPLING
If numerous distinct signals are to be processed in the software radio, a straightforward solution would be to increase the sampling frequency to accommodate a wider bandwidth and these added transmissions. This is the approach proposed by Brown for a global positioning system (GPS) 1 and 2 bands receiver that utilized an 800-MHz sampling frequency [5]. Although this is an ideal long-term solution, there is a significant obstacle to its use at the present time. This approach is computationally expensive, as complex discrete processing is required to manipulate samples at that rate.
What is described here is an alternative, a bandpass sam-pling implementation that can receive signals in a sig-nificantly reduced bandwidth. In this design, only the information bands are folded back into the resulting sampled bandwidth. This technique enables a front end to fold distinct information bands, which may have a wide separation in the RF spectrum, to adjacent positions in the frequency spectrum of the resulting sampled bandwidth. The front-end design and associated frequency-domain representation for the case
is depicted in Fig. 3 [6].
The difficulty here is the choice of sampling frequency. Equation (1) can again be used to calculate the resulting position of the center frequency of each signal, and the constraints of (2) and (3) must be applied for each informa-tion band. However, an addiinforma-tional constraint is imposed: the information bands must not overlap in the frequency spectrum of the resultant sampled bandwidth. This can be expressed mathematically for two signals as
(4)
where the subscripts 1 and 2 refer to the IF and information bandwidths of each signal. This can be extended to included information bands as is expressed in (5)
for (5)
The application of (1)–(3), and (5) provides the constraints necessary to determine the sole parameter in the design of a software radio multiple signal bandpass sampled front end. This approach allows any number of RF signals to be digitized directly using the minimum allowable sampling frequency. The minimum possible sampling frequency for this technique will be the sum of the of the desired signals. However, in order to satisfy the constraints it may be necessary to increase the sampling frequency considerably.
IV. EXPERIMENTAL RESULTS
In order to demonstrate the multiple signal bandpass sam-pling approach, similar to that depicted in Fig. 3, a front-end design was constructed. The signals of interest were two distinct satellite navigation broadcasts, namely GPS-SPS and GLONASS. GPS-SPS is a CDMA system with a cen-ter frequency of 1575.42 MHz and a 2-MHz null-to-null consisting of approximately 24 satellites, each with a unique spreading code [7]. GLONASS is a frequency division multiple-access system with 24 channels at frequencies 1602.0 + 0.5625 MHz ( represents the channel number) and each channel employs a CDMA-like spreading code for ranging purposes [8]. In the following experiment, only GLONASS channels 1–12 are utilized, as the frequency plan is to undergo revisions in the near future, that will eliminate a number of the upper frequency channels. GPS-SPS and GLONASS are ideally suited for this type of implementation: 1) both systems provide similar information and the combination is more robust, adding integrity to the measurements; 2) both systems require similar processing; and 3) the systems are broadcast at distinct nonadjacent frequency bands. This technique can
frequency of 1575.42 MHz and a 3-dB bandwidth of 3.2 MHz. The GLONASS filter was designed to pass channels 1–12 and, thus, was centered at 1605.656 MHz and had a 3-dB bandwidth of 7.5 MHz. After these final filters, the signals were combined and sampled. A TRW AMAD-7 high-speed monolithic 4-bit GaAs HBT ADC was used. The unit has a 2.5-GHz input analog bandwidth and can sample at rates up to 1.25 GHz.
Traditional sampling would require a rate in excess of 3.2 GHz, which is impractical. The state-of-the-art in ADC tech-nology would have difficulty achieving that rate, but even more restrictive is the resulting discrete processing required. The next option would be to bandpass sample the entire frequency span of interest (approximately 1574–1610 MHz), digitally filter, and decimate the resulting samples. This would require a sampling frequency on the order of 70 MHz, well within the bounds of the ADC proposed, yet the implementation of the digital filter/decimation network is computationally expensive. The minimum direct sampling rate can be achieved using the method proposed in this paper. The absolute minimum is determined by the information bandwidth, which is designated as the 3-dB bandwidths of the final filters of the signals of interest. In this case, that minimum is approximately 22 MHz, significantly less than any other method.
Although the rate of 22 MHz may fulfill the information bandwidth requirement, the actual sampling frequency must conform to the constraints given by (1)–(4). An iterative pro-cedure, based on these equations, was developed to determine sampling frequencies that would meet the requirement, the results of which are displayed in Fig. 5. This plot depicts the resulting frequency of the information bands for both GPS-SPS and GLONASS channels 1–12 as a function of sampling frequency. The boundary lines indicate the resulting sampled bandwidth. In the plot in Fig. 5(a), the various sampling frequencies, from 20–40 MHz are tested. It is obvious that the constraints will fail region 20–22 MHz as the minimum is not met. Ideally, a sampling frequency could be found right at or slightly above the 22-MHz absolute minimum. The resulting information bands are plotted only for acceptable values (values for which all constraints were met) of the sampling frequency. This first plot provides an interesting observation. The lowest acceptable sampling frequencies are between 24–25 MHz, yet there is a wide span of greater sampling frequencies (25–35 MHz) which provide an
ade-(a)
(b)
Fig. 5. (a) Resulting GPS-SPS and GLONASS IF’s for a range of bandpass sampling frequencies. (b) Resulting GPS-SPS and GLONASS IF’s for a range of bandpass sampling frequencies (zoomed view).
quate information bandwidth but do not meet the required constraints. This is a result of the nonlinear nature of the constraints imposed by the equations. Fig. 5(b) zooms into a region of the lowest acceptable sampling frequencies. Here a potential sampling frequency of 24.205 MHz is shown to meet the necessary constraints. This sampling rate will downconvert, or alias, the GPS band to an IF at 2.095 MHz and the GLONASS channels to (4.47 + 0.5625) MHz.
Data from GPS and GLONASS satellites were collected on March 31, 1997 at Wright-Patterson Air Force Base (Dayton, OH) at approximately 14:10 UTC. In the unprocessed data, viewed in both the time and frequency domains, there are no discernible signals and the collected data appears only to be white noise. This can be expected from both GPS-SPS and GLONASS CDMA signals which have received power levels
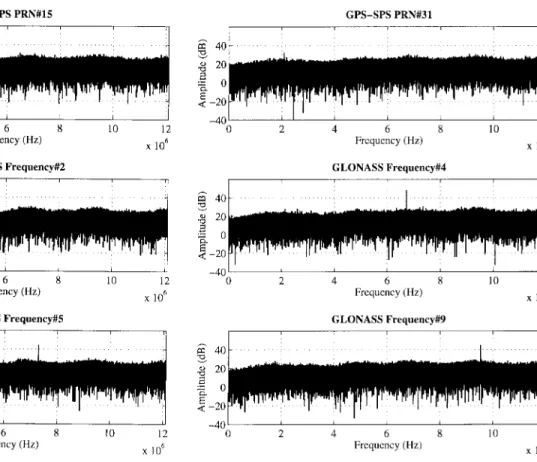
Fig. 6. Postcorrelation spreading code Fourier transforms for GPS-SPS and four GLONASS satellites.
below the noise floor of the receiver. An acquisition algorithm is required to identify the appropriate signal parameters and begin processing [10]. Once acquisition is complete and those signals in the data set have been detected, the spreading code can be removed to visually identify the resulting carriers in the collected data via the Fourier transform of the processed data. All visible satellites at the time of data collection were present in the collected data set. Fig. 6 shows the postcorrelation spreading code Fourier transform for distinct GPS-SPS and GLONASS satellites, each at the predicted frequency. Although five GPS-SPS satellites were identified in the collected data, only the strongest and weakest are shown in Fig. 6 for brevity. Thus, two distinct spectrums have been aliased to adjacent bands via direct digitization and a specific choice of sampling frequency.
The signal structure of these two systems constitutes a special case where a further reduction in sampling frequency is possible using the identical hardware configuration of Fig. 4. Both systems employ unique spreading codes, thus it should be feasible to fold the spectra on top of one another ignoring the constraint of (4). It was calculated that a sampling frequency of 15.402 MHz could be used in this case, as is illustrated in Fig. 7. There are two negative consequences associated with this further reduction. First, although each system has unique spreading codes, the maximum possible cross corre-lation between the sequences is nonzero (approximately 16 dB) [11]. The second issue is an additional 3 dB of noise across the entire GPS-SPS band and over that fraction of the GLONASS band where folding would occur. The identical hardware configuration used previously, shown in Fig. 4, was
Fig. 7. Resulting GPS-SPS and GLONASS overlapping IF’s for a range of bandpass sampling frequencies.
used with a 15.402-MHz sampling frequency to collect a data set. Despite the degradation associated with the reduced sampling frequency, processing revealed all visible satellites present in the data set [9].
V. CONCLUSIONS
A novel bandpass sampling technique has been proposed which calculates the absolute minimum sampling frequency
REFERENCES
[1] IEEE Commun. Mag., vol. 33, pp. 26–68, May 1995.
[2] G. Hill, “The benefits of undersampling,” Electron. Design, pp. 69–79, July 1994.
[10] S. Rappaport and D. Grieco, “Spread-spectrum signal acquisition: Meth-ods and technology,” IEEE Commun. Mag., vol. 22, pp. 6–21, June 1984.
[11] D. M. Akos and M. S. Braasch, “A software radio approach to global navigation satellite system receiver design,” presented at the 1996