Measuring the Immeasurable?
The Intangible Benefits of Digital Information
Karin AhlinMid Sweden University karin.ahlin@miun.se
Abstract
The benefits of digital information are mostly viewed as intangible, meaning that they can be hard to measure. This lack of measurements makes the benefits difficult to compare and communicate, creating problems for e.g. decision-making and the strategic development of specific digital information. Therefore, I conducted a literature review to find out how the combination of intangible benefits and measurements are dealt with in the information systems field. I found that we measure the intangible benefits of information systems or information technology. Here, the measurement method is divided into input, rule, and output. The input consists of determined individual benefits, areas of pre-determined benefits, or interpreted benefits from respondents. The rule follows an accepted theory or contextual adjusted rules, and the output (benefit) can be seen as either financial or non-financial. The avenue for further research focuses on the digital information as the primary resource, not information systems or information technology.
1. Introduction
The benefits of digital information are difficult to measure, which has influenced its strategic use and development by preventing effective communication and by allowing detractors to minimize the potential impact of benefits. This paper presents a focused discussion of measurement strategies, showing that benefits can be (and are being) measured, aimed at supporting more effective communication of benefits. By utilizing measurement strategies, organizations can more efficiently choose aspects of digital information to emphasize, in order to maximize benefits.
The problem of determining the benefits of digital information is discussed by Remenyi et al. [39]. They claim that there are few benefits of digital information and that they are hard to measure, especially in financial terms. Emphasized by Wixom [47] is the problem of measuring. She sees it as one of the key challenges when organizations want to understand the
benefits of digital information and frames the challenges as problematic when fixing a price on digital information or when using digital information for internal bartering. In Ward and Daniel [45], measurements are in focus and explained as a way to communicate the benefits of digital information. Their investigation shows that communication of benefits should be directed towards the stakeholder, implying that there is a need for a different kind of communication. Slumpi et al. [44] are on the same track, describing the communication of benefits as a way to increase the status of digital information. Another aspect of measuring intangible benefits is the importance of showing a complete picture of the generated benefits claimed by Brynjolfsson [3], Remenyi et al. [39], and Ward and Daniel [45]. This motivation is not specifically directed towards the benefits of digital information.
Communication is one way to motivate measurements of benefits, thereby creating interest in transforming the intangible benefits into tangible ones. Apart from communication, comparison and decision-making are in focus as regards the benefits of digital information, especially for management [39]. Measurements make it easier to compare interpretations of intangible benefits and in the long run provide a foundation for decision-making. Part of the decision-making is to keep track of the benefits; more easily done if they can be measured.
Digital technical information (DTI) is one category of digital information related to products. DTI includes such things as manuals or CAD-drawings. Several researchers, like Slumpi et al. [44] and Ingelsson et al. [18], discuss the profound knowledge about the benefits and their measurements resulting in low impact for the DTI in comparison to the product. They even discuss the problems this creates for co-workers dealing with DTI in the form of influence and status in the workplace. Another example and angle is Open Data (OD), which is digital information from governments that should be publicly provided in a machine-readable format [26]. OD is supposed to improve efficiency and be the foundation for digital innovations, merely formed as logical benefits and rarely shown by measurements. Therefore, several
authorities are questioning the effort of publishing the data and creating barriers for work roles such as app developers [9].
Even though intangible benefits are hard to measure, the information systems community has developed several methods to do this, some based on Key Performance Indicators (KPI) or the Balanced Score Card (BSC). To create a broad understanding of the most recently developed measurement methods, this study aims to create a knowledge base for the measurement of the intangible benefits of digital information. The foundation for this is created by means of a literature summary. This paper covers: a deeper understanding of related concepts; a method description; the analysed results from the literature in the form of the categories of financial and non-financial measurement methods; and a discussion about how we measure intangible benefits.
2. Related concepts
The problem of determining the benefits of digital information can be equated with the fact that in most cases it creates intangible benefits [39]. The interpretation of what intangible benefits are can differ. Intangible benefits are often compared with tangible benefits, referring to measurable benefits from investments [3]. Ward and Daniel [45] use a scale for measuring benefits including the steps observable, measurable, quantifiable, or financial. In their classification, intangible benefits are viewed as observable, but they do describe the possibilities of measuring these benefits in the long run, e.g. by using surveys. Frisk [10] describes intangible benefits as soft benefits and Serafeimidis and Smithson [42] discuss them in terms of how they might improve something in the organization. The improvements will not be visible on the bottom line and are therefore viewed as hard to measure. Lycett and Giaglis [30] describe intangible benefits as indirect or strategic advantages, something that is still hard to describe in measurable terms. They explain that the indirect advantages are intertwined with other organizational resources and that the strategic advantages are beneficial for the entire organization from a long-term perspective. Murphy and Simon [32] follow the same track and declare that intangible benefits either improve the internal organization’s operational performance or its output performance. Examples of output are higher product quality, improved product delivery or improved service combining an internal and external organizational perspective. A common perspective here is the general view of intangible benefits as hard
to measure and relies on personal or group interpretation of gained benefits.
Commonly researched in the information systems field are information systems, reviewing the information stored in them [5]. The view of digital information is therefore somewhat limited and discussed only by a few researchers in the field. The digital aspect of digital information relates to electronic storage, using zeros and ones as representation, like in an ordinary information system of today [2]. Focusing on information, one main view is the relationship between data and information, where information mainly is viewed as interpreted data [28, 49].
The measurement process is fundamental when discussing measurements. Ljungberg and Larsson [29] describe the measurement methods as follows: collect the input to the method, do the measurement, and describe the output. Kaner and Bond [22] are more explicit about measurements and use the definition: “measurement is the empirical, objective assignment of numbers, according to a rule derived from a theory, to attributes of objects or events with the intent of describing them. “For this study, the input is related to the view of intangible benefits, namely the interpretation of what is a benefit by individuals or groups of individuals. Kaner and Bond [22] emphasize the rule as any consistent rule, whereas any random rule is not viewed as a rule. From here, I include the intangible benefits in the measurement and declare that the rule affects the input. One way to do this could be to create the input via interviews, use a rule implying various KPI and identify the benefits according to those KPI. One example of KPI is the digital information contribution to the organization according to a given scale. The output shows the contribution of used resources to the organization relating to the set-up of its KPI.
3. Method
To fulfil the aim of creating the knowledge base, a literature summary was initiated. To review existing literature, Machi and McEvoy [31] suggest the following steps: (1) find literature, (2) organize it, and (3) carry out a refining revision of the chosen literature. This is described by Pickard [38] as the skill of searching appropriately and scanning the literature to find appropriate material. Machi and McEvoy [31] describe the literature search as including searching, previewing and selecting material. Here, these findings are under the headings “Search the literature” and “Survey the literature”.
3.1 Search the literature
Based on the purpose, the first exploratory search used the word combination “intangible benefits” AND measurement AND information in the SCOPUS database and then later in the IEEE. The decision to search in two databases was based on the fact that the number of hits in SCOPUS was as low as 6. To validate the result, IEEE was used, which gave 7 hits. To continue to look for measurement methods, previous knowledge about the concept of information economics was used. Information economics includes the measurement of the intangible as well as the tangible benefits of both information systems and digital information [39, 36]. The search used a combination of information economics and “intangible benefit”. Rendering 46 hits in IEEE, the abstracts were read to add material to the knowledge base. The articles in focus were those that included a method to measure the intangible benefits. This search rendered literature where researchers had based their research on the empirical foundation of information systems and in some cases information technology. The digital information was rarely used as an empirical foundation. As information economics is an explicit concept, the next step was an additional search to find more articles. This search was broadened by just using the words “intangible benefit” and rendered 581 hits in SCOPUS.
To reduce the number of hits, the included subject areas were social sciences, business administration, computer science, economics, and decision science. There were 268 new hits. The headings and abstracts were reviewed to find suitable material describing ways to measure intangible benefits. The same step was taken in the database IEEE; using the search words intangible benefit. This rendered 102 hits, which were reviewed by reading the headlines and abstracts of articles containing ways to measure intangible benefits. In total, 28 articles were selected to understand how we measure the intangible benefits of digital information. The search, which initially had a loose outline, was shaped by the increased knowledge of the researcher. Pickard [38] describe this evolution of increased knowledge as an iterative process, forming the knowledge base.
3.2. Survey the literature
The survey of the literature was done by finding themes [31]. Here, the themes are the various methods used to measure intangible benefits. The 28 articles were loaded into Nvivo software, and then scanned to look for the measurement method mentioned in the article. The results were synthesized in the description
of the measurement method and are shown in Table 1. The foundation can be a specific measurement method, like Key Performance Indicators, or described in the article, as a framework created for a specific information systems area, like e-government, information system in the supply chain area or for a bank in a specific country. The themes, by measurement method, were devised to create order and structure; the initial step in the process of surveying the literature and understanding the way intangible benefits are transformed into tangible ones.
Table 1 Found measurement methods Measurement method Author(s) BSC Grembergen and Amelinckx [13], Royer and Wolfgang [40], Ogembo-Kachieng’a et al. [34] Analytical Hierarchy Process (AHP) Hallikainen et al. [16] Key Performance Indicator
Giaglis et al. [11], Kim et al. [24], Wu et al. [48], Ordoobadi [35], Giaglis et al. [12] Information
Economics
Chircu and Kauffman [7]
Framework Khallaf [23], Lycett and Giaglis [30],
Carayannis and Watson [4], Sherer et al. [43], Chang et al. [6], Kumaralalita et al. [27], Kahraman et al. [21], Gupta and Jana [15], Gunasekarana et al. [14], Seddon et al. [41], Jacks et al. [19] Context, Content, and
Processes
Serafeimidis and Smithson [42] Cost-Benefit Analyses Murphy and Simon
[32], Kim et al. [25], Crowder et al. [8], Jacobs and Rodgers [20]
Simulation Mutschler et al. [33] Organizational
Benefits from an Enterprise Model
Ayal and Seidmann [1], Hong and Kim [17]
Using the above process does not find every single measurement method for intangible benefits. Webster, and Watson [46] declare that a literature review will
be good enough if it has searched top information systems journals; here I argue that the material found is adequate for the purpose. Scopus contains six out of eight in the Senior Scholars’ Basket of Journals, added by numerous other IS journals. In addition to the search in IEEE, which contains 26 journals within the information technology field, the search field is deemed to be sufficient.
4. Analysis
The analysis functions on the themes from the survey of the literature. Influential parts of the area of measuring benefits, such as the output in either financial or non-financial terms, are added to the themes. The latter provides an overall categorization for the themes. The analysis was conducted in two steps. The first step was to reread the articles and decide whether to include them in the final material or not. The second step was to categorize the material based on financial or non-financial output.
In the initial part of the analysis, each article was read through once again. The following aspects for searched for in this step: the articles’ rule regarding the transformation of intangible benefits into tangible ones, how the rule was conducted or deemed to be conducted, and the input/output from the rule. These findings were reviewed to fulfil parts of this study’s aim, see Table 2. In every measurement method group, the articles were chosen that provided different aspects of the actual measurement method and also included a specific rule. For the first reason, Ogembo-Kachieng’a et al. [34] was excluded from the BSC group and for the second reason, Wu et al. [48] and Ordoobadi [35] were excluded from the KPI group. The remaining articles were then uploaded in a new Nvivo project.
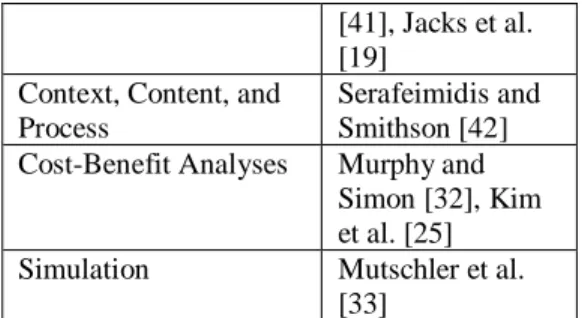
Table 2 Analysed measurement methods Measurement method Author (s)
BSC Grembergen and Amelinckx [13], Royer and Wolfgang [40] Analytical Hierarchy Process (AHP) Hallikainen et al. [16] Key Performance Indicator (KPI) Giaglis et al. [11], Kim et al. [24] Information Economics Chircu and
Kauffman [7]
Framework Khallaf [23],
Lycett and Giaglis [30], Seddon et al.
[41], Jacks et al. [19]
Context, Content, and Process
Serafeimidis and Smithson [42] Cost-Benefit Analyses Murphy and
Simon [32], Kim et al. [25]
Simulation Mutschler et al.
[33]
The second step included further analysis, where the remaining articles were categorized into two main categories: financial and non-financial output. Ward and Daniel [45] influenced this inductive analysis and their rough categorization of output, from observable to financial, is based on Patton’s [37] description of inductive analysis. This description includes exploring and finding important patterns. With knowledge of the material and influenced by the aforementioned categorization, the decision was made to use two categories – non-financial and financial output. With the articles in Table 2, the financial output contains four articles and the non-financial contains ten articles. In order to have a better overview of the non-financial field, this category was further divided by using the previously found themes, such as the KPI, and BSC. The articles picked for these themes mentioned one of these methods. Two articles were picked for both themes, leaving six articles. The foundation of the measurement methods; found to be framework and organizational goal alignment, was searched for in the remaining six articles. Both of these two categories contain three articles each.
4.1 Measurement methods with financial output
The measurement methods with financial outputs are shown in Table 3. The group consists of four studies, all of them using measurement methods for a specific kind of information system, like e-commerce or enterprise resource planning (ERP). Mutschler et al. [33] propose a method based on the theory of system dynamics. This theory uses chains based on cause and effect to explain benefits. The method is not tested on empirical data, only explained theoretically. The explanation is given, using a specific kind of information systems (Workflow Management Systems). Mutschler et al. [33] views the method as cost driven, based on cost factors and impact factors in specific areas connected to the business process, where the information systems are used. The cost factors are direct and the indirect costs are connected to the investment in the information system. In this case, the impact factors are connected to the areas of technology, organization and project management.
Specific benefits, which are used as chains and causes in the dependency network, are derived from the factors.
Two of the other methods use surveys in their measurement methods to find the intangible benefits. Kim et al. [25] use a survey to find the willingness to pay for the information system, which is viewed as the total intangible benefit. Chircu and Kauffman [7] use a survey to understand the users’ eagerness to adopt the system, implying that the intangible benefits are viewed as usage of an information system, and estimate a cost saving based on the usage. Murphy and Simon [32] believe that the major intangible benefit is user satisfaction and identify its increase in the context of a new information system’s implementation. This increase is then measured in cost savings. The input data is compiled via identification of the benefits, and surveying inputs from users of the system. All of these studies’ measurements of intangible benefits are then used in a cost-benefit analysis.
Table 3 Measurement methods with financial output
Article Input/Output of measurement process
Mutschler et al. [33]
I = factors that influence benefits of the system, O = economic measurements Kim et al.
[25]
I = surveys with questions related to the resource, O = monetary value Chircu and
Kauffman [7]
I = surveys with questions about adoption and interviews to understand the barriers, O = percentages, connected to adoption of IS, which can be turned into financial values. Murphy
and Simon [32]
I = identified benefits, O = cash flow.
4.2 Measurement method with non-financial output
The second category is the measurement methods that generate non-financial output(s). The group consists of ten studies, three of which use information technology as a foundation and the remaining seven use information systems. The category is further divided into themes depending on their method or used foundation. The themes are methods based on goal
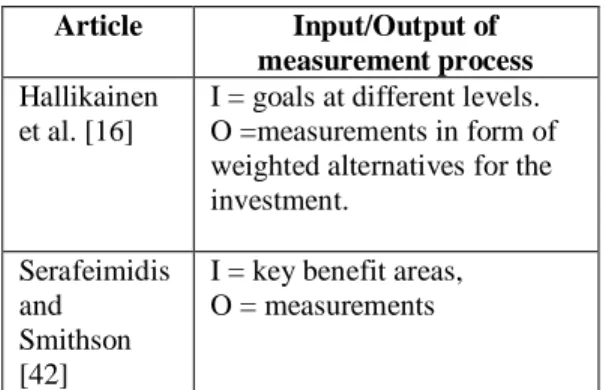
alignments, frameworks or outputs such as KPI, or BSC. The two goal alignment methods use organizational goals as guiding principles for the implementation of information systems [16, 42], see Table 4. The first of these studies uses the Analytical Hierarchy Process, AHP, which, based on the organizational goals, refines them to a detailed level. The detailed level is measured by a survey, weighted against the organizational goals and, as a final step, prioritized. The second method compares the results from a questionnaire with other projects. The results are shown in form of a benefit profile with measurements.
Table 4 Measurement methods with non-financial output, goal alignment
Article Input/Output of measurement process
Hallikainen et al. [16]
I = goals at different levels. O =measurements in form of weighted alternatives for the investment.
Serafeimidis and
Smithson [42]
I = key benefit areas, O = measurements
Four of the studies use frameworks to dig deeper into the world of measurements, see Table 5. One of them is based on a literature review and describes the factors that affect organizational performance as a result of using information technology [19]. The factors are listed as resources, capabilities, and information technology/business alignment. In the second framework, a measurement method is proposed. This method includes a survey, which results in the information required by the project. The future aim for this framework is to add functionality like simulation and “what if” decision features in a CASE tool [30]. The third framework orientates its output towards the organization’s increased value, by measuring processes and their impact on both the internal and external level [23]. The last framework describes benefits from information systems from both a short- and long-term perspective [41]. The tested factors for the short-term are functional fit and overcoming organizational inertia; whereas the long-term adds the factors integration, process optimization, improved access to information and on-going IS projects.
Table 5 Measurement methods with non-financial outputs, framework based
Article Input/Output of measurement process
Jacks et al. [19]
The output is measurements about organizational
performance, which are divided into profitability, productivity and intangible benefits. Lycett and
Giaglis [30]
I = questions aiming to find key information,
O = measurements Khallaf [23] I = level of IT investment,
process flexibility and quality, and customer satisfaction, O = Measurements for the organization's market value Seddon et al.
[41]
I = word count of identified factors,
O = weighted factors from the specific implementation
Two examples using the BSC measurement methods were picked (see Table 6), one of which uses BSC for Enterprise Identity Management Systems [40]. The proposed measurement method synthesizes the four parts in the BSC to two. The first part consists of the business and the financial and the second of security/risk and supporting processes. In the second article, BSC is used for the e-business, which measures customer orientation, business contribution, operational excellence and future orientation [13]. The measurements are collected in various ways, for example via surveys or site visits.
Table 6 Measurement methods with non-financial outputs, BSC
Article Input/Output of measurement process
Royer and Wolfgang [40]
I = intangible benefits in the financial, security/risk mgmt., supporting processes and business processes, O = measurements Grembergen and Amelinckx [13]
I = survey(s) with questions in the area of customer orientation, business contribution, customer orientation, operational
excellence, and future orientation
O = measurements
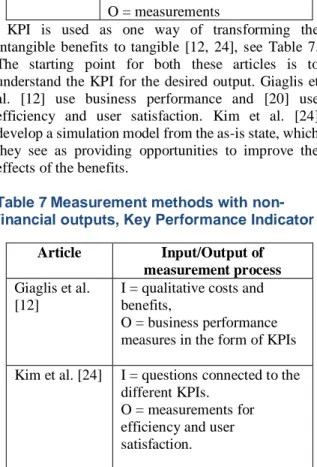
KPI is used as one way of transforming the intangible benefits to tangible [12, 24], see Table 7. The starting point for both these articles is to understand the KPI for the desired output. Giaglis et al. [12] use business performance and [20] use efficiency and user satisfaction. Kim et al. [24] develop a simulation model from the as-is state, which they see as providing opportunities to improve the effects of the benefits.
Table 7Measurement methods with
non-financial outputs, Key Performance Indicator Article Input/Output of
measurement process
Giaglis et al. [12]
I = qualitative costs and benefits,
O = business performance measures in the form of KPIs Kim et al. [24] I = questions connected to the
different KPIs. O = measurements for efficiency and user satisfaction.
5. Discussion
This study aims to create a knowledge base for how we measure the intangible benefits of digital information. In reviewing the literature, no such study was found. Most articles use some information system followed by information technology as a resource for the investigated measurement methods. At least information systems use digital information, implying that it is part of the resource. In the longer run, this could mean that digital information is seen as part of the output, and thus should not be investigated as a resource in isolation. One way to improve the findings in the aim’s direction could be to change the search words. Examples of other search words could be to use the word value instead of benefit or specify the category of digital information of interest, in the same way as a specific information system is used in some of the articles. Another way to understand the few studies of digital information is to follow the claim by Carter et al. [5] and perceive the focus in the information systems field as rarely including the content of the information systems.
The articles were published between 1996 and 2012 with the median year being 2006. We can thereby
ascertain that recent research activity on how to measure intangible benefits is low. The studies have been conducted sporadically, and the researchers have not used or found any traces of previously focused activity. There are few discussions in the articles on why the measurements are conducted. Some mention that managers require financial decisions to see the complete picture of the investment [32, 23]. There is no discussion about how to describe the measurement. Few studies mention measurements and even fewer talk about transformation, which could be a preferable description in comparison to measurement. Using the term transformation would indicate that there are interpretations included and help the users of the figures to understand the basis for them. Despite this, measurement is used here to adhere to the existing tradition within the information systems field.
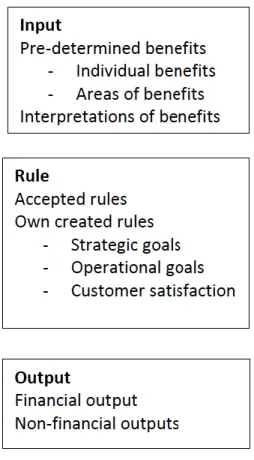
More detailed results from the study handle the three components, input, rule and output [22]. Here, the structure emphasizes a more natural understanding of the included components and the steps included in the measurement method. The findings from each of the inherent components are covered in Figure 1.
The input is either handled as pre-decided, intangible benefits (c.f. [42]), used for confirmation or formed by the interpretations of answers from interviews, or surveys (c.f. [32]). Both the pre-determined way and the interpretations are direct ways to find the benefits, where the first is more direct than the other. One possible other way is to use auxiliary input by asking what would happen if the digital information was not accessible.
Here, one way of handling the inputs are pre-determined benefits, both in specific areas and as individual benefits. Often mentioned in relation to intangible benefits are to make them visible and thereby get a picture of all benefits. Using pre-determined benefits make this picture hard to reach. On the contrary can the finding of all intangible benefits be hard to reach and questioned from various stakeholders. Operationally, the pre-determined benefits are related to a specific area or individual benefits. Both these ways put emphasis on the creator of the questions having in-depth knowledge of e.g. the specified area or rule to be used. One example could be to miss benefits and thereby create a foundation for decision-making of low quality. The usefulness of pre-determination occurs as comparability; focusing on the same benefits in comparison to interpretation.
Few of the articles include an extended way of finding input or verification of the input although Chircu and Kauffman [7] is an exception. It claims to find precious material and bases the benefits on this material. The researcher’s effort is therefore time-consuming although adding more value to the
measurement method.
In the literature review, I found a variety of underlying rules used for the methods, like Contingent Valuation, goal alignment, framework, BSC, system dynamics and KPI. Despite this, my finding is that the methods used vary, and thereby the underlying theory. The variety in rules in this study can be explained by the choice of presenting a sample from each method. In some of the articles, the choice of the underlying rules is discussed as being suitable for both the resource and the organization that uses the measurement method. For the articles where there is no empirical investigation of the measurement method, the expectation is that the organization will make a choice. The rules are derived both from ordinary views on how to express tangible benefits. One example is the CVM that expresses the customers’ willingness to pay for the resource [25] or the AHP [16]. The latter is a method for refining and structuring goals in an organization, where the intangible benefits are compared and prioritized concerning the organizational goals. Other rules are derived from particular perspectives in the organization, such as frameworks dealing with strategic goals [19], operational goals [30], or the rarer more occasional customer [23] or user satisfaction [24].
The output’s structure of financial and non-financial relates to the area of benefits, emphasized by Ward and Daniel [45] in a slightly more detailed structure. For here, the measurement methods with financial outputs are less numerous than the non-financial ones, aligned with statements from Remenyi et al. [39] and Wixom [47]. This might be a sign of dealing with benefits that are seen as hard to measure and put a monetary value on. The financial output includes various ways, such as monetary value [42] or cash flow [32], both framed on the frequently used benefit analysis. A cost-benefit analysis is derived solely from the measurable benefits, taking no account of the differences between measurable and non-measurable assets. This drawback can be offset by the fact that the non-measurable benefits are given a clearance compared to the cost and a better image is created, for example, by an implementation. Focusing on the digital information as a resource for deriving the benefits, the implementation cost is rarely estimated as its creation is mainly done via individuals [47]. The use of such an analysis can, therefore, be hard, not solely based on the intangible benefits.
The result of non-financial output is strongly linked to the various rules, such as the KPI or the BSC. The outputs applied relating to the unique context are synthesized. In these cases, the context can be attributed to the organization, the specific resource or
the used benefits. Kaner and Bond [22] emphasize the output as the objective assignment of numbers. Here, the interpretations of the surveys or interviews should be reflected in the treatment of the numbers as the objectivity can be questioned. The possibility to interpret differently is high, depending on, e.g. the questions in a survey and the way they are formulated. Therefore, a comparison in the same context is a preferred activity, not considering the objectivity and usage in various contexts.
Figure 1 Findings from the inherent
components in the measurement methods
6. Conclusion
The communication of benefits derived from digital information is viewed as difficult, as the benefits are experienced as intangible and can be viewed as hard to measure [39]. However, not measuring these benefits and thereby not communicating their importance or making decisions for their future can give low status to the digital information and the working roles connected to it [44]. It is therefore of interest to understand how we can measure the benefits of digital information, despite the fact that the intangible benefits are viewed as hard to measure. This study’s
literature summary shows that we do in fact measure them in various ways. The input to the measurement method varies from pre-determined benefits on various detail levels, such as areas or individual benefits. The input to the pre-determined benefits functions on surveys, whereas interviews create input to interpretations of benefits. The input to the method is mostly interviews and surveys with questions connected to the resource and the rule, implying that we need to understand them both.
The literature review shows the usage of various rules in the measurement methods. These rules can be founded in BSC, KPI or goal alignment for the organization, and there is always a rule connected to the measurement method. The rule follows two paths and is derived either from a specific theory, such as CVM, or from an organization’s own created rules. The focus for these own created rules is mainly strategic or operational goals for the organization or business processes and more rarely customer satisfaction. The output follows the rule and in this study is categorized by its output into financial or non-financial, where most of the measurement methods are non-financial.
There are several interesting avenues for further research, and I would like to propose three. One is heading back to the initially discussed resource for this study, digital information. As mentioned earlier, this resource is not primarily investigated in the articles found in the literature summary. The first proposal for future research is to create a deeper understanding of how to design and evaluate measurement methods while using digital information as the resource. The first glimpses of this have been provided in this study’s discussion, and from here our understanding can be deepened. The second avenue for further research is to build upon the knowledge base from this study, which gives a first glimpse of the measurement methods used. One way is to add measurement methods using statistics for further understanding in the area. A third avenue is to build a foundation for why we are transforming intangible benefits into tangible ones, focusing on digital information. The presented idea here is communication, decision-making, and tracing, whereas there might be other arguments or even ways to act upon the intangible benefits.
7. References
[1] M. Ayal, and A. Seidmann, “An Empirical Investigation of the Value of Integrating Enterprise Information Systems: The Case of Medical Imaging Informatics”, Journal of Management Information Systems, 2009, pp. 43-68. [2] K.D. Bollacker, “Avoiding a Digital Dark Age.” American Scientist, 2010, pp. 106 -110.
[3] E. Brynjolfsson, “The Productivity Paradox of Information Technology”, Communications of the ACM, 36, 1993, pp. 67-77.
[4] E.G. Carayannis and R. Watson, “Measuring Intangibles: Managing Intangibles for Tangible Outcomes”, PICMET '01. Portland International Conference on Management of Engineering and Technology, Portland, Orlando, 2001. [5] M. Carter, S. Petter, and A.B. Randolph, “ Desperately Seeking Information in Information Systems Research”,
´Thirty Sixth International Conference on Information
Systems, Fort Worth, 2015.
[6] H-L. Chang, J. Chang and K. Wang, “Developing an IT Portfolio Approach to Justify IT Investments”, Hawaii International Conference on System Sciences, Hawaii, 2011, pp. 1 - 10.
[7] A.M. Chircu and R.J. Kauffman, “Limits to Value in Electronic Commerce-Related IT Investments”, 33rd Hawaii International Conference on System Sciences, Hawaii, 2000.
[8] R. Crowder, G. Wills and W. Hall, “Hypermedia maintenance support applications: Benefits and development costs”, Computers in Industry, 2005, pp. 681-698.
[9] J. Crusoe and U. Melin, “Investigating Open Government Data Barriers.”, International Conference on Electronic Government, Springer, 2018.
[10] E. Frisk, “Categorization and overview of IT evaluation perspectives - A literature review”, ECIME 2007: The European Conference on Information Management and Evaluation, University Montpellier 1, 2007.
[11] G.M. Giaglis, N. Mylonopoulos and G.I. Doukidis, “The ISSUE methodology for quantifying benefits from information systems”, Logistics Information Management, 12, Logistics Information Management, 1999, pp. 55-62. [12] G.M. Giaglis, Paul, R. J., and O’Keefe, R. M. "Combining Business and Network Simulation Models for IT Investment Evaluation," 32nd Hawaii International Conference on System Sciences, Hawaii, 1999.
[13] W.V. Grembergen and I. Amelinckx, “Measuring and Managing E-business Projects through the Balanced Scorecard”, 35th Hawaii International Conference on System Sciences Hawaii, 2002.
[14] A. Gunasekarana, P.E.D. Loveb, F. Rahimic and R. Mieled, “A model for investment justification in information technology projects”, International Journal of Information Management, 21, 2001, pp. 349-364.
[15] M. P. Gupta and D. Jana, “E-government evaluation: A framework and case study”, Government Information Quarterly, 20, 2003, pp. 365 - 387.
[16] P.H. Hallikainen, Kivijärvi and K. Nurmimäki, “Evaluating Strategic IT Investments: An Assessment of Investment Alternatives for a Web Content Management
System”, 35th Hawaii International Conference on System Sciences, Hawaii, 2002.
[17] K. -K. Hong, and Y.-G. Kim, “The critical success factors for ERP implementation: an organizational fit perspective”, Information & Management, 2002.
[18] P. Ingelsson, , U. Löfstedt, I. Bäckström, I., and L.-M. Öberg, “Taking a Holistic Perspective on Technical Communication and Lean.” Quality Innovation Prosperity, 2015, pp. 103-122.
[19] T.P. Jacks, Palvia and R. Schilhavy, “A framework for the impact of IT on organizational performance”, Business Process Management Journal, 17, 2011, pp.846-870. [20] G. Jacobs and C. Rodgers, “ISDN-based distance learning: tangible costs, intangible benefits”, Computers & Education, 1998, pp. 41-53.
[21] C. Kahraman, N.f.Y. Ates, S.C. ̧evik, and M.G. ̈lbay, S.A.a.E. an, “Hierarchical fuzzy TOPSIS model for selection among logistics information technologies”, Journal of Enterprise Information Management, 2007, pp.143-168. [22] C. Kaner and W.P. Bond, “Software Engineering Metrics: What Do They Measure and How Do We Know?” 10th International Software Metrics Symposium, METRICS 2004, 2004.
[23] A. Khallaf, “Information technology investments and nonfinancial measures: A research framework”, Accounting Forum 36, 2012, pp.109 - 121.
[24] H.H. Kim, K.-W. Cho, H.S. Kim, J.-S. Kim, J.H. Kim, S.P. Han, C.B. Park, S. Kim and Y.M. Chae, “New Integrated Information System for Pusan National University Hospital”, Health Informatic Research, 2011, pp. 67-75.
[25] K.J. Kim, K. Kim and K.Y. Kang, “Valuation on the Intangible Benefits of EVMS using CVM”, Journal of Asian Architecture and Building Engineering, 2010.
[26] H. Koski, “The Impact of open data – a preliminary study.” Ministry of Finance publications 15b/2015, 2015. [27] L. Kumaralalita, A.N. Hidayanto and D. Chahyati, “Compliance Analysis of IT Investment Governance Practices to Val IT 2.0 Framework in Indonesian Commercial Bank”: The XYZ Bank Case Study: ICACSIS, 2011, pp. 297-304.
[28] Langefors, B. Essays on Infology. Studentlitteratur. Lund, 1995
[29] Ljungberg, A. and E. Larsson, Processbaserad verksamhetsutveckling Varför - Vad - Hur? Studentlitteratur, Lund, 2012
[30] M. Lycett and G.M. Giaglis, “Component-Based Information Systems: Toward a Framework for Evaluation”, 33rd Hawaii International Conference on System Sciences, Hawaii, 2000.
[31] Machi, L. and B. McEvoy, The literature review - six steps to success, 2nd ed., Corwin, Thousand Oaks, 2012. [32] K.E. Murphy and S.J. Simon, “Using Cost Benefit Analysis for Enterprise Resource Planning Project Evaluation: A Case for Including Intangibles”, 34th Hawaii International Conference on System Sciences, Hawaii, 2001. [33] B.J. Mutschler, Bumiller and M. Reichert, “An Evaluation Approach for Analyzing Workflow Management Systems from a Value-based Perspective”, 10th IEEE International Enterprise Distributed Object Computing Conference (EDOC'06), Hong Kong, 2006.
[34] M. Ogembo-Kachieng’a, M. Mothepu, and W. Omodho, “Business Evaluation of Information Communication Technology Projects in Southern Africa: The Case Study of Lesotho Revenue Authority”, Technology Management for Emerging Technologies, 2013. [35] S. Ordoobadi, “Evaluation of advanced manufacturing technologies using Taguchi’s loss functions”, Journal of Manufacturing Technology Management, 2009, pp. 367-384.
[36] Parker, M.M., R.J. Benson and H.E. Trainor, Information Economics Linking Business Performance to Information Technology, Prentice-Hall, Englewood Cliffs, 1988.
[37] Patton, Q.M. Qualitative Research & Evaluation Methods, 3rd ed., Sage Publications, Thousand Oaks, 2002. [38] Pickard, A.J. Research Methods in Information 2nd Edition, Facet Publishing, London, 2013.
[39] Remenyi, D. ,F. Bannister, and A. Money, The effective measurement and Management of ICT costs & benefits, Third ed., Elsevier, Oxford, 2007
[40] D. Royer and J. Wolfgang, “Assessing the Value of Enterprise Identity Management (EIdM) – Towards a Generic Evaluation Approach”, The Third International Conference on Availability, Reliability and Security, Barcelona, Spain, 2008.
[41] P.B. Seddon, C. Calvert and S. Yang, “A multi-project model of key factors affecting organizational benefits from enterprise systems”, MIS Quarterly, 34, 2010, pp.305 - 328. [42] V. Serafeimidis and S. Smithson, “The Management of Change for Information Systems Evaluation Practice: Experience from a Case Study”, International Journal of Information Managemen, 16, 1996, pp. 205 - 217.
[43] S.A. Sherer, M.R. Ray and N.M. Chowdhury, “Assessing Information Technology Investments With An Integrative Process Framework”, 35th Hawaii International Conference on System Sciences, Hawaii, 2002.
[44] T.P. Slumpi, K. Ahlin and L.-M. Öberg, “Intraorganizational benefits from product configuration information - a complementary model”, International design conference - design 2012, Dubrovnik, Croatia, 2012. [45] Ward, J. and E. Daniel, Benefits Management: How to Increase the Business Value of Your IT Projects, 2nd Edition, John Wiley & Sons, Somerset, NJ, USA, 2012. [46] J. Webster, and R. Watson, “Analyzing the past to prepare for the future: Writing a literature review”, MIS Quarterly, 2002, pp. xiii-xxiii.
[47] B.H. Wixom, “Cashing in on your data” in: Research Briefing, MIT Information for Systems Research, Cambridge MA, 2014.
[48] F. Wu, C.Liu, H.Z.Li, K.Gao and J.Tian, “The Benefits Evaluation of ERP Project Investment Based on Real Options”, 2006 IEEE International Conference on Systems, Man, and Cybernetics, Taipei, Taiwan, 2006.
[49] C. Zins, “Conceptual approaches for defining data, information and knowledge.” Journal of the American Society for Information Science and Technology, 2007, pp. 479-493.
![Table 1 Found measurement methods Measurement method Author(s) BSC Grembergen and Amelinckx [13], Royer and Wolfgang [40], Ogembo-Kachieng’a et al](https://thumb-eu.123doks.com/thumbv2/5dokorg/5390108.137577/3.918.493.811.338.995/measurement-methods-measurement-author-grembergen-amelinckx-wolfgang-kachieng.webp)