ANALYSIS OF ENGINEERED NANOMATERIALS IN THE ENVIRONMENT
by
ii
A thesis submitted to the Faculty and the Board of Trustees of the Colorado School of Mines in partial fulfillment of the requirements for the degree of Doctor of Philosophy (Chemistry and Geochemistry).
Golden, Colorado
Date ________________________
Signed: _____________________________
Robert Bruce Reed
Signed: _____________________________ Dr. James F. Ranville Thesis Adviser Golden, Colorado Date ________________________ Signed: _____________________________ Dr. David T. Wu Professor and Head Department of Chemistry and Geochemistry
iii
ABSTRACT
With increasing incorporation of engineered nanoparticles (NPs) into consumer products, there is concern that these materials will be released to the environment with unknown ecological effects. Methods for detection and characterization of these materials at environmentally relevant concentrations are crucial to understanding this potential risk. A relatively new method, single particle inductively coupled plasma mass spectrometry (spICPMS), was applied to analysis of metal oxide NPs such as ZnO, CeO2, and TiO2, as well as silver nanowires and carbon
nanotubes.
A lack of nanoparticulate “pulses” in spICPMS analysis of nano-ZnO led to a study on ZnO NP solubility in a variety of matrices. Dissolution of nano-ZnO was observed in nanopure water (7.18 – 7.40 mg/L dissolved Zn, as measured by filtration) and Roswell Park Memorial Institute medium (RPMI-1640) (~5 mg/L), but much more dissolution was observed in
Dulbecco’s Modified Eagle’s Medium (DMEM), where the dissolved Zn concentration exceeded 34 mg/L. These results suggest that solution chemistry exerts a strong influence on ZnO NP dissolution and can result in limits on zinc solubility due to precipitation of less soluble solid phases.
Detection and sizing of metal-containing NPs was achieved at concentrations predicted for environmental samples (part-per trillion levels) using spICPMS. Sizing of silver nanowires, titanium dioxide and cerium oxide NPs was done by correlating ICP-MS response (pulses) from NPs entering the plasma to mass of metal in dissolved standards. The ratio of NP pulse
detections to the total number of readings during analysis was optimized at 2.5% or less to minimize coincident pulses while still allowing definition of a size distribution.
iv
Detection of single walled carbon nanotubes (CNTs) was performed using spICPMS. This study focuses on using trace catalytic metal nanoparticles intercalated in the CNT structure as proxies for the nanotubes. The small, variable, amount of trace metal in each CNT makes separation from instrumental background challenging, and multiple approaches to this problem were attempted. To highlight the potential of spICPMS in environmental studies the release of CNTs from polymer nanocomposites into solution was monitored, showcasing the technique’s ability to detect changes in released CNT concentrations as a function of CNT loading.
v
TABLE OF CONTENTS
ABSTRACT ... iii
LIST OF FIGURES ... viii
LIST OF TABLES ... xi
LIST OF ABBREVIATIONS ... xii
ACKNOWLEDGMENTS ...xv
DEDICATION ... xvi
CHAPTER 1: INTRODUCTION 1.1 Consumer products containing NPs ...1
1.2 Release scenarios for NPs ...2
1.3 Potential for ecotoxicity ...3
1.4 The need for advancements in nanometrology ...4
1.5 Thesis Organization ...6
Chapter 2: SOLUBILITY OF NANO-ZNO IN ENVIRONMENTALLY AND BIOLOGICALLY IMPORTANT MATRICES 2.1 Introduction ...8 2.2 Experimental ...10 2.2.1 Materials ...10 2.2.2 Characterization of NPs ...10 2.2.3 Dissolution experiments ...13 2.2.4 Equilibrium modeling ...15 2.2.5 Ultrafiltration experiment ...15
vi
2.3.1 Dissolution in nanopure and moderately hard water ...16
2.3.2 Dissolution in cell culture media ...20
2.3.3 Effect of temperature on dissolution ...23
2.3.4 Separation of zinc species by ultrafiltration ...26
Chapter 3: OVERCOMING CHALLENGES IN ANALYSIS OF POLYDISPERSE METAL-CONTAINING NANOPARTICLES BY SINGLE PARTICLE INDUCTIVELY COUPLED PLASMA MASS SPECTROMETRY 3.1 Introduction ...29
3.2 Experimental ...32
3.2.1 Materials ...32
3.2.2 Characterization of NPs ...33
3.2.3 Sedimentation field-flow fractionation (SdFFF) ...36
3.2.4 ICP-MS experimental details ...37
3.3 Results and Discussion ...40
3.3.1 Real-time data and analyte parameters ...40
3.3.2 Frequency counts of data for polydisperse metal-containing NPs...42
3.3.3 NP size calculation approaches ...43
3.3.4 spICPMS size distributions of NPs ...48
3.3.5 Challenges in analyzing polydisperse NPs and coincidence of pulses ...53
Chapter 4: DETECTION OF SINGLE WALLED CARBON NANOTUBES BY MONITORING EMBEDDED METAL NANOPARTICLES 4.1 Introduction ...58
4.2 Experimental ...61
4.2.1 Preparation of CNT suspensions ...61
vii
4.2.3 Comparison of spICPMS and NTA ...63
4.2.4 Nanocomposite preparation for CNT release study ...64
4.3 Results and discussion ...65
4.3.1 CNT characteristics ...65
4.3.2 Choice of element proxy ...66
4.3.3 CNT pulse cut-off criteria ...69
4.3.4 Quantification of CNT number concentration by spICPMS ...74
4.3.5 Comparison of spICPMS and NTA for CNT quantification ...77
4.3.6 Mass balance of analyte metal for varying CNT concentrations ...80
4.3.7 Detection of CNTs released from a polymer matrix ...86
Chapter 5: CONCLUSIONS 5.1 Implications of results ...91
5.2 Quantification of ZnO NP dissolution ...91
5.3 Use of spICPMS for analysis of polydisperse NPs ...92
5.4 Detection of CNTs using spICPMS ...95
5.5 Use of nanometrology in assessment of risk arising from NPs in the environment ...97
REFERENCES CITED ...98
viii
LIST OF FIGURES
Figure 1.1 Number of listed products containing engineered NPs ...1
Figure 1.2 Most commonly used NPs in consumer products, listed by element ...2
Figure 1.3 Traditional ICPMS vs single particle ICPMS analysis ...5
Figure 2.1 SEM and TEM images of ZnO particles ...12
Figure 2.2 Long-term dissolution of 100 mg/L bulk and nano ZnO in nanopure water and moderately hard water ...16
Figure 2.3 EDS spectrum of precipitates formed in moderately hard water after addition of 80 mg/L Zn ...19
Figure 2.4 Long-term dissolution of 100 mg/L bulk and nano ZnO (Alfa Aesar 44904) in DMEM and RPMI...20
Figure 2.5 EDS spectrum of precipitates formed in RPMI after addition of 80 mg/L Zn ...22
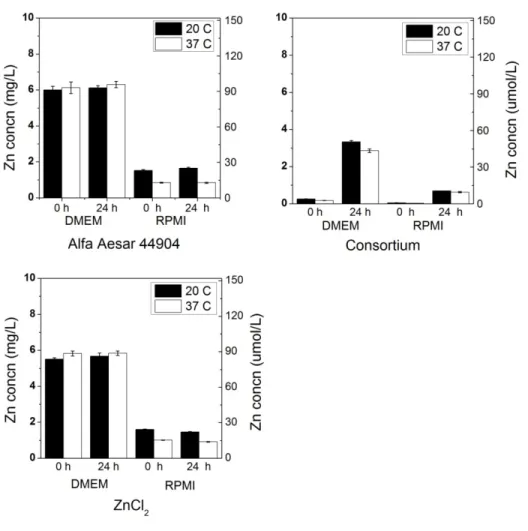
Figure 2.6 Dissolution of 100 mg/L ZnO NPs (Alfa Aesar 44904, consortium) in DMEM and RPMI after 0 and 24 h at both 20 and 37 oC ...23
Figure 2.7 Dissolution of 10 mg/L ZnO NPs (Alfa Aesar 44904, consortium) in DMEM and RPMI after 0 and 24 h at both 20 and 37 oC ...25
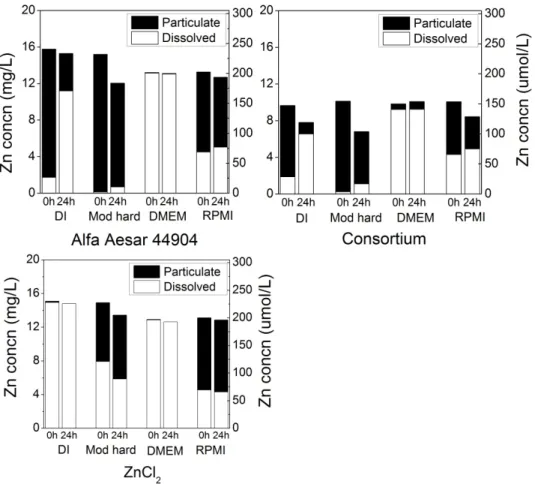
Figure 2.8 Particulate and dissolved zinc concentrations in various matrices at 20oC after 0 and 24 h using ~10 mg/L Alfa Aesar 44904 and consortium ZnO NPs ...27
Figure 2.9 Permeate concentrations for Alfa Aesar 44904 and Consortium ZnO filtered with five ultrafilter membrane pore sizes at zero and 24 hours in nanopure water ...28
Figure 3.1 BBI Au NPs TEM image ...34
Figure 3.2 Inframat CeO2 NPs TEM image ...34
Figure 3.3 Aldrich TiO2 NPs TEM image ...35
Figure 3.4 NanoComposix Ag nanowires TEM image ...35
Figure 3.5 Time-resolved data for four NPs at 200 ppt in DI water ...40
Figure 3.6 Number of NP pulse events from spICPMS analysis for TiO2, CeO2, and Ag nanowire NPs ...43
ix
Figure 3.7 Observed number of pulses vs. concentration for four separate analyses of Nanocomposix 100 nm Au NPs ...45 Figure 3.8 Size distributions for Aldrich TiO2 and Inframat CeO2 as determined by spICPMS
and SdFFF analyses ...49 Figure 3.9 Manufacturer size distribution for Ag nanowires ...51 Figure 3.10 Length distributions for Ag nanowires at four different cross-sectional
diameters ...52 Figure 3.11 The effect of NP concentration on size distribution for monodisperse (Au) and
polydisperse (TiO2 and Ag nanowires) systems in DI water ...54
Figure 3.12 Combinations of size distribution data for 60 ppt TiO2 ...56
Figure 4.1 Picture of chitosan and chitosan/SWNT nanocomposite ...65 Figure 4.2 spICPMS response data, for determination of the best analyte metal for CNTs
used in this study ...67
Figure 4.3 Data for ICP-MS response from Figure 4.2, binned to show distribution of pulses above background ...68
Figure 4.4 Comparison of the spICPMS response for DI blanks and CNT supernatant ...71 Figure 4.5 Comparison of DI blank and 5 ng/L Southwest Nanotechnologies CNTs ...72 Figure 4.6 Relationship between CNT mass concentration (x) and number of CNT detection events (y) for NanoAmor CNTs ...76 Figure 4.7 Particle number concentrations as measured by NTA and spICPMS for three
types of CNTs ...78 Figure 4.8 Ratio of measured to nominal metal mass for Carbon Solutions (yttrium) CNT at
concentrations from 50 to 1000 ng/L, assuming all ICP-MS signal is due to
dissolved Y...81 Figure 4.9 Ratio of measured to nominal metal mass for Carbon Solutions (yttrium) CNT at
concentrations from 50 to 1000 ng/L, assuming all ICP-MS signal is due to
particulate Y ...82 Figure 4.10 Ratio of measured to nominal metal mass for NanoAmor (cobalt) CNT at
concentrations from 50 to 1000 ng/L, assuming all ICP-MS signal is due to
x
Figure 4.11 Ratio of measured to nominal metal mass for NanoAmor (cobalt) CNT at concentrations from 50 to 1000 ng/L, assuming all ICP-MS signal is due to
particulate Co ...84 Figure 4.12 Ratio of measured to nominal metal mass for Southwest (cobalt) CNTs at
concentrations from 50 to 1000 ng/L, assuming all ICP-MS signal is due to
dissolved Co ...85 Figure 4.13 Ratio of measured to nominal metal mass for Southwest (cobalt) CNTs at
concentrations from 50 to 1000 ng/L, assuming all ICP-MS signal is due to
particulate Co ...86 Figure 4.14 Examination of the effect of loading on CNT release from CNT-chitosan
xi
LIST OF TABLES
Table 2.1 Characterization of bulk and nanoparticulate ZnO by SEM, DLS, and zeta
potential measurements ...11
Table 2.2 Concentrations of inorganic constituents in aqueous matrices: moderately hard water, DMEM (27), and RPMI ...13
Table 2.3 Linear model data fitting parameters for long-term dissolution of bulk ZnO in various matrices ...17
Table 2.4 Linear model data fitting parameters for long-term dissolution of Alfa Aesar 44904 nano-ZnO in various matrices ...17
Table 2.5 Linear model data fitting parameters for long-term dissolution of Alfa Aesar 45409 nano-ZnO in various matrices ...17
Table 2.6 Linear model data fitting parameters for long-term dissolution of Alfa Aesar 45588 nano-ZnO in various matrices ...17
Table 2.7 Visual MINTEQ simulation results for saturation indices of Zn-containing solids in DI, moderately hard water, DMEM, and RPMI ...18
Table 3.1 Characterization of NPs by dynamic light scattering and zeta potential ...33
Table 3.2 SdFFF channels dimensions ...36
Table 3.3 Run parameters used to analyze TiO2 and CeO2 nanoparticle suspensions ...37
Table 3.4 Instrument transport efficiency from comparing observed pulse number and theoretical particle number for Au NPs ...44
Table 4.1 Size characterization and percent metal for all CNTs used ...66
Table 4.2 Examination of different cut off criteria for differentiating CNT detection events from background signal ...73
xii
LIST OF ABBREVIATIONS USED
Bovine serum albumin ... BSA Brunauer-Emmett-Teller ... BET British Biocell, International ... BBI Calcium carbonate ... CaCO3
Carbon nanotube ...CNT Celsius ... °C Cerium oxide ... CeO2
Copper Kalpha ... Cu Kα
Cubic centimeter ... cm3 Dulbecco’s Modified Eagle’s Medium ... DMEM Dynamic light scattering ... DLS Energy dispersive x-ray spectroscopy ... EDS Environmental Protection Agency ... EPA Field-flow fractionation ... FFF Gravitational constant ... G Hour ...h Hydrochloric acid... HCl Hydrodynamic chromatography ... HDC Inductively coupled plasma mass spectrometry ... ICP-MS Inductively coupled plasma atomic emission spectroscopy ... ICP-AES Kilodalton ... kDa Kilovolt ... kV
xiii
Liter ... L Molecular weight cut-off ... MWCO Microgram... μg Micrometer ... μm Milligram ... mg Millimeter ... mm Millisecond ... ms Minute ... min NanoComposix ... NC Nanogram ...ng Nanometer ... nm Nanoparticle ... NP Nitric acid...HNO3 Part-per-million ... ppm Part-per-billion ...ppb Part-per-trillion ... ppt Revolutions per minute ... RPM Roswell Park Memorial Institute-1640 cell culture medium ... RPMI Scanning electron microscopy ... SEM Scanning tunneling electron microscopy ... STEM Sedimentation field-flow fractionation ... SdFFF Single particle inductively coupled plasma mass spectrometry ... spICPMS Single walled carbon nanotube ... SWNT
xiv
Time ... t Titanium dioxide ... TiO2
Transmission electron microscopy ... TEM X-ray diffraction ... XRD Zinc carbonate ... ZnCO3
Zinc chloride ... ZnCl2
xv Acknowledgment
I would like to thank my Ph.D. adviser and Third Eagle of the Apocalypse, Jim Ranville, for providing scientific guidance, life advice, laughs, and shots, throughout my time at Mines. I would also like to thank Mike Morse for keeping me busy on the guitar, the trail, and the ice during my time in Colorado. Sarah Khalid quickly became the love of my life and has supported me through my studies, including ten months abroad in Vienna. She even agreed to marry me in Istanbul, Turkey, when we met up during my Fulbright scholarship. Tess Weathers was very accommodating in allowing me to hang out as a third wheel on trips all over Colorado, plus entertaining me with her great laugh and crab dancing. Kevin McCann has provided me with great friendship and views of even greater mustaches over the last few years. Andy Vermilyea and Taylor Dixon showed me the ropes in grad school by pushing me unwillingly down
children’s slides, dumping me out of shopping carts, and smashing my face into screen windows in Fremont, Nebraska. This has been the best time of my life due to the people above and many more.
Invaluable funding sources during my studies include a teaching assistantship from the Chemistry Department, research assistantships from various sources thanks to Jim Ranville (again), and the Austrian-American Fulbright Association.
xvi Dedication
I dedicate this thesis to my parents, Bruce and Cathy Reed. My dad Bruce died in 2011 and I wish he could have been here to see me earn my doctorate. He was a great dad and I learned a lot from him. My mom has been loving and supportive my whole life, and always told me I could achieve anything I wanted to. She takes every opportunity to tell me I am a great writer – and she is happy to hear that people I have worked with share this view. My ability to write this thesis comes from my parents’ time spent reading to me as a child and instilling me with a love of reading and learning. Thank you both for everything you have given me in life!
1
CHAPTER 1
INTRODUCTION
1.1 Consumer products containing NPs
The special properties of NPs due to greater specific surface area and/or quantum
confinement have made them very attractive for a variety of applications. Thus, there has been a large increase in consumer products listed as containing NPs in the last decade (Figure 1.1).
2005 2006 2007 2008 2009 2010 0 200 400 600 800 1000 1200 1400 N u mber o f Lis ted Pro duc ts Year
Figure 1.1. Number of listed products containing engineered NPs. Adapted from Project on Emerging Nanotechnologies (1)
The NPs used in products cover a range of elemental composition, with silver, carbon, gold, and various metal oxides being the most common (Figure 1.2).
Silver is used most commonly for anti-microbial purposes, and can be found in bandages, sprays, and even drinks (1). CNTs are often touted as being a revolutionary new material with incredible tensile strength and conductivity, and are increasingly incorporated into polymers, bicycle frames, and tennis racquets (1, 2). Metal oxides are used for a variety of applications:
2
Silver Carbon Gold Silica Zinc Titanium 0 50 100 150 200 250 300 350 N u mbe r of Listed P roducts Element Mar 8, 2006 Mar 10, 2011
Figure 1.2. Most commonly used NPs in consumer products, listed by element. Adapted from Project on Emerging Nanotechnologies (1)
silica NPs are used as thickeners, anti-caking agents, and photocatalysts (1, 3). Zinc and titanium oxide NPs are both used in sunscreens (1), and titanium dioxide is used widely as a whitener in both food and personal care products (4).
1.2 Release scenarios for NPs
With this increase in production of NPs comes an elevated probability of their release to the environment through manufacture, use, and disposal of consumer goods. Several studies have predicted probable environmental concentrations of various types of NPs using material flow analysis (5-7). These studies typically predict that NP concentrations in various environmental compartments will be at or below the ppt range in surface waters, soils, and sediments. After incorporation into consumer products, regular use is likely to result in weathering and release of NPs to the environment (8). After reaching the environment, a variety of transformations may occur which modify the original NP material, such as dissolution, adsorption to other NPs
3
(homoaggregation) or natural particles (heteroaggregation), loss of original coating material and/or sorption of natural organic matter coating (8). Simulated laboratory weathering of nanocomposites showed CNTs protruding from the material as well as detectable release of CNTs, due to chemical degradation and mechanical stress (9). These processes may all occur after release and make detection and characterization of NPs in the environment a complicated task.
1.3 Potential for ecotoxicity
Although NPs are mostly not thought to pose a threat to human health (with a possible exception of CNT inhalation resulting in asbestos-like toxicity (10-12)), there are numerous studies showing increased toxicity to cells and microorganisms relative to larger particles of the same elemental composition. As silver NPs are incorporated into the most products specifically for their antimicrobial properties, they have been widely studied in toxicity tests to Daphnia magna (13-16) as well as human glioblastoma and lung fibroblast cells (17) . The potential hazard of CNTs has been studied for pulmonary effects in mice (18), possible toxic effects of residual synthesis catalyst metal (19), and manufacturing workplace exposure to humans (20). Metal oxide NPs containing zinc, titanium, cerium, etc, have also been studied with regard to cell and animal toxicity in a wide range of studies (15, 21-29). The majority of studies find that NPs frequently have a greater toxic effect than corresponding larger particles with sizes on the order of microns. Although reasons for increased toxicity are often postulated (ROS production (21), dissolution to toxic metal ion (30-32)), the toxicity may vary greatly between different types of NPs. With the potential for increasing release to the environment and subsequent ecological impact, the demand for suitable detection methods is growing as well.
4
1.4 The need for advancements in nanometrology
The predicted environmental concentrations of NPs in the ppt range or below provide the need for advanced methods capable of detecting extremely small quantities of these materials. Many commonly used techniques for particle detection, quantification, and characterization have detection limits much higher, in the ppm or higher range.
Electron microscopy methods such as TEM and SEM are excellent for providing
characterization information on NPs, such as size, shape, and aspect ratio. These techniques can be coupled with EDS to obtain NP elemental composition as well. However, using these
techniques to detect NPs at concentrations predicted in the environment would be prohibitively time-consuming, as the instrument user could spend hours to find a single particle in the microscope view.
DLS is a widely used technique for determining size distributions of particles, and is inexpensive and high throughput. However it requires concentrations at the ppm level or above, which makes it unsuitable for environmental analysis. In addition, the presence of a small fraction of large particles or aggregates can greatly skew the size distribution towards larger sizes, making it unreliable for environmental samples where transformations such as dissolution, aggregation, and adsorption of NPs is likely to create highly polydisperse size distributions (8).
The family of FFF techniques such as flow FFF and sedimentation FFF provide high resolution separation of a wide range of particle sizes and can generate size distributions via coupling to a variety of detectors. Use of ICP-MS as a detector provides elemental composition and ppt detection limits; however dilution in the FFF channel typically results in method detection limits in the ppb range. Sample pre-concentration can be used to improve this, however, making FFF-ICP-MS a potentially powerful technique for environmental analysis of
NPs. One can excee samples. A environm analytica already c signal fro represent Figure 1. metal, wi collecting e drawback i ed one hour, A technique t mental detect al labs, the IC containing on om only a sin tation of the .3. Top half ith relatively g data over v is sample run , making it p
that has rece tion of NPs i CP-MS, so li ne. It works ngle particle technique re of diagram s y constant sig very short dw n time: some potentially ti ently seen a l is spICPMS. ittle to no ne by setting th e will be capt esults and ho shows ICP-M gnal output. well, or read 5 e types of FF me-consumi large increas . This techni ew instrumen he dwell, or tured at a tim ow it differs MS response Lower half ding, times w FF analyses, ing for analy
se in develop ique uses an ntation or eq reading, tim me. Figure 1 from a tradi e for tradition shows how which may co , such as sed ysis of a larg pment and us instrument quipment is n me to 10 ms o .3 shows a s itional ICP-M nal analysis spICPMS w ontain single dimentation F ge number of se for present in m needed for la or less so the schematic MS analysis of dissolved works by e NPs. FFF, f most abs e . d
6
Chapter 3 describes in more detail the spICPMS method, including the equations for interpreting data and developing size distributions.
1.5 Thesis organization
This chapter is meant to give a brief overview of the current state of science with regard to NP incorporation into products, potential release to the environment, and motivation for developing methods for their detection, characterization, and quantification.
As NP stability/solubility is highly important for determining both environmental fate and potential toxicity, Chapter 2 details work performed on quantifying the dissolution of ZnO NPs in a variety of matrices. The original hypothesis was that ZnO NPs could be detected by spICPMS analysis. Attempts at spICPMS analysis of ZnO NPs merely showed elevated
background signal indicative of particle dissolution. This provided the basis for the further study of ZnO solubility, with the hypothesis that ZnO NP dissolution rate and extent would vary with matrix as well as temperature. ZnO NPs are often cited as being toxic, possibly due to particle solubility. However previous studies have not thoroughly quantified this phenomenon, likely because they were only concerned with the toxicity results and not the NP stability. ZnO NP dissolution was analyzed in matrices relevant to the environment such as synthetic moderately hard water, and in matrices relevant to cellular toxicity testing such as DMEM and RPMI.
Chapter 3 deals with use of spICPMS in detection and characterization of NPs with non-uniform size distributions. The hypothesis of this study was that non-non-uniform NPs with a broad size distribution could be sized accurately with comparison to other characterization techniques, as this had not been demonstrated previously. Materials such as TiO2, CeO2, and Ag nanowires
7
SdFFF and TEM. Recommendations on particle concentration ranges for spICPMS are made as well, to develop accurate size distributions.
The detection of CNTs using residual catalyst metals is the focus of Chapter 4. It is very challenging to detect CNTs in the environment due to the carbon background from cells, detritus, and in sediments and soils. The hypothesis was that detection of catalyst metals uncommon in the environment such as cobalt or yttrium could be used as a proxy for the CNTs. A CNT-nanocomposite was made and used for a product release scenario, with CNT release quantified and scaling with mass loading in the composite material.
8
CHAPTER 2
SOLUBILITY OF NANO-ZNO IN ENVIRONMENTALLY AND BIOLOGICALLY
IMPORTANT MATRICES
Adapted from previously published version: R. B. Reed, D. A. Ladner, C. P. Higgins, P.
Westerhoff, J. F. Ranville, “Solubility of nano-zinc oxide in environmentally and biologically important matrices.” Environ Toxicol Chem 31, 93-99 (2012)
2.1 Introduction
ZnO NPs have found use in a variety of products and applications such as
semiconductors, catalysts, paints, and are increasingly found in consumer products such as sunscreen due to ZnO’s strong ultraviolet light absorption properties (33). Increased production and use of ZnO NPs suggests increased exposure potential for humans and other organisms. Although studies quantifying exposures of humans to engineered NPs are scarce, it is likely that increased industrial production will lead to human contact and NP exposures (dermal,
inhalational, and ingestion) (34). These routes of exposure are well studied for various particles previously termed “sub-micron” in size (35-37), many of which are in the nanometer size regime. These previous risk assessments provide a starting point for analyzing risks associated with engineered NPs, but further studies are needed due to their novel properties.
Release of NPs into the environment (e.g. through wastewater treatment plant effluent) should increase ecosystem exposure, though this is difficult to quantify. Modeling efforts indicate that environmental ZnO NP concentrations may currently be high enough (0.3 μg/L in the U.S.; 0.432 μg/L in Europe) in wastewater treatment plant effluent to pose a toxicological
9
threat to aquatic organisms (5). Monitoring NP transformations in relevant matrices (38-40) enables an evaluation as to how long particles may persist in environmental or biological systems.
Release of NPs to the environment may create an ecological hazard. ZnO NP toxicity to animals has been studied using in vitro tests (10, 25, 41-43) and in vivo tests (22-24, 26, 44-46). When compared to other NPs, ZnO has often been found to be among the most toxic (10, 21,
22). Although ZnO NPs have been reported to have greater toxicity than dissolved Zn2+ alone (43), the general consensus is that these particles dissolve relatively quickly and the Zn2+ ionis the primary source of toxicity (22, 23, 25). A recent toxicology study by Poynton et al (47) suggests that both ZnO NPs and Zn2+ are toxic, but have different modes of action. George et al (48) showed that iron-doping of ZnO NPs led to reduced dissolution and thereby decreased cytotoxicity, suggesting the possibility for manufacture of “safer” nanomaterials; however another study examining the effects of iron-doped ZnO on bacterial toxicity (49) showed that water chemistry influenced toxicity far more than doping.
With increasing human exposure to these engineered NPs, data reflecting their behavior in systems at physiological temperature and pH become more valuable. As Zn2+ released by ZnO
NPs is generally accepted as an important contributor to ZnO NP toxicity, it is crucial to quantify both the amount of Zn2+ generated from a given dose of NPs as well as the rate of ZnO
dissolution to Zn2+. Here we compare dissolution of several ZnO NPs with bulk ZnO and a dissolved Zn reference (ZnCl2) in biologically and environmentally relevant matrices. While
previous studies have measured the amount of dissolved zinc released by ZnO NPs in simple solutions (23) and in cell culture media used for toxicity studies (43), to our knowledge, the present study is the first to quantify ZnO NP dissolution with multiple particle types and sizes in
10
a variety of matrices and temperatures. The goal of the present study was to examine how the extent and rate of ZnO NP dissolution varies with matrix, temperature, and particle source. In addition, a methodological comparison between 0.02-μm pore syringe filters and centrifugal ultrafilters was made to determine if one was more effective than the other at separating particulate from dissolved species.
2.2 Experimental
2.2.1 Materials
Zinc oxide particles used include a bulk powder (Alfa Aesar, 99.99% purity by metals basis) and three different aqueous NP suspensions (Alfa Aesar 44904, 45409, and 45588, purity not given by manufacturer). A fourth NP, in powder form, was obtained from the University of California, Los Angeles (UCLA) as a reference material for toxicology studies being
concurrently performed by a consortium of research groups at several institutions in the United States. An ionic zinc source (ZnCl2, reagent grade, Fischer Scientific) was used as a dissolved
zinc control.
2.2.2 Characterization of NPs
A Zetasizer Nano ZS (Malvern) was used to determine the hydrodynamic diameter by dynamic light scattering. Samples of 100 mg/L ZnO dispersed in nanopure water (Nanopure Diamond, Barnstead) were analyzed in triplicate and the mean diameter ± standard deviation is provided for each particle in Table 2.1.
11
Table 2.1. Characterization of bulk and nanoparticulate ZnO by SEM, DLS, and zeta potential measurements. The Alfa Aesar NPs were observed to have polydisperse size distributions by SEM . Error in DLS and zeta potential values is the standard deviation of the mean values reported by the instrument. Additional analysis of all five particles by XRD confirmed materials as ZnO (Zincite).
Manufacturer's reported size (nm) Morphology by SEM Size by DLS (nm), n = 3 Surface charge by Zeta at pH ~8 (mV), n = 2 Bulk - Irregular 1920±151 -14.8±1.2 Alfa Aesar 44904 70 Irregular Angular 274±8 -18.5±1.2 Alfa Aesar 45409 40 Rounded 159±4 -21.6±3.7 Alfa Aesar 45588 70 Angular 179±3 -23.4±3.1 Consortium 25 Spheroid 215±15 -29.2±1.0
Zeta potential measurements were also performed using the Malvern Zetasizer Nano ZS on 100 mg/L ZnO solutions in nanopure water. The measurements were taken in duplicate and reported as mean ± standard deviation. The pH of the solutions for the zeta potential
determinations was measured to be approximately 8.
XRD with a Philips X’pert Pro Diffractometer (PANalytical) was performed to confirm the NPs’ chemical identity as ZnO. The solid powders were placed in sample holders and analyzed with Cu Kα radiation at 2θ angles from 5o to 90o. The aqueous NP suspensions were
prepared for analysis by placing a few drops of solution onto glass microscope slides and drying overnight to produce a solid ZnO sample. These were analyzed by the same method as the powders. Analysis of Zn precipitate formed in RPMI was also performed by XRD. A solution of ~80 mg/L Zn from aqueous ZnCl2 stock solution in RPMI was centrifuged at 4000 rpm for 40
12
A JSM-7000F (JEOL) field mission scanning electron microscope (SEM) was used to image the particles for general information on particle size and particle morphology. The
samples were analyzed at 2.0 kV and imaged at 45-55,000x magnification, except the larger bulk ZnO, which was imaged at 25,000x. The samples were prepared as 100 mg/L ZnO solutions, spotted and vacuum dried on a 47mm 0.1 μm-pore size polycarbonate filter membrane (Nuclepore). This was then fixed to a sample mount with carbon tape and gold sputter-coated prior to analysis. This instrument was used in concert with EDS (EDAX Genesis Energy) to determine the elemental composition of precipitates formed in moderately hard water and RPMI. Zinc precipitates from moderately hard water and RPMI were collected as described for XRD analysis and fixed to carbon tape on a sample mount for analysis. Blank solutions of moderately hard water and RPMI (no Zn added) were centrifuged under the same conditions to ensure any precipitate observed was not solely a product of the matrix. No precipitates were observed in the blanks. The results of NP characterization are shown in Table 2.1 and Figure 2.1.
Figure 2.1. SEM and TEM images of ZnO particles: A) Bulk; B) Alfa Aesar 44904; C) Alfa Aesar 45409; D) Alfa Aesar 45588; E) Consortium (TEM, supplied by UCLA after synthesis)
13
2.2.3 Dissolution experiments
A long-term dissolution study was performed to investigate the equilibrium solubility of Zn2+ from dissolving 100 mg/L NP solutions in four matrices: nanopure water, EPA moderately hard water (50), DMEM (D5796, Sigma), and RPMI (R8758, Sigma) cell culture media. These media were chosen because of their use in toxicity studies and their differing constituents which may control solubility, particularly phosphate (0.906 mM in DMEM and 5.64 mM in RPMI; both buffered at pH 7.3; Table 2.2 for full constituent list).
Table 2.2. Concentrations of inorganic constituents in aqueous matrices: moderately hard water, DMEM (51), and RPMI (51). DMEM and RPMI matrices contain NaHCO3 in addition to
constituents listed in references.
Moderately hard water (mg/L) DMEM (mg/L) RPMI (mg/L) NaHCO3 96 3700 2000 CaSO4*2H2O 60 KCl 4 400 400 MgSO4 60 97.67 48.84 Ca(NO3)2*4H2O 100 MgSO4*7H2O 100 NaCl 6400 6000 Na2HPO4 800 NaH2PO4*H2O 125 CaCl2 200 Fe(NO3)3*9H2O 0.1
Additional matrices were created by adding 2 mg/ml BSA to DMEM and RPMI solutions to investigate possible effects of protein presence on NP dissolution. ZnO samples were prepared in 500 ml high-density polyethylene bottles which were first placed in a 5% HNO3 (Fischer
Scientific) acid bath overnight and rinsed thoroughly with nanopure water to prevent residual zinc contamination. Preparation and filtration of solutions were performed in a filtered-air
14
laminar flow hood to prevent both zinc and microbial contamination. Care was taken to avoid touching bottle interiors while sampling; samples were poured directly into syringes, with no pipet tips being placed into bottles. No microbial growth was observed over the course of the experiment. All bottles were sealed at all times except when sampling. Between subsequent timepoints, all bottles were placed vertically on a shaker table running at approximately 80 RPM to prevent settling of NPs.
Background levels of zinc in the matrices were determined by filtering and analyzing a sample of each matrix prior to adding ZnO particles. Addition of ZnO to a bottle was followed by inversion to mix the solution and immediate collection and filtration of a subsample to obtain a t = 0 h value for dissolved Zn2+. Syringe filters with 0.02 μm pores (Anotop 25mm, Whatman) were used to separate dissolved Zn2+ from ZnO NPs. Dissolved Zn2+ concentration was
determined by ICP-MS (Perkin Elmer Elan 6100) and ICP-AES (Perkin Elmer Optima 5300 DV) after acidification to 2% HNO3. Mixed-metal standards were used for instrument calibration
prior to each analysis, and check standards were analyzed at the beginning and end of each run as well as after every ten samples for quality control. To calculate NP dissolution rates, long-term dissolution data for dissolved Zn vs. time were fit to linear models of the form [Zndissolved] =
slope*time + intercept using OriginPro 8.1.
In addition to 100 mg/L ZnO, a particle concentration more relevant to toxicity exposure tests (10, 21, 24, 52, 53), 10 mg/L, was prepared for short-term dissolution studies in cell culture media. The effects of temperature on dissolution were also examined. Solutions of DMEM and RPMI were maintained at room temperature (20oC) and human body temperature (37oC) during
dissolution of 100 mg/L and 10 mg/L ZnO (Alfa Aesar 44904 and consortium) and ZnCl2. After
15
immediately with Anotop 0.02-μm pore filters. The solutions were stored overnight on shaker tables at both room temperature and in an incubator at 37oC and filtered again at 24 h. Zinc concentration in the filtrate was determined by ICP-AES (Perkin Elmer Optima 5300 DV).
2.2.4 Equilibrium modeling
Chemical equilibrium modeling using Visual MINTEQ Version 3.0 was performed to predict if Zn-containing precipitates would be formed after NP dissolution to Zn2+ in moderately hard water and RPMI. The inorganic constituents of each matrix were entered into the model and each used to calculate saturation indices in the presence of 8 and 80 mg/L Zn2+ (for 10 and 100 mg/L ZnO, respectively).
2.2.5 Ultrafiltration experiment
Complementary short-term dissolution experiments were performed using centrifugal ultrafilters (Amicon Ultra, Millipore) to separate particles from ionic Zn2+. Alfa Aesar 44904 and consortium NPs were used to compare separation effectiveness of the 0.02-μm pore syringe and centrifugal filters. For centrifugal filtration experiments: NP solutions were made in nanopure water, EPA moderately hard water, DMEM, and RPMI at a concentration of 10 mg/L ZnO and tested separately with 100 kDa membranes. ZnCl2 solutions at a concentration of 8.37 mg/L
(0.12 mM Zn, the same as the NP solutions) were made in the same matrices as a test for Zn precipitation. Ten ml of NP suspension or ZnCl2 solution were added to the filtration device and
centrifuged for 30 min at 5000 g. The permeate was collected and saved for analysis. Nanopure water was then added to the concentrate side of the filtration device and shaken by hand to resuspend NPs collected on the membrane. The resuspended concentrate was weighed and
16
analyzed at the same time as the permeate. Analysis of dissolved zinc was performed by ICP-AES (iCAP 6300 Duo, Thermo) after acidification with 3% HNO3. Because resuspension of the
NPs from the centrifugal filter membrane allowed a systematic calculation of recovery, the rejection data complemented the filtrate concentration data. This approach to obtaining a mass balance was not possible with the sealed syringe filters, where sample handling for recovery determination was not feasible. In addition, five different ultrafilter MWCO (3, 10, 30, 50, and 100 kDa) were compared for separation effectiveness using Alfa Aesar 44904 and consortium NPs.
2.3 Results and Discussion
2.3.1 Dissolution in nanopure and moderately hard water
Quantification of Zn2+ following 0.02-μm pore filtration showed similar degrees of dissolution for each of the three Alfa Aesar ZnO particles in nanopure water, with all three solutions exceeding 7 mg/L of Zn2+ after 810 h (Figure 2.2a).
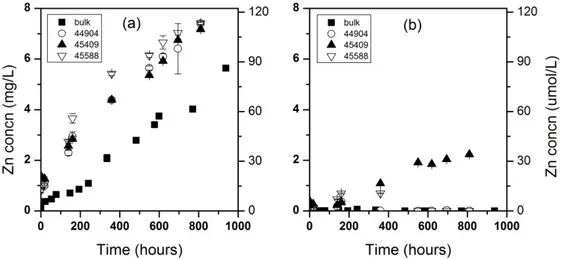
Figure 2.2. Long-term dissolution of 100 mg/L bulk and nano ZnO (Alfa Aesar 44904, 45409, and 45588) in nanopure water (a) and moderately hard water (b). Y-axis for all graphs is Zn concentration in filtrate. Error bars are 95% confidence intervals.
17
Comparing rates of particle dissolution, the bulk ZnO (5.56 μg L-1 hr-1) was slower to dissolve than all three NPs (7.43 to 8.48 μg L-1 hr-1) (Tables 2.3-2.6).
Table 2.3. Linear model data fitting parameters for long-term dissolution of bulk ZnO in various matrices.
Matrix Slope (μg L-1 hr-1) Intercept (mg L-1) Adjusted R2 Nanopure 5.56 0.106 0.981 Mod. Hard -0.0120 0.00762 0.190 DMEM 1.26 3.65 0.0535 DMEM + BSA 8.10 9.14 0.666 RPMI 0.617 0.319 0.170 RPMI + BSA 5.07 2.86 0.525
Table 2.4. Linear model data fitting parameters for long-term dissolution of Alfa Aesar 44904 nano-ZnO in various matrices.
Matrix Slope (μg L-1 hr-1) Intercept (mg L-1) Adjusted R2 Nanopure 8.13 1.06 0.986 Mod. Hard -7.79*10-9 0.0119 0.0433 DMEM 14.4 7.83 0.836 DMEM +BSA 8.84 12.6 0.558 RPMI 2.41 2.13 0.865 RPMI + BSA 1.15 8.99 0.147
Table 2.5. Linear model data fitting parameters for long-term dissolution of Alfa Aesar 45409 nano-ZnO in various matrices.
Matrix Slope (μg L-1 hr-1) Intercept (mg L-1) Adjusted R2 Nanopure 7.43 1.35 0.993 Mod. Hard 2.77 0.0781 0.849
Table 2.6. Linear model data fitting parameters for long-term dissolution of Alfa Aesar 45588 nano-ZnO in various matrices.
Matrix Slope (μg L-1 hr-1) Intercept (mg L-1) Adjusted R2 Nanopure 8.48 1.13161 0.954 Mod. Hard 0.00210 0.00112 -0.138
18
This could be attributed to a greater specific surface area of the smaller NPs relative to the larger bulk-phase particles. In moderately hard water (Figure 2.2b) dissolution of the bulk and two of the NPs was minimal. Interestingly, the smallest particle (Alfa Aesar 45409, 40 NP) showed dissolution to 2.24 mg/L Zn2+ at 810 h in moderately hard water, also suggesting a specific surface area effect. A relatively small amount of dissolution in moderately hard water suggests that ZnO NPs may persist in the environment once released.
To explain the observed differences in the amount of apparent dissolution, equilibrium chemical modeling was conducted to determine the potential for zinc that dissolved from NPs to reprecipitate. Modeling of dissolved zinc in moderately hard water by Visual MINTEQ suggests that dissolution of ZnO NPs results in oversaturation of Zn2+ with respect to a solid phase of hydrozincite, Zn5(CO3)2(OH)6, with possible additional phases of ZnCO3 and ZnO (zincite)
(Table 2.7).
Table 2.7. Visual MINTEQ simulation results for saturation indices of Zn-containing solids in DI, moderately hard water, DMEM, and RPMI. Modeling input for [Zn2+] added to each matrix was determined by experimental results for the maximum dissolved Zn observed in each matrix. Saturation index is calculated as SI = log IAP- log Ksp. Species with empty cells were not
predicted to precipitate in the corresponding matrix. Solid species DI Moderately hard
water DMEM RPMI Hydrozincite 4.161 6.279 5.54 3.115 Smithsonite 0.531 0.924 2.25 1.609 ZnCO3 0.431 0.824 2.15 1.509 Zincite (ZnO) 0.414 ZnCO3•H2O 0.284 1.61 0.969 Zn3(PO4)2•4H2O 5.276 5.804
A water aft well (Fig confirma Figure 2. after add Z nanowire observed pores (0. Also, sol (55) and Atomic weigh er addition o gure 2.3), tho ation of this b .3. Energy di dition of 80 m Zn solid phas e species from d (54). Preci 02 μm) used lid precipitat effectively r ht percents b of ZnCl2 sup
ough the sma by XRD ana ispersive x-r mg/L Zn. se changes fr m ZnO nano ipitates over d in this stud tes of CaCO3 remove them by EDS anal ported the m all mass of p alysis. ray spectrum rom NPs hav owires after 20 nm in pa dy and would 3 large enoug m from soluti 19 ysis of preci modeling pre precipitate ob m of precipita ve been repo exposure to article diame d not contrib gh to be reje ion as well. ipitates colle ediction of hy btained did n ates formed orted: sponta ambient air eter would be bute to dissol ected by filtr ected from m ydrozincite f not allow for
in moderate
aneous forma levels of wa e rejected by lved zinc con ration may a
moderately h formation fa r further
ely hard wate
ation of ZnC ater and CO2 y the largest ncentration. adsorb zinc io hard airly er CO3 2 was filter ons
20
2.3.2 Dissolution in cell culture media
In DMEM and RPMI cell culture media, a higher extent of dissolution was observed when compared to nanopure or moderately hard water. In DMEM, an apparent instantaneous dissolution was observed for all NPs, with slow subsequent increase in dissolved Zn (Figure 2.4a).
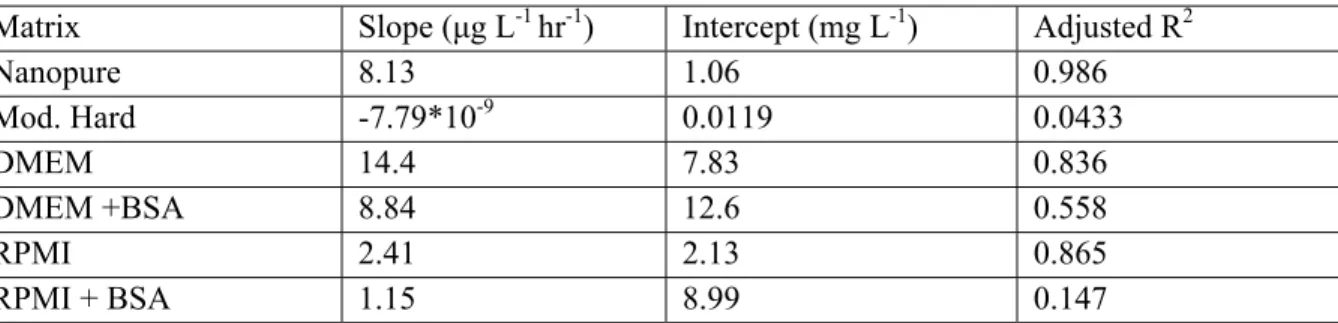
Figure 2.4. Long-term dissolution of 100 mg/L bulk and nano ZnO (Alfa Aesar 44904) in Dulbecco’s Modified Eagle’s Medium (DMEM) (a) and Roswell Park Memorial Institute medium (RPMI) (b) (each with and without 2 mg/ml bovine serum albumin (BSA).) Error bars are 95% confidence intervals.
Dissolved zinc from bulk ZnO increased quickly over the first 24 h and remained relatively constant before reaching an eventual maximum of 8.45 mg/L. The dissolved zinc resulting from dissolution of Alfa Aesar 44904 showed an immediate Zn2+ solubility over 10 mg/L, and eventually climbed to 34.2 mg/L at 1446 h. In this experiment, there was an excess of ZnO NPs added to the cell culture media (100 mg/L). However, the fast dissolution to reach a dissolved Zn concentration over 10 mg/L suggests that lower starting NP concentrations may completely dissolve to Zn2+ in this medium.
21
A greater extent of dissolution (13.6 mg/L) was observed for the bulk ZnO in the
presence of BSA. Particle-protein complexes that create a protein corona on the particle surface have been studied (56-59) and the extent of protein complexation may greatly affect how these particles interact with biological systems. These coronae could affect stability of the particles and cause a change in their dissolution. Although BSA-containing solutions quickly clogged the filter pores in this experiment, some amount of BSA (8 NP for an average monomer (60)) could be passed through the 0.02-μm pore filters with bound zinc (61), increasing the zinc concentration in the filtrate.
In RPMI, a smaller difference in dissolved zinc between bulk- and NP-containing
solutions was observed (Figure 2.4b). The nanoparticulate ZnO appears to dissolve more than the bulk, but the difference between the phases is not as pronounced as in DMEM. A lower overall solubility for both phases was observed as well, with the nano ZnO reaching 4.66 mg/L at 1446 h. Modeling by Visual MINTEQ predicted Zn3(PO4)2•4H2O to precipitate in RPMI (Table 2.7;
using inorganic substituents for modeling only; RPMI also contains vitamins not included in Visual MINTEQ’s library). Analysis of collected precipitates by EDX showed atomic ratios in agreement with this prediction (Figure 2.5).
A greater amount of solid precipitated in RPMI than in moderately hard water, and XRD analysis was performed to confirm the crystal structure with the closest library match being a zinc phosphate hydrate phase. A higher amount of phosphate is contained in RPMI than in DMEM (Table 2.2), which may account for much of the difference in solubility. Although we did not observe precipitates forming in NP-containing solutions themselves due to the large quantity of NPs already present, it can be inferred from precipitate analysis after addition of ZnCl2 to these matrices that Zn2+ released by dissolving NPs in a given matrix may simply
Figure 2. mg/L Zn precipitat T behavior time scal solubility high loca have bee nervous s .5. Energy di . te in another This long-term in some bio les, lodging o y of ZnO NP al concentrat n found to b system (63). ispersive x-r r form and n m dissolutio ological syste of particles i Ps in simulat tions of disso be transporte It is not kno ray spectrum not be presen n of ZnO NP ems. While i in the lungs ted biologica olved Zn if l d from the lu own if ZnO N 22 m of precipita nt as either N Ps in cell cu ingestion an (62) can hav al matrices su lodged in the ungs to com NPs would p ates formed NPs or dissol ulture media nd dermal exp ve long-term uggests thes e lungs. In ad mpartments su persist in thi in RPMI aft lved Zn. could be use posures occu m effects. The se particles c ddition, inha uch as the liv is environme ter addition o eful in predi ur over shor e observed could create aled TiO2 NP ver, heart, an ent long eno
of 80 cting rter very Ps nd ugh
23
to exhibit similar transport behavior due to their higher solubility, but exposure to ZnO would likely result in elevated dissolved Zn concentrations.
2.3.3 Effect of temperature on dissolution
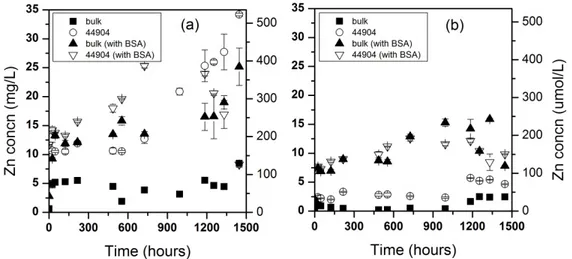
For 100 mg/L ZnO samples in DMEM and RPMI, a consistent trend toward less zinc dissolution in a 24-hour period was observed at 37oC when compared to 20oC (Figure 2.6).
Figure 2.6. Dissolution of 100 mg/L ZnO NPs (Alfa Aesar 44904, consortium) in Dulbecco’s Modified Eagle’s Medium (DMEM) and Roswell Park Memorial Institute medium (RPMI) after 0 and 24 h at both 20 and 37 oC. A dissolved zinc control (100 mg/L Zn from ZnCl2) was also
24
A very consistent decrease in zinc solubility at 37oC was observed in DMEM, with dissolved Zn concentrations around 6-7 mg/L for both particles at 0 and 24 h, as opposed to ~12-13 mg/L at 20oC. As the enthalpy of ZnO dissolution is negative (64), it is expected that an increased temperature would result in lower Zn2+ solubility. As observed in long-term experiments, immediate dissolution of ZnO in RPMI to ~2 mg/L occurred, and this was still evident after 24 h at 20oC for ZnO NPs. The difference in zinc solubility between temperatures in RPMI is not as large as in DMEM, but a slight decrease was observed for all NPs at 37oC. For ZnCl2 in DMEM, a similar constancy at 0 and 24 h and difference in solubility is seen between
20oC and 37oC as in the NP solutions; however the concentrations are higher, approximately twenty-five and seventeen mg/L respectively.
At 10 mg/L ZnO, instantaneous dissolution behavior was also observed for the Alfa Aesar NP (Figure 2.7). However, at this concentration, the consortium NP was not observed to undergo the same immediate dissolution in DMEM as it exhibited at 100 mg/L. This could be due to a smaller degree of specific surface area for the consortium NP relative to the Alfa Aesar NP: the consortium NP is a powder which tends to remain as large aggregates of NPs in solution, reducing its available surface area, while the Alfa Aesar NP is well dispersed in aqueous
solution. While aggregation may affect dissolution rates, the potential for this effect was not a focus of the present study.
Although this study was not designed to address the toxicity of the NPs examined, it has implications for toxicity research. In DMEM, the relatively high zinc solubility and
instantaneous dissolution of some ZnO NPs raises questions about the ability to assess toxicity of these NPs when dosed in this medium. If this medium or another with similar zinc solubility were to be used in toxicity studies, it could be incorrectly concluded that the NPs are
25
Figure 2.7. Dissolution of 10 mg/L ZnO NPs (Alfa Aesar 44904, consortium) in Dulbecco’s Modified Eagle’s Medium (DMEM) and Roswell Park Memorial Institute medium (RPMI) after 0 and 24 h at both 20 and 37 oC. A dissolved zinc control (ZnCl2) was also used to test for Zn
precipitates in these cell culture matrices.
responsible for any observed toxic effect, although there may be no actual NP exposure due to their dissolution. Therefore, caution should be exercised in attributing toxicity to NPs if the solubility of Zn in the matrices used is not well known: solution chemistry appears to play a major role in the dissolution of ZnO NPs. In addition, particle type also appears to affect solubility. This is evidenced by the differences in behavior between bulk phase and
26
Solution temperature also had an effect on NP dissolution in cell culture media, demonstrating that ZnO NPs may behave differently at human body temperature as opposed to room
temperature.
2.3.4 Separation of zinc species by ultrafiltration
In an attempt to provide increased resolution of NP size and develop alternative filtration practices for NPs in biological testing, centrifugal ultrafiltration of samples was conducted and the results compared against 0.02-μm pore filtration. Syringe and centrifugal filters have been compared for quantification of dissolved Pb2+ released from PbS NP aggregates with similar effectiveness (65). Overall, ZnO dissolution in the same four matrices (nanopure water,
moderately hard water, DMEM, and RPMI) as determined by centrifugal filtration experiments exhibited similar behavior as when filtered by 0.02-μm pore filters (Figure 2.8).
Further, all five ultrafilter sizes (3 to 100 kDa) behaved similarly (Figure 2.9), suggesting they all adequately discriminated between nanoparticulate and dissolved zinc.
In the ultrafiltration experiments, the feed concentration was measured (and plotted in Figure 2.8 as the sum of dissolved and particulate zinc) for each replicate. The centrifugal
filtration takes approximately 30 min, so a t = 0 data point is more likely to be between 0.5 and 1 h. This additional time could allow for a greater amount of NP dissolution relative to syringe filtration, where the first filtrate is collected approximately one minute after suspension of NPs. Compared with nanopure water, NPs in moderately hard water showed less dissolution after 24 h: 0.69 mg/L Zn for Alfa Aesar 44904 and 1.1 mg/L for the consortium particle. Moderately hard water also prevented the soluble zinc source (ZnCl2) from passing through the membrane, again
27
Figure 2.8. Particulate and dissolved zinc concentrations in various matrices at 20oC after 0 and 24 h using ~10 mg/L Alfa Aesar 44904 (a) and consortium ZnO (b) NPs. ZnCl2 (c) was used as a
dissolved zinc control to test for possible Zn precipitation in solution. Dissolved concentration was measured directly in the filter permeate; particulate concentration is calculated as ([Zn]feed
-[Zn]permeate.) Total column height (black + white) represents measured feed Zn concentration.
Lower permeate Zn concentrations from the filtered ZnCl2 solution after 24 h suggests
continued precipitation over this time period. The culture fluids RPMI and DMEM again showed an immediate dissolution of NPs and little increase past that point after 24 h. The bulk of the data suggests relatively stable solubility maxima for aqueous zinc species in these matrices. However, the increase in solubility in DMEM after 600 h may indicate a more complex process may
28
control zinc solubility. These studies indicate that small pore filters and ultrafilters provide comparable data for ZnO NPs related to dissolution and potential reprecipitation.
Figure 2.9. Permeate concentrations for Alfa Aesar 44904 and Consortium ZnO filtered with five UF membrane pore sizes at zero and 24 hours in nanopure water. Feed concentrations at zero hours were measured to be 17 and 11 mg/L as Zn for Alfa Aesar 44904 and Consortium, respectively.
29 CHAPTER 3
OVERCOMING CHALLENGES IN ANALYSIS OF POLYDISPERSE METAL-CONTAINING NANOPARTICLES BY SINGLE PARTICLE INDUCTIVELY COUPLED
PLASMA MASS SPECTROMETRY
Adapted from previously published version: R. B. Reed, C. P. Higgins, P. Westerhoff, S.
Tadjiki, J. F. Ranville, Overcoming challenges in analysis of polydisperse metal-containing nanoparticles by single particle inductively coupled plasma mass spectrometry. Journal of Analytical Atomic Spectrometry 27, 1093-1100 (2012)
3.1 Introduction
With the rapid rise in applications for engineered NPs, they have been increasingly incorporated into industrial and consumer products. Among the most widely used metal-containing NPs are Ag, TiO2, ZnO, and CeO2. Silver NPs are used in the greatest number of
consumer products due to their antimicrobial properties, and can be found in items from athletic gear to pacifiers (66). A variety of products contain nano TiO2, which has been investigated for a variety of applications such as photocatalysis (3), environmental remediation (67), and is used in consumer products such as toothpaste and sunscreen (68, 69) and is seen increasingly in food (4). Nano ZnO is also found in cosmetics like sunscreen (33) as well as being touted as an effective semiconductor (70). Cerium oxide NPs are utilized for polishing (71) and combustion emissions catalysis (72). With this increasing use comes concern regarding the potential ecological and human health risks of exposure to these materials. All of the NPs listed here have potential for release to the environment as a result of their varied applications. Predicted environmental concentrations from life-cycle assessments are typically in the ppt range (5, 73).
Although a myriad of laboratory toxicity studies have been performed (10, 21, 27, 29, 31,
30
environment (8), little is known regarding how various environmental parameters actually modify NP behavior and toxicity. Silver NPs are used for beneficial antimicrobial purposes, but this very property may also cause them to be ecologically harmful when released to the
environment (75). Nano TiO2 has been shown to be essentially nontoxic at concentrations
relevant for environmental exposures (21, 24), but photocatalytic effects have not been fully investigated. While nano ZnO has been demonstrated to be more toxic than Zn2+ alone (43), it is generally thought that the NPs readily dissolve to Zn2+ (76) which is in turn toxic (23). Although some studies have found nano CeO2 to be toxic (29), it has also been observed to have a
protective effect for cells (41, 74). In a study comparing toxicity of various metal oxide NPs, Brunner et al found toxic response ordered as ZnO > CeO2 ≈ TiO2 to both MSTO and 3T3 cells
(10). There is also concern about increased toxicity of NPs with high aspect ratios such as nanowires and nanotubes, as they are often morphologically similar to asbestos (77).
As the nanotechnology industry has grown, demand for methods of detecting,
quantifying, and characterizing NPs has been increasing. Although an extensive array of methods exists for use in the laboratory setting (78), many of the commonly employed methods are quite limited when applied to real-world settings (i.e. complex solution matrices, background particles, low NP concentration, polydisperse and aggregating materials). DLS works well for sizing monodisperse samples but performs very poorly in complex matrices where aggregation and dissolution may induce polydispersity; it is also particle and element non-specific. Electron microscopy provides NP size information and can be coupled with EDS analysis for elemental composition information; however it is time consuming and may be ineffective when attempting to analyze environmentally relevant concentrations (5, 73) in the μg/L or ng/L range.
31
useful for simultaneous determination of particle size and elemental composition of complex NPs (78), but these methods may also fail to reach the desired ng/L detection limit due to sample dilution in the separation step.
In this study we have examined spICPMS, a method for detecting and quantifying metal-containing NPs. The method has its origins in airborne particle analysis with concentrations in the femtogram range (79). The current spICPMS theory and development work was performed in a series of studies by Degueldre et al (80-82), and it has been suggested for use in Au NP
detection for bioanalytics (83). Briefly, introduction of a dilute suspension of NPs into the ICP-MS will result in the generation of a pulse each time an individual particle enters the plasma, is ionized and detected as a packet of ions. By collecting time-resolved data both the number concentration and the size distribution of the NP sample can be examined.
Recent work by Mitrano et al (84) and Laborda et al (85) has further developed the method for use in silver NP detection and characterization, and Pace et al (86) provided detailed discussion of the importance of instrument transport efficiency in quantification and sizing of NPs. The multi-element capability of ICP-MS suggests that spICPMS could potentially be applied effectively to the analysis of many different metal-containing NPs, provided isobaric and matrix interferences can be avoided. Additional considerations with respect to successful
application of spICPMS to the detection and quantification of any particular NP sample includes: NP size, mass percent and isotopic abundance of the analyte element in the NP, and the stability of the NP with respect to dissolution.
To the best of our knowledge, this technique has not been previously used for analysis of the NPs discussed in this work: Ag nanowires, TiO2, ZnO, and CeO2. The goal of the present
32
NPs. A particular aspect of this investigation is the use of the method for sizing of materials with broad size distributions, non-spherical shapes, and NPs for which monodisperse standards are not readily available. Because polydisperse materials were examined, and spICPMS is a particle counting technique, special consideration is given to the requirements for particle concentration and total number of instrument readings for robust detection, quantification, and size
characterization.
3.2 Experimental
3.2.1 Materials
The NPs used in this study were either purchased from commercial sources or obtained from colleagues. The TiO2 (Aldrich, #634662) and CeO2 (Inframat, #58N-0802) were obtained
as powders, and the polyvinylpyrrolidone-coated Ag nanowires (nanoComposix, #RKB3144) was received as an aqueous suspension. The ZnO NPs were synthesized as described in Wu et al (87) at the University of Iowa and were supplied as a powder. All dilutions for spICPMS
analysis were performed with 18 MΩ nanopure water (Barnstead Nanopure,) henceforth referred to as DI water. FL70 surfactant (Fischer Scientific) was used to maintain a stable suspension of CeO2 NPs for SdFFF analysis. Dissolved Ag, Ti, Zn, and Ce standards were Claritas PPT (SPEX
Certiprep) ICP-MS grade standards and were diluted in 2% HNO3 (Optima trace metal grade, Fisher). Dissolved Au standards were Claritas PPT (SPEX Certiprep) ICP-MS grade, diluted in 2% HCl (Optima trace metal grade, Fisher).
33
3.2.2 Characterization of NPs
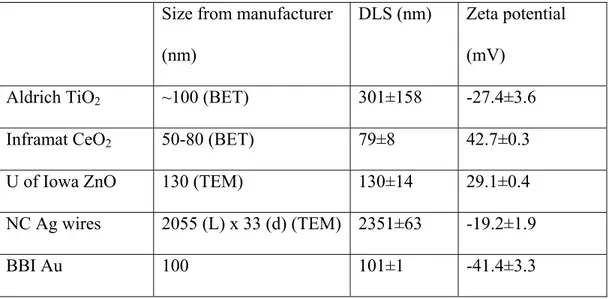
A Zetasizer Nano ZS (Malvern) was used to determine hydrodynamic diameter by DLS. Samples of each NP were dispersed in DI water at 50 mg/L and analyzed in triplicate, with the mean diameters and standard deviations provided in Table 3.1. This instrument was also used to perform triplicate Zeta potential measurements on 100 mg/L NP solutions in DI water, pH unadjusted and in the range of 5.1 to 6.6, with mean values and standard deviations reported in Table 3.1. We recognize that for the high aspect ratio silver nanowires, the hydrodynamic diameter of the particles is approximate and may not accurately represent either length or width.
Table 3.1: Characterization of NPs by dynamic light scattering and zeta potential
Size from manufacturer
(nm)
DLS (nm) Zeta potential (mV)
Aldrich TiO2 ~100 (BET) 301±158 -27.4±3.6
Inframat CeO2 50-80 (BET) 79±8 42.7±0.3
U of Iowa ZnO 130 (TEM) 130±14 29.1±0.4
NC Ag wires 2055 (L) x 33 (d) (TEM) 2351±63 -19.2±1.9
BBI Au 100 101±1 -41.4±3.3
Particle morphology information and confirmation of manufacturer reported size range was obtained using a FEI CM200 TEM. The NP samples were prepared in an ethanol solution to aid in drying. After immersion in a sonication bath for two minutes, small volumes (< 1 mL) were added dropwise onto a carbon-coated 300 mesh copper TEM grid and allowed to evaporate. The acceleration voltage used was 200 kV and magnification ranged depending on the size of the NP being analyzed.
34
Figure 3.1. BBI Au NPs TEM image
35
Figure 3.3. Aldrich TiO2 NPs TEM image
36
3.2.3 Sedimentation field-flow fractionation (SdFFF)
Two SdFFF systems (CF-2000 and S-1000, Postnova Analytics GmbH, Landsberg, Germany), were used to size the TiO2 and CeO2 NPs for comparison with spICPMS. Ultraviolet
absorbance at 350 NP (Postnova PN3241, UV diode array detector) was used for sample
detection. The TiO2 samples were analyzed in DI water, whereas CeO2 required analysis in 0.05
wt% FL-70 to maintain a stable suspension at the concentration required for SdFFF-UV/VIS analysis. Separate suspensions (5 mg mL-1) of TiO2 and CeO2 NPs were made using TiO2 and
CeO2 powders and the respective carrier solutions. The suspensions were sonicated for 30
minutes using an ultrasonic bath. The suspensions were then passed through a 0.45 µm filter to remove any large particles or aggregates that could not be dispersed during the sonication step. The sample injection volume was 100 µL. The SdFFF channel dimensions and run conditions are summarized in Tables 3.2 and 3.3.
Table 3.2: SdFFF channels dimensions
System Channel thickness (cm) Channel volume (mL) Channel radius (cm) A 0.0165 2.90 15.1 B 0.0200 2.26 10.2
37
Table 3.3: Run parameters used to analyze TiO2 and CeO2 nanoparticle suspensions Method Initial RPM Final RPM t1 (min) ta (min) Channel flow rate (mL/min) Relaxation time (min) Injection volume (µL) Carrier I 1800 100 5.6 -45.0 1.00 10 100 0.05% CTAB II 2200 57 10.0 -80.0 1.00 10 100 0.05% FL-70 De-ionized water III 3000 57 10.0 -80.0 1.00 3 100 0.05% FL-70 De-ionized water
The samples were allowed to equilibrate under an initial constant centrifugal field (5,360-10,057 m sec-2 (1800-3000 rpm) for 3-10 min prior to the start of the experiment. After an
additional 5-10 min, a power decay function (88) was used to bring the field to 50-100 rpm at the end of the analysis. The channel flow rate was set at 1 mL min-1. The particle size distributions
were constructed using FFF theory using the retention time and UV/VIS detector response (89).
3.2.4 ICP-MS Experimental Details
Solutions of each NP were made at mass concentrations in the ng/L range. The actual mass concentrations used were varied among NPs, as different-sized particles require different mass concentrations in order to have similar number concentrations, which are desired for effective analysis. Calculation of a nominal particle number concentration from mass
38
point for analysis of each NP. This avoids concentrations that would result in pulse coincidence. The polydisperse nature of the NPs used here, and the non-spherical shape of the Ag nanowires, prevents initial calculation of an accurate particle number concentration. Rather, a number concentration was estimated from the manufacturer-supplied characterization data to select a starting mass concentration range. Based on the number of NP-generated pulses obtained from spICPMS analysis of the initial solution, the final concentration range was found. The optimal number concentration is directly related to the ratio of pulses to total readings, as discussed below. A DI blank for each element was included in all analyses. Each sample was run in duplicate to examine reproducibility, and comparison of sequential analyses ensured that NPs had not settled out of solution during analysis. Stock suspensions of NPs were diluted to the desired concentrations by serial dilution with approximately 10-minute bath sonication (Fisher, FS60H) periods between performing each dilution. All dilutions were made in 15 mL Falcon polypropylene centrifuge tubes. The ICP-MS used is a Perkin Elmer NexION 300q with an S10 autosampler. Dissolved Ag, Ti, Zn, and Ce standards in the range of 100 ng/L to 10 ug/L were used for creating metal calibration curves. The concentrations of dissolved standards used for each element were dependent on pulse intensities for each NP. The dissolved standard
concentration range was chosen such that a typical NP pulse intensity value would be contained within the range of the calibration curve. Calibration blanks were included with all metal
standard curves. Previous work has shown 10 ms dwell times (readings) to be the most effective for minimizing both measurement of partial pulses and particle coincidence (86, 90). In this work a typical single run consisted of 20,000 readings. Aside from monitoring 49Ti for TiO
2 analysis
due to SO+ interferences with 48Ti, all elements were analyzed using the most abundant isotope: