Linköping University | Department of Management and Engineering Master Thesis 30hp | Produc on Economics Spring Term 2020 | LIU-IEI-TEK-A--20/03864—SE
Improving Planning Stability
A case study of Planning at AstraZeneca
Olof Schippert Sahil Ahmed
Supervisor: Ou Tang
Examiner: Veronica Lindström
Linköping University SE–581 83 Linköping +46 13 28 10 00,www.liu.se
Upphovsrä
De a dokument hålls llgängligt på Internet – eller dess fram da ersä are – under 25 år från publiceringsdatum under förutsä ning a inga extraordinära omständigheter uppstår.
Tillgång ll dokumentet innebär llstånd för var och en a läsa, ladda ner, skriva ut en-staka kopior för enskilt bruk och a använda det oförändrat för ickekommersiell forskning och för undervisning. Överföring av upphovsrä en vid en senare dpunkt kan inte upphäva de a llstånd. All annan användning av dokumentet kräver upphovsmannens medgivande. För a garantera äktheten, säkerheten och llgängligheten finns lösningar av teknisk och
administra-v art.
Upphovsmannens ideella rä innefa ar rä a bli nämnd som upphovsman i den omfat-tning som god sed kräver vid användning av dokumentet på ovan beskrivna sä samt skydd mot a dokumentet ändras eller presenteras i sådan form eller i sådant sammanhang som är kränkande för upphovsmannens li erära eller konstnärliga anseende eller egenart.
För y erligare informa on om Linköping University Electronic Press se förlagets hemsida
h p://ep.liu.se/.
Copyright
The publishers will keep this document online on the Internet – or its possible replacement – for a period of 25 years star ng from the date of publica on barring excep onal circumstances. The online availability of the document implies permanent permission for anyone to read, to download, or to print out single copies for his/hers own use and to use it unchanged for non-commercial research and educa onal purpose. Subsequent transfers of copyright cannot revoke this permission. All other uses of the document are condi onal upon the consent of the copyright owner. The publisher has taken technical and administra ve measures to assure authen city, security and accessibility.
According to intellectual property law the author has the right to be men oned when his/her work is accessed as described above and to be protected against infringement.
For addi onal informa on about the Linköping University Electronic Press and its proce-dures for publica on and for assurance of document integrity, please refer to its www home page:h p://ep.liu.se/.
Abstract
To provide high service level, an organisa on must maintain flexibility in produc on planning. This allows them to react to changes in demand and supply informa on. Changes in produc on plan decreases planning stability. Low stability has knock on effect on supply of material. This causes disrup ons in produc on and delivery as well as increased cost due to higher inventory cost, stockout costs, expedi ng cost and sub op mal setups cost. This study aims to determine the methods to improve planning stability. The factors that influence stability like planning horizon, safety stock, inventory policies are examined in detail in a real world se ng.
Literature review of exis ng work on planning stability was carried out. Single case study was used to study this phenomenon in depth at a pharmaceu cal manufacturing company. Qualita ve data regarding planning method, flow of informa on, interac on between depart-ments, me horizons were studied. Quan ta ve data includes the produc on plans across different planning cycles. Exis ng stability levels were computed to determine the future lev-els of stability required. The literature was compared with exis ng working methods to find improvements.
Plans away from the frozen period will have low stability due to forecast vola lity. But as we move closer to frozen period, higher stability should be achieved. Low planning horizon in the immediate periods are due to material supply uncertainty which can be prevented by having responsible suppliers and increasing safety stocks. Using a stabilisa on parameter can prevent rescheduling when small changes in demand occurs. This ensures unnecessary reac-on to small changes are prevented. Increasing the planning horizreac-on will provide suppliers with accurate informa on regarding quan ty and ming which will in turn help them plan bet-ter. Lastly, safety capacity in produc on can help towards handling unexpected produc on loses and thereby prevent re-planning.
Keywords: Produc on Planning, Master Produc on Scheduling, Material Requirement
Acknowledgement
This thesis could not have been possible without the help and support of many people. We would like to express our gra tude to each and every one of them.
We would like to express our special thanks to Richard Sedin, Nouf Al-Iryani and Annie Grahn from AstraZeneca for the opportunity and support to carry out this thesis. Our special thanks to Annie Grahn, who has been a great supervisor and provided us with all the necessary data and informa on. We would also like to thank everyone else at AstraZeneca who provided their me and knowledge for this thesis.
We wish to acknowledge our supervisor Ou Tang, who has provided us with guidance and expert knowledge throughout this thesis. We are also grateful for the assistance provided by our examiner Vernoica Lindström. Valuable and construc ve sugges ons given by the super-visor, opponents and examiner has been a great help in improving this report.
Linköping in June 2020
Table of Contents
Abstract iii
Acknowledgement v
List of Figures xi
List of Tables xii
List of Abbrevia ons xiii
1 Introduc on 1
1.1 Theore cal Background . . . 1
1.2 Company Background . . . 2
1.3 Problem Descrip on . . . 3
1.4 Purpose and Research Ques ons . . . 4
1.5 Delimita ons . . . 5
2 Method and Methodology 7 2.1 Method Approach . . . 7
2.1.1 Planning Phase . . . 7
2.1.2 Data Collec on Phase. . . 8
2.1.3 Analysis Phase . . . 8
2.1.4 Conclusions and Recommenda ons . . . 10
2.2 Methodology . . . 10
2.2.1 Research Approach . . . 10
2.2.2 Research Strategy. . . 11
2.3 Literature Survey . . . 12
2.4 Data Collec on Method . . . 12
2.4.1 Interviews. . . 12
2.4.2 Data from ERP System . . . 13
2.4.3 Data Anonymiza on . . . 14
2.5 Analysis Method . . . 14
2.6 Results and Discussion . . . 15
2.7 Validity . . . 15
3 Frame of Reference 17 3.1 External Planning Environment . . . 17
3.1.1 Supply Chain Management . . . 17
3.1.2 Facili es. . . 18
3.1.3 Forecas ng . . . 18
3.2 Informa on Flow . . . 20
3.2.1 Flow Theory and System Thinking . . . 20
3.2.2 Endogenous Decision Categories . . . 23
3.2.3 Exogenous Decision Categories. . . 23
3.3 Sales and Opera ons Planning . . . 25
3.4 Master Produc on Schedule . . . 27
3.5.1 Basic MRP . . . 29
3.5.2 Bill of Materials . . . 30
3.5.3 Dependent Demand . . . 30
3.5.4 Lead Time Offse ng . . . 30
3.5.5 Processing . . . 31
3.5.6 Safety in MRP . . . 31
3.5.7 Firm Planned Order, Scheduled Receipts and Planned Order Release . . 31
3.5.8 Bo om Up Re-planning. . . 31
3.6 Inventory . . . 32
3.6.1 Benefits and Drawwbacks of Inventory. . . 33
3.6.2 Type of Inventories . . . 33
3.6.3 Inventory Costs . . . 33
3.6.4 Vendor Managed Inventory . . . 34
3.6.5 Inventory Metrics . . . 34
3.7 Stability in Planning . . . 35
3.7.1 Problems with Re-Planning . . . 35
3.7.2 Reasons for Instability . . . 36
3.8 Coping with Planning Uncertainty . . . 36
3.8.1 Freezing the Schedule . . . 36
3.8.2 Safety Stock . . . 38
3.8.3 Inventory Control Policies . . . 38
3.8.4 Stability Cost . . . 40
3.8.5 Buyer Supplier Rela onship . . . 41
3.8.6 Be er Supplier Opera ons . . . 41
3.8.7 Be er Internal Opera ons . . . 42
3.8.8 Lead Time Reduc on . . . 42
3.9 Measurement of Stability . . . 42
4 Current State 47 4.1 Overview of Planning System . . . 47
4.2 Demand Planner . . . 48
4.2.1 Forecast . . . 49
4.2.2 Analysis . . . 49
4.2.3 Supply management . . . 49
4.2.4 Informa on Flow through Demand Planner . . . 50
4.3 Asset Planner . . . 50
4.3.1 Monthly planning cycle . . . 50
4.3.2 Asset Planners Central Role in the Planning Cycle . . . 51
4.3.3 Balancing capacity and demand . . . 52
4.4 Material Planner . . . 53
4.4.1 Op mizing Stock Levels for Phased Out Components . . . 54
4.4.2 Lead Times for Components . . . 54
4.4.3 How the inventory of materials work . . . 54
4.4.4 Coverage me and safety days for components . . . 54
4.4.5 Planning Process . . . 55
4.4.6 Informa on Flow through the Material Planning Department. . . 55
4.4.7 Impact of Changing Plans to Material Planning . . . 56
4.5.1 Role of Asset Planner in Formula on. . . 57
4.5.2 Role of Supply Planner in Formula on . . . 57
4.5.3 Manufacturing Lot Size . . . 57
4.5.4 Raw Material for Produc on . . . 58
4.5.5 Safety Stock of Tablet a er Formula on . . . 58
4.5.6 Informa on flowing through Formula on Planner. . . 58
4.6 Produc on. . . 58
4.6.1 Produc on Planning . . . 59
4.6.2 Informa on flowing through Produc on . . . 60
4.7 Supply Planner . . . 60
4.7.1 Planning Process . . . 60
4.7.2 Reasons for Plan Change . . . 62
4.7.3 Details of R07 and R11 . . . 63
4.7.4 Informa on flowing through Supply Planners . . . 63
4.8 Data from the Planning System . . . 64
5 Analysis 67 5.1 Informa on Flow . . . 67
5.1.1 Time horizon, Planning horizon, and Planning Cycle . . . 67
5.1.2 Construc ng an Informa on Flow Diagram . . . 67
5.1.3 Type of Informa on Used. . . 71
5.1.4 Factors for Change . . . 75
5.2 Stability Measurement . . . 79
5.3 Setup Stability . . . 79
5.3.1 Calcula on Formula . . . 80
5.3.2 Calcula on Result. . . 81
5.3.3 Instability as Distance from Planning Week . . . 84
5.3.4 Drawbacks of Setup Based Instability . . . 86
5.4 Quan ty Stability . . . 86
5.4.1 Calcula on Method. . . 86
5.4.2 Calcula on Result. . . 87
5.4.3 VMI and CMI Products . . . 87
5.4.4 Instability as Distance from Planning Week . . . 89
5.4.5 Drawbacks . . . 89
5.5 Ideal planning stability . . . 91
5.6 Analysis of Resource R07 and R11 . . . 91
5.7 Impact of Low Planning Stability . . . 92
5.7.1 Planning setup instability . . . 92
5.7.2 Quan ty Instability . . . 93
5.8 Improving Planning Stability . . . 93
5.8.1 Planning Horizon . . . 93 5.8.2 Inventory Management. . . 95 5.8.3 Buffering methods . . . 97 6 Discussion 99 6.1 Research Ques on 1 . . . 99 6.2 Research Ques on 2 . . . 100 6.3 Research Ques on 3 . . . 101
6.4 Research Ques on 4 . . . 105
6.5 Ethics and Sustainability . . . 106
7 Conclusions 107 7.1 Recommended Future Work . . . 107
8 References 109 A Appendix: Details of Interview 113 A.1 List of Interviewee. . . 113
A.2 Interview Ques onnaire . . . 113
B Appendix: Data of Goods Received and Goods Issued 115 C Appendix: Data from ERP System 117 D Appendix: Measurement of Setup Based Planning Instability 119 D.1 Sample Calcula on . . . 119
D.2 Planning Instability of Each Resource . . . 120
D.3 Setup Changes in Each Week of Planning Horizon . . . 122
E Measurement of Quan ty Based Planning Instability 125 E.1 Sample Calcula on . . . 125
E.2 Instability of Resource in Each Period . . . 125
E.3 Instability by Product Type . . . 128
List of Figures
1 Illustra on of plans created for Week 48, 2019. . . 4
2 The four phases of the study . . . 7
3 The different ac vi es of the planning phase . . . 8
4 The different ac vi es of the data collec on phase . . . 8
5 Ac vi es in Analysis Phase . . . 9
6 The three triads with handovers. Adapted from Wikner (2018) . . . 21
7 Different flow structures. Adapted from Wikner (2018) . . . 21
8 Flow structure from a logical perspec ve. Adapted from Wikner (2018) . . . . 22
9 Flow structure with SLTs. . . 23
10 Flow structure with DPs. Adapted from Wikner (2018) . . . 25
11 Linkages between MPS and other company func ons . . . 28
12 General MPC system . . . 29
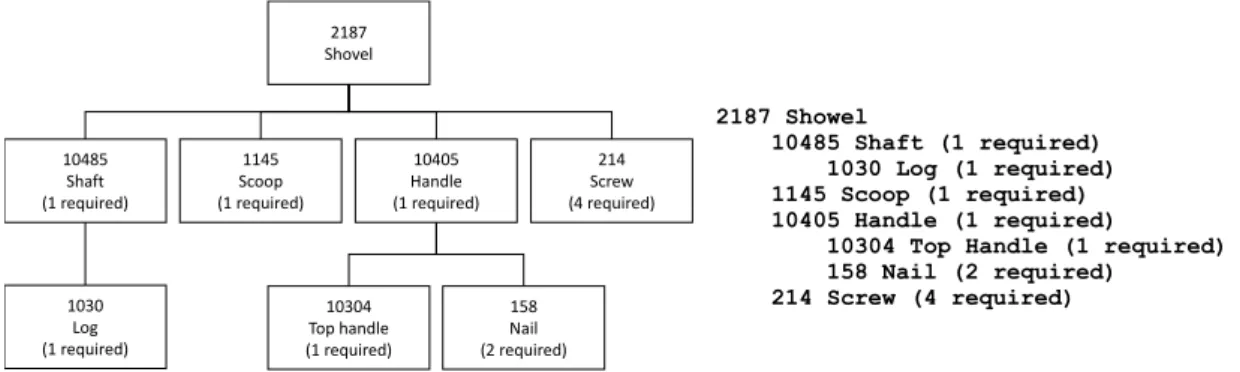
13 Two representa ons of BOM. Adapted from Vollmann et al. (2005) . . . 30
14 Different types of Uncertain es. From Koh et al. (2002) . . . 37
15 Different elements in the planning process . . . 47
16 Du es of Planner within each planning horizon . . . 48
17 Informa on flow through Demand Planner . . . 50
18 The monthly planning cycle . . . 52
19 Informa on flowing through Asset Planner. . . 53
20 Informa on flowing through Material Planner . . . 56
21 Informa on flowing through Formula on Planner . . . 59
22 Informa on flowing through Produc on . . . 60
23 Informa on flowing through Supply Planner . . . 64
24 Ac vity Flow Structure . . . 68
25 Flow network with strategic lead mes . . . 70
26 Flow network with decoupling points . . . 72
27 Time horizons of forecast informa on . . . 73
28 Use of informa on by formula on supply planners . . . 73
29 Use of demand informa on by material planners . . . 74
30 Planning horizon and ming of informa on changes . . . 75
31 Planning horizon with informa on changes . . . 76
32 Impact of demand informa on changing to DIDPs . . . 77
33 Impact of supply informa on changing on the USIDPs . . . 78
34 Weightage for each period for calcula ng setup planning instability . . . 81
35 Varia on of setup planning instability for each resource . . . 83
36 Varia on of weighted setup planning instability for each resource . . . 83
37 Weighted setup planning instability during each period . . . 85
38 Planning setup instability in each week of the me fence in planning cycle . . . 85
39 Weightage for each period for calcula ng quan ty planning instability . . . 87
40 Varia on of quan ty instability for each resource . . . 88
41 Quan ty instability during each period from Week 40, 2019 to Week 14, 2020 . 88 42 Quan ty instability of VMI and CMI products . . . 90
43 Planning quan ty instability in each planning cycle within me fence . . . 90
44 Weighted setup planning instability of each resource . . . 123
List of Tables
1 Example of an S&OP Plan from Wallace and Stahl (2008, p.23) . . . 26
2 Basic MRP with lead me 1 week and lot size of 50 . . . 30
3 Cover me and Safety days of different materials . . . 55
4 Ac vity list in the flow of packing tablets . . . 68
5 Summary of Reasons for Plan Change . . . 79
6 Average weighted setup planning instability for each period . . . 84
7 Average quan ty instability for each period . . . 89
8 Proposed maximum instability levels . . . 92
9 Summary of effect of Frozen Length . . . 94
10 Summary of effect of Planning Length . . . 95
11 Summary of suggested improvements . . . 103
12 Details of Interviewees . . . 113
13 Data of goods received (GR) and Goods Issued (GI) for Year 2019 . . . 115
14 Random fi een samples from the processed data . . . 118
15 Sample calcula on of setup based planning instability . . . 119
16 Average number of setups for each resource . . . 119
17 Setup based planning instability for each resource in each planning cycle. . . . 121
18 Maximum setup planning instability in each period . . . 122
19 Percentage change in plans in between each me unit of planning horizon . . . 124
20 Sta s cal descrip on of the setup changes in each period . . . 124
21 Planned Produc on Quan ty in each period . . . 125
22 Difference in order quan ty between each periods . . . 126
23 Stability of an SKU in each period . . . 126
24 Quan ty Instability for each resource in each period . . . 127
25 Maximum Quan ty Instability in each period and corresponding resource . . . 128
26 Share of Product Type for each Resource . . . 130
27 Quan ty Instability for VMI and CMI products in each period . . . 130
List of Abbrevia ons
API Ac ve Pharmaceu cal Ingredient
APO Advance Planner and Op mizer (Part of SAP ERP System)
BOM Bill of Materials
CADP Customer Adapta on Decoupling Point
CMI Customer Managed Inventory
CODP Customer Order Decoupling Point
CODZ Customer Order Decoupling Zone
DCDP Downstream Controllable Decoupling Point
DIDP Demand Informa on Decoupling Point
DP Decoupling Points
DSIDP Downstream Supply Informa on Decoupling Point
DZ Decoupling Zone
EnDCs Endogenous Decision Categories
ERP Enterprise Resource Planning
ExDCs Exogenous Decision Categories
ILT Internal Lead Time
KPI Key Performance Indicator
LoEs Logical En es
MCDC Marke ng Companies Distribu on Centre
MPS Master Produc on Schedule
MRP Material Requirements Planning
OSD Oral Solid Dosage
PLT Planned Lead Time
PTF Planning Time Fence
QA / QC Quality Assurance / Quality Control
SD Safety Days
SKU Stock Keeping Unit
SLT Supplier Lead Time
SLTs Strategic Lead Time
SOP Sales and Opera ons Planning
SweOps Sweden Opera ons
UCDP Upstream Controllable Decoupling Point USIDP Upstream Supply Informa on Decoupling Point
1 Introduc on
This chapter begins with theore cal background about the problem of planning stability. It con nues with a short descrip on of the organiza on where the thesis will be carried out. In the problem descrip on, the problem which the thesis will focus on is explained, it is followed by the Purpose and Research Ques ons of the thesis. The delimita ons of the thesis are specified at the end of this sec on.
1.1 Theore cal Background
The aim of an organisa on is to serve its customers. The right product in the right quan ty should be available at the right me to provide a high service level to the customers. But these parameters are o en difficult to predict. This prevents an organisa on from achieving 100% service level. Buffers such as safety stocks can be used to counteract the stochas c nature of customer demand. But a product stored in inventory will incur costs for the organisa on. In the case of perishable material, the product also loses its value over me.
If the accurate informa on about quan ty of customer demand and ming of the demand of each product is available, the required produc on quan ty during each me period can be determined. In case accurate demand informa on is not available, forecast informa on can be used to generate the produc on plan. Safety stock can be added to account for the inaccura-cies of the forecast. This is the logic used in Master Produc on Schedule (MPS). As per Jacobs et al. (2011, p. 183), and effec ve MPS, makes good use of manufacturing resources to sa sfy customer delivery promises. To generate plans for incoming components used for the product planned in the MPS, Material Requirements Planning (MRP) is used. MPS is straight-forward to implement when all informa on is available. Whenever informa on is updated, the MPS should also be updated. Net change rescheduling can be performed for small changes in data but for bigger changes, regenera ve rescheduling must be done where the en re schedule is recalculated (Koh et al., 2002). Small changes in MPS can have cascading effect on lower level parts and components in the Bill of Materials (BOM). The effect of these minor changes can result in significant quan ty or ming changes in lower levels, this is called nervousness (Herrera et al.,2016).
There are many factors that lead to changes in MPS. Koh et al. (2002) has classified fac-tors affec ng uncertainty in MPS in to two groups: Input uncertainty and process uncertainty. Input consists of factors that are external to the organisa on such as delays in supply, fore-cast changes, and customer order changes. Process refers to internal factors such as wai ng me, scrap loss, and machine breakdowns etc. Safety stock, safety lead me, lot-sizing rules, freezing the MPS, and planning rules, are some of the methods used to reduce uncertainty and nervousness in MRP (Dolgui & Prodhon,2007). V. Sridharan et al. (1988) proposed a method for measuring instability by calcula ng the average of schedule changes in each period.
Fre-quent changes in plans are required to achieve high service level which contribute to planning instability (V. Sridharan & Berry,1990). The level of planning stability required, depends on the objec ves of the organisa on. Majority of research in rolling horizon planning has focused on demand uncertainty and these studies focus on one or two factors among the many factors that causes uncertainty (Dolgui & Prodhon,2007; Koh et al.,2002; Sahin et al.,2013). Simula-on and mathema cal modelling are the preferred experimental methods (Koh et al.,2002). There is lack of studies in the field of planning stability related to limited resources, mul -item mul ple planning layers as most studies focus on single-item and single planning layer with un-limited resources (Sahin et al.,2013). Fox et al. (2006) defines plan stability as measure of the difference between an original plan and the new plan, and thus a low difference gives a high plan stability. The effect of interdependence of inventories for components for assembly is a challenging area for research due to its complexity (Dolgui & Prodhon,2007). Since one policy may not work across different problem types or environments, a detailed study on problem type and opera ng environment is beneficial (Sahin et al.,2013). The exis ng researches are not industry specific which makes it difficult to apply them in real-life scenarios. In this project, the different factors that lead to re-planning in a pharmaceu cal company is studied in order to develop a solu on that minimises re-planning while a high service level is maintained.
1.2 Company Background
AstraZeneca is a Bri sh-Swedish global biopharmaceu cal company. It has the goal of being a global science led business which delivers life changing medicines to its pa ents. As of 2018 it was ac ve in over 100 countries and had 64,600 employees globally. In the same year it had a total revenue of 22.1 billion US dollars. AstraZeneca has research facili es in Sweden, USA and Great Britain and produc on in 17 countries with the largest produc on facility be-ing in Södertälje, Sweden. In Sweden there are 6900 employers divided between research in Gothenburg and produc on in Södertälje which in total employs 4500 with 3800 working directly within produc on and supply. (AstraZeneca,n.d.-a)
AstraZeneca’s strategy has three main pillars which are, first of achieve scien fic leader-ship. This pillar is meant to help them focus their innova ve science on their main therapy ar-eas which are: Oncology, Cardiovascular, Renal and Metabolism, and Respiratory. The second pillar is a return to growth, it will help AstraZeneca in focusing on growing sales and revenue, especially in key areas. The final pillar is to be a great place to work, to achieve this AstraZeneca focuses on their values of crea ng an inclusive and learning culture. (AstraZeneca,2018)
In Södertälje, 30 different pharmaceu cals are produced for over 100 different markets. The yearly amount produced are around 12 billion pills, which is cons tutes 40 percent of AstraZeneca’s total sales volume. Exports from the facili es equalled 42 billion Swedish kronor (4.7 billion USD) in 2018. In Södertälje, AstraZeneca has two factories- one in Gärtuna and the other in Snäckviken. Together these facili es connect the en re produc on process of many
of the pharmaceu cals that are shipped from Södertälje. The processes carried out in these facili es include: Produc on of ac ve pharmaceu cal ingredients, formula on of tablets, and packing of final products. In addi on, the produc on facili es in Södertälje are a launch site for many of the products from AstraZeneca’s pipeline, meaning that they are a launch site for AstraZeneca’s new products. (AstraZeneca,n.d.-b)
As the produc on site in Gärtuna supplies over 100 different markets and with 30 differ-ent pharmaceu cals it produces 1000s of differdiffer-ent varie es of product packs (AstraZeneca, n.d.-b). This makes the planning of the packing process very complex, which has resulted in AstraZeneca’s need to have a high flexibility in their planning process, in order to supply all markets in me.
1.3 Problem Descrip on
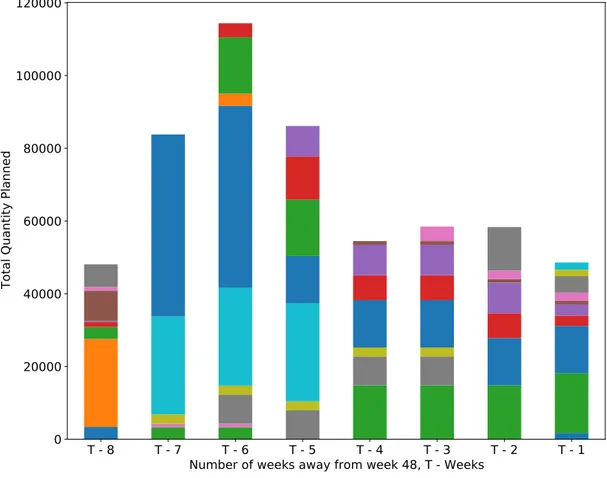
The scope of this thesis concerns the planning of the packing of tablets. When a plan is changed, it introduces nervousness in the system which decreases the planning stability. To illustrate how plans change throughout the planning horizon, the plans created for Week 48 in 2019, for blister packing line 19 is shown in Figure1. The quan ty and mix of products planned at Week 40, which is eight weeks prior (T-8) to Week 48 is different from the final approved plan created at one week prior (T-1) to Week 48. It can be observed in Figure1that every week different produc on plans are created for Week 48 where the products and quan es vary.
Digging deeper, the cause of the problem stems from AstraZeneca’s need for flexibility, as they require having a high service level, above 99%, due to the nature of their products and the customers which use them. As AstraZeneca’s packing process is a batch process, setups are required between batches which use up capacity. This in conjunc on with the need for flexibility makes it harder to have planning stability as this requires planners to change plans frequently to op mize the capacity u liza on. As AstraZeneca also has a high capacity u liza-on there is li le buffer capacity also making in harder to have flexibility in their produc liza-on, which further ins tute the need for planning stability.
The planners have to take into considera on a number of factors which influence the plan, and a change in any of these can require a change in the plans. Examples of factors the influ-ence plans are: availability of materials, changes in order quan es for VMIs, and changes in available capacity.
In the current planning system rough plans are created first, only taking into considera on capacity u liza on later in the planning process. This itself leads to low planning stability, as the plans by design of the planning process have to change to take full advantage of available capacity. Further, the only tool to stabilize the plan is the handshake, which takes place one week before produc on, leaving no tool prior to this point to keep plans stable.
T - 8
T - 7
T - 6
T - 5
T - 4
T - 3
T - 2
T - 1
Number of weeks away from week 48, T - Weeks
0
20000
40000
60000
80000
100000
120000
Total Quantity Planned
Figure 1: Illustra on of plans created for Week 48, 2019 from 8 weeks prior ll freezing.
Dif-ferent colours represent different SKUs
and leaflets, are some of the different incoming components. Among these, tablets are the most expensive. Tablets come from the formula on process which has a long lead me com-pared to the packing process. Other components are procured from outside suppliers. Unsta-ble plans lead to unstaUnsta-ble material requirements. It also leads to high inventory costs.
Some-mes, material must be expedited which results in addi onal costs.
1.4 Purpose and Research Ques ons
The purpose of this master thesis is to, at AstraZeneca’s packing department, study the plan-ning stability of the produc on plans within the planplan-ning me fence, by measuring the cur-rent status of the plans; analyse the factors such as informa on flow and decision principle which affect the planning stability with the support of relevant theory related to planning, re-planning and re-planning stability; and iden fy improvements, if any, that can be implemented at AstraZeneca to reach an ideal planning stability.
Research Ques ons
RQ 1: What is the informa on flow structure of the current planning system, what are the lead mes, decision points and according to what principles are the plans changed? What is the current planning stability and does AstraZeneca need to improve their planning stability?
RQ 2: What is the theory which can improve the planning stability and what are the important factors which influence planning stability?
RQ 3: What is an ideal planning stability at AstraZeneca? What improvements can be imple-mented which are suited for AstraZeneca’s environment?
RQ 4: How can the improvement in planning stability be achieved in other manufacturing en-vironments?
1.5 Delimita ons
As the case study takes place at Sweden Opera ons and all informa on and data collec on connected to planning are from this facility. Thereby only planning from Sweden Opera on is considered. At the planning department at Sweden Opera ons where the study takes place only produc on lines which pack products of oral solid dosage (OSD) are studied for stability and therefore the study includes only blister and bo le packing lines.
2 Method and Methodology
This chapter outlines the methodology that shall be used to conduct this project. First, an overview of the methodology is given. Then different data collec on methods that will be used are described. Then a sec on on how the data will be analysed and the results obtained is given. A sec on explaining how the project is validated is provided towards the end of this chapter.
2.1 Method Approach
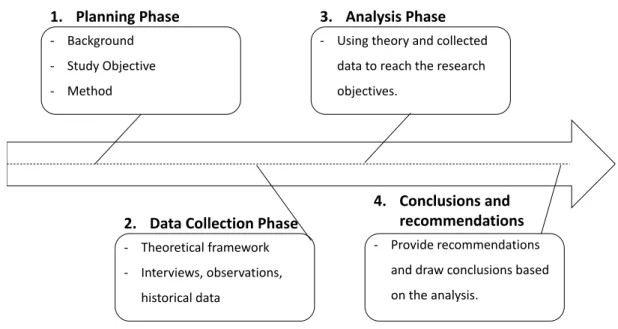
The method approach consists of four phases which are presented in Figure2. The phases are all divided into different ac vi es which are performed within the phase. These ac vi es are explained in further detail in the descrip on of each phase below.
1. Planning Phase
- Background - Study Objective - Method
2. Data Collection Phase
- Theoretical framework - Interviews, observations,
historical data
3. Analysis Phase
- Using theory and collected data to reach the research objectives.
4. Conclusions and recommendations
- Provide recommendations and draw conclusions based on the analysis.
Figure 2: The four phases of the study: Planning phase, Data collec on phase, Analysis phase,
Conclusions and recommenda ons.
2.1.1 Planning Phase
The ac vi es in the planning phase are background, study objec ve, and method. In back-ground, theore cal aspects of planning stability and its importance in planning was studied. Moreover, company background is also discussed, which gives an overview of AstraZeneca. More specifically, the planning department at the Gärtuna facility, which is the focus of the study. In study objec ve, the problem descrip on gives a detailed descrip on of the problem the study will focus on. This is used to define the study’s purpose and from it research objec-ves are derived. The research objec objec-ves are used to answer the purpose and giobjec-ves a clue of how the study will be realised, step by step. In the method, the research method used to answer the objec ves is described. This step is summarised in Figure3.
Planning Phase
Background - Theoretical - Company Study Objective - Problem - Purpose - Research Objective Method - Research methodFigure 3: The different ac vi es of the planning phase
2.1.2 Data Collec on Phase
In the second step, there are two different ac vi es that take place simultaneously as seen in Figure4. In theore cal framework, the theories which will be used in the study are described. These theories cover produc on planning and stability. The chapter also covers formulas which were used in stability calcula ons. The theories were collected from academic journals, books, and papers. In the other ac vity – empirical data, which was done simultaneously, interviews, internal documents, and historical data of plans, are collected in order to get a complete view of the planning process at AstraZeneca.
Data Collection Phase
Theoretical Framework - Theories and formulas. Empirical data - Historical plans, documents and interviews
Figure 4: The different ac vi es of the data collec on phase
2.1.3 Analysis Phase
In this phase, the analysis conducted in order to answer the research ques ons were carried out. To achieve this, the collected data from the interviews, documents, and historical data of the plans, are analysed with the help of the theories presented in the theore cal framework. This is summarised in Figure5.
RQ 1: What is the informa on flow structure of the current planning system, what are the lead mes, decision points and according to what principles are the plans changed? What is the current planning stability and does AstraZeneca need to improve their planning stability?
Analysis Phase
Research Objectives Empirical data Theoretical FrameworkFigure 5: Ac vi es in Analysis Phase
To answer the first part of this research ques on i.e. to study the informa on flow, data re-garding the planning environment and each specific planner were used. This data was col-lected from interviews with the different planners. The interviews feature: Supply-, Material-, Demand-, Asset-, and Formula on planners, along with line manager from Produc on. These interviews gave a picture of what informa on each planner and produc on are using in their work, as well as which informa on is sent between each actor. The theory used for analysis in this part is, theory regarding informa on flow, and flow theory. The analysis gave a picture regarding which informa on flow between each actor and when this informa on is updated. To find the lead mes and decision points, data from interviews with planners and documents were used in conjunc on with flow theory and theory about stability in planning. The analysis will map the lead mes in the flow as well as when decisions are made and what kind prin-ciple the decisions are based on. To answer what the current planning stability is, historical data about planned produc on for each line is analysed, with the help of formulas measuring different types of planning stability. Looking at measure of stability, it will be determined if planning stability needs improvement.
RQ 2: What is the theory which can improve the planning stability and what are the important factors which influence planning stability?
To be able to improve planning stability, the manufacturing system and planning system must be understood. Therefore, theory regarding S&OP, MPS and MRP are studied. It is also impor-tant to understand how to achieve planning stability. Therefore, theory regarding stability in planning, and coping with planning uncertainty is studied. When the theory regarding stabil-ity in planning and coping with planning stabilstabil-ity are implemented, along with the theory of the specific manufacturing and planning system, factors influencing planning stability and its degree of influence will be understood.
RQ 3: What is an ideal planning stability at AstraZeneca? What improvements can be imple-mented which are suited for AstraZeneca’s environment?
To create a list of improvements, the theory from the literature study was used in conjunc on with the empirical data which describe AstraZeneca’s current system regarding their planning. This will give informa on regarding when to change plans and when not to. The result is un-derstanding the planning stability level that would be ideal in AstraZeneca’s case considering exis ng KPIs such as: customer service level and total cost. The results in changes that can be made to decision making processes that will result in improving the planning stability.
RQ 4: How can the improvement in planning stability be achieved in other manufacturing en-vironments?
In this research ques on, improvements based on the results of research ques on 3 will be described. But instead the results are generalised so that other industries can also implement them in order to improve their planning stability.
2.1.4 Conclusions and Recommenda ons
In this phase, recommenda ons to improve planning stability are ranked based on their impact. This allows AstraZeneca to make decision regarding its implementa on. Improvements that can be implemented in other manufacturing environments are also discussed. The study is concluded by providing recommenda ons for future studies. The future studies shall fill the gaps in exis ng research.
2.2 Methodology
This sec on is divided into two parts – research approach and research strategy. The logical approach and research posi on are provided in research approach. In research strategy, the research method is described.
2.2.1 Research Approach
There are two main philosophical posi ons to research in opera ons management, posi vism and construc vism. Posi vism is the belief that world is external to the researcher. Facts are derived from reliable measurements which provide results that are replicable and can be generalized. In construc vism, observa ons and analysis is viewed as dependent of the re-searchers. Thereby results are dependent on the circumstances of the situa on (Croom,2009). As the study will be free from subjec ve conclusions and only based on theore cal facts, the philosophical posi on the researchers of the study have are posi vis c.
There are three approaches to logic in research: deduc on, induc on, and abduc on. De-duc on is when you start from a theory, then make observa ons and apply the theory to that data to reach a conclusion. Induc on starts with an empirical observa on, then tries to find conclusions that fit, in order to develop theory. Abduc on starts with incomplete obser-va ons, then tries to fit theory to explain the observed phenomenon, in order to see under which condi ons it stands. (Karlsson,2009)
The logic approach to research in this study is abduc on as the researchers will start with an ini al observa on of the case, theory will then be used in order to analyse the observed exis ng situa on at AstraZeneca. Conclusions from the analysis will then be drawn to construct an ideal system. From this, improvements will be suggested.
2.2.2 Research Strategy
This report cons tutes a single case study. A case study tries to explain a phenomenon with the help of mul ple sources of evidence (Leonard-Barton, 1990 as cited in Voss et al.,2002). The type of research that use case studies as basis is called case research. There are mul ple benefits to case research. The phenomenon can be studied in a real se ng and the theory generated are based on actual real prac ces. When studying the phenomenon, case research also allows for answers to ques ons of why, what, and how, which helps to understand the phenomenon. Case studies can also be conducted when not all variables are known and the phenomenon itself is not understood. (Meredith, 1998 as cited in Voss et al.,2002)
Some of the areas which case studies are strong is when building- and tes ng theory. It can also be useful to get more dept into a specific problem. A challenge of case research is that it is me consuming. Another challenge is, in order to get the right informa on to draw relevant conclusions the skill of the interviewers needs to be high. Also, great care has to be taken when drawing generalised conclusions about a phenomenon when having limited case studies to back it up (Voss et al.,2002). A single case study provides a greater depth of observa ons. But it limits the generalizability of the conclusions (Voss et al.,2002). Mul ple case studies can improve generalizability and can provide external validity (Voss et al.,2002). But it will reduce the depth of study if there are resource constraints. Since this project intends to study AstraZeneca planning system in depth and there is a me constraint, it will be a single case study. Therefore, the report is only meant to help in similar circumstances to which are seen in the case.
There are two methods used in research, qualita ve and quan ta ve. In the quan ta ve method mathema cal and sta s cal tools are used to analyse numerical data. Quan ta ve re-search is usually associated with a posi vis c approach, and can adopt a deduc ve approach where it focuses on tes ng exis ng theory (Croom,2009). Qualita ve research is about inter-preta on and percep on of data or informa on, it places emphasis on a socially constructed reality. The difference between qualita ve and quan ta ve here, are that qualita ve research
are not a set of principles that are used every me, but the research has somewhat of a mul -method approach (Croom, 2009). In this study, a mix between qualita ve and quan ta ve data will be used. The quan ta ve data analysed came from historical data collected about the produc on plans to calculate the current planning stability. The qualita ve data came from interviews with relevant par es. This will mainly be used to find out why plans are being changed and which factors influence the plans the most.
The study took on a descrip ve and norma ve approach. A descrip ve approach is where there is basic knowledge of the area and when the goal is to describe a system, and not inves-gate rela onships between parts of the system (Björklund & Paulsson,2012). The descrip-ve approach is useful for research ques on 1, when the informa on flow of the system is mapped. A norma ve approach is where there is knowledge and understanding of the stud-ied area, and the purpose is to find improvement areas and give recommenda ons (Björklund & Paulsson,2012). The norma ve approach is used later in the study when an ideal situa on is constructed, which will serve as a basis from where improvement areas are suggested
2.3 Literature Survey
This is an important step to iden fy the exis ng knowledge in this field. This will improve the legi macy of this research work and provide a solid founda on for this project (Croom, 2009). The literature review has its basis in theory regarding the planning environment at AstraZeneca. As AstraZeneca’s packing is a sort of batch produc on, a star ng point of the theory is therefore batch produc on. Lectures and notes from classroom complimented this. From there, various keywords like ‘Material Requirements Planning’, ‘planning stability’, ‘rolling horizon’, ‘uncertainty’, ‘nervousness’ were used to search for different literature in this area. Cita on searching was done using ‘Web of Science’ to iden fy recent papers on the subject. Ar cles were filtered based on their abstracts. Abstracts were reviewed to find out if the paper was related to improving planning stability. The journal ar cles and books related to this topic shall be thoroughly read through to understand the various viewpoints on this subject and the results obtained. The results from the literature survey are presented in this report.
2.4 Data Collec on Method
The type of data collected can be divided into primary data and secondary data. Primary data consists of interview while secondary data consists of data obtained from the ERP system. The collec on method of each type of data is men oned below.
2.4.1 Interviews
Interviews are one of the most common approaches used to collect data in studies. There are three types of interviews: Structured interviews, semi-structured interviews, and unstructured interviews. (Doody & Noonan,2017)
Structured interviews are used to collect quan ta ve data. In a structured interview the researcher asks the same ques ons in the same order to each interviewee. This is done via protocol of ques ons and follow up ques ons, which the researchers adhere to. The benefits of a structured interview is that it is objec ve, me efficient, easy to analyse the data, and that the format of the interview is controlled by the researcher. (Doody & Noonan,2017)
Semi-structured interviews are generally used to collect qualita ve data and is the most used interview type for this purpose. In a semi-structured interview, the researcher uses a set of predetermined ques ons and are free to seek clarifica on. An interview guide is generally used to create a sense of order in the interview and collect similar types of data from the interviewees. The ques ons in the interview can be flexible and open ended, where follow up ques ons arise spontaneously and can be used to explore topics deeper. (Doody & Noonan, 2017)
Unstructured interviews are used to collect qualita ve data. An unstructured interview o en starts with a broad open ques on, all ques ons therea er depend on the answers from the responses of the interviewee. Unstructured interviews generally follow themes instead of specific ques ons and is therefore very flexible, and without a clear direc ve. (Doody & Noonan,2017)
Interviews were held with employees working in different planning departments mainly the: supply-, material-, formula on-, demand-, and asset planner, as well as an employee in the produc on department. The ini al plan was to conduct interviews with minimum two employees from each department. But increased workload due to COVID-19 made it was dif-ficult to find two employees from Produc on and Formula on Planning department within the project me frame. As the data collected from the interviews are qualita ve, the inter-views were semi-structured. Some ques ons were prepared in advance. Depending on the answers given by the interviewee, more ques ons were asked to gather detailed informa on. The details of interviewee and list of ques ons are given in APPENDIXA. The interviews were conducted by both authors together with notes taken down by hand. If the interviewee allows, the interview shall also be recorded. A er the interview, both the authors discussed and wrote down notes about the important points gathered. This is done as soon as possible in order to not lose any important informa on. In case of clarifica ons, the recordings were reviewed.
2.4.2 Data from ERP System
Historical data from the period October 2019 to April 2020 was collected from the ERP system. The data collected contained produc on plans of the twelve packing lines related to Oral Solid Dosage (OSD). Forecast and demand informa on for the same period were also collected along with the produc on planning data.
pliment the data collected from the interviews. Data from internal documents could be com-pared with the data from interview to verify that the opera ng procedure matches with actual working procedure. This will improve the validity of the data collected from the interviews.
2.4.3 Data Anonymiza on
To protect sensi ve informa on, the collected quan ta ve data has been anonymised. The lead me of various ac vi es which were deemed sensi ve has been replaced with a random alphabet with a subscript ‘t’. For e.g. Ft. The unit of me used is also replaced with a
nonde-script unit called ‘Time Unit’ or ‘T.U.’ in short. The names of different manufacturing resources at AstraZeneca’s manufacturing plant are also replaced with different names. These replace-ments do not affect the outcome of the study.
2.5 Analysis Method
The analysis will use the theory in theore cal framework to analyse the empirical data in cur-rent state in order to find reasons for the problem described in problem descrip on. According to Saunders et al. (2009) the type of analysis depends on the type of data analysed, quan
ta-ve or qualita ta-ve.
Quan ta ve data in its ini al form is not understandable. To convey useful informa on the data must first be processed and analysed. The type of analysis technique depends on the data type. When the data is transformed to informa on, via analysis, the informa on must be presented in an understandable way. The most common type for ini al analysis and presenta on of quan ta ve data are tables and diagrams. Tables are useful for specific values, while the type of diagram used depend on the research objec ves, some are: line graphs, bar charts, histograms, pie charts, box plots, and sca er graphs. For deeper analysis, sta s cal techniques are useful for describing the data and showing rela onships in it. For showing central tendencies of the data, mean and median are o en used. Standard devia on is used to show the dispersion of the data. (Saunders et al.,2009)
Qualita ve data refers to all data that is not quan fied or non-numerical data. Qualita ve analysis usually involves the steps: Summarizing the data, categorising, and structuring the data, develop and test proposi ons to produce well-grounded conclusions. There are two types of approaches to qualita ve analysis, deduc ve or induc ve. The type of analysis used largely depend on the type of research approach. (Saunders et al.,2009)
Gap analysis is an analy cal tool designed to measure the difference between the current state of an organisa on and the ideal state in the future. The gap analysis framework is used to calculate what is needed to achieve the ideal state and devise ac ons or strategies to reach the objec ve. The three steps of gap analysis are therefore called: Actual state, Future state, and Needs/Solu ons. (Mercadal,2020)
During the actual state step, the researchers determines the current state of the organisa-on which includes the issue which is meant to be improved. During the future state step, the ideal state of the organisa on is described where a descrip on of how the issue would ideally be solved. During the needs/solu ons step, the gap between the current and ideal situa on is described. This is divided into factors which cause the gap and the ac ons meant to solve it. During this step it is useful to ask the ques on “How can we reach the desired objec ve?” and devise an ac on plan which bridge the gap. (Mercadal,2020)
2.6 Results and Discussion
A er the careful analysis of data, results are presented. Each research ques on presented in Sec on1.4are answered appropriately based on the analysis done. The authors discussed among themselves to arrive at the results. These results were then shared with the stakehold-ers and further discussion were carried out to verify that the findings are correct. The results are presented in an easy to understand format. The results are also generalised so that it will be applicable to different industries.
2.7 Validity
In case studies, there are several dimensions of reliability and validity. One, construct validity measures if correct opera onal measures for the concepts studied, if what is claimed to be measured is measured. It is tested by comparing if predic ons made about rela onships be-tween variables are confirmed, looking at results from mul ple sources, if the tested construct can be differen ated from others. To strengthen, triangula on can be used which is using mul-ple methods to collect data for the same topic (Voss et al.,2002). At least two employees in each role are interviewed. Thus, mul ple sources of data improve the validity of data collected. The interview notes are also sent to the interviewee through e-mail for authen ca on. This ensures the data is interpreted in the right way.
Another validity measure in case research is call internal validity, which is used to see if a causal rela onship can be established. This means that it checks if certain condi ons lead to other condi ons. The rela onship between different planners are constructed during analysis. In case there are any gaps during analysis, it is cleared with the interviewee. External validity is checking if the results of the case study can be applied generally (Voss et al.,2002). This is carried out by comparing the results with the exis ng literature to ensure results are consistent. Reliability is checking if case study can be repeated with the same results (Voss et al.,2002). This means that the data collec on techniques and analysis procedures performed in the study would give consistent results if they were performed by another researcher. One key aspect to achieve reliability in the study is to be fully transparent when repor ng each part of the work, and allow readers to make judgements themselves (Saunders et al.,2009). The complete
3 Frame of Reference
This chapter contains all the theories that are used in the analysis. It starts with a broad overview of supply chain management, then goes in to detail about MPS and MRP. Theories about inventory and safety stock are also provided. It ends with different theories on stability of MRP systems, ways to overcome it and methods to calculate stability.
3.1 External Planning Environment
Descrip on of some basic terms like supply chain management, facili es and forecas ng are given below.
3.1.1 Supply Chain Management
All actors who are involved directly or indirectly in fulfilling a customer order is part of a sup-ply chain (Chopra & Meindl,2007). It involves many roles like manufacturers, suppliers, dis-tribu on centres, transporta on, retailers, and most importantly the customer itself. It is not unidirec onal. Contrary to the name, it is not a chain, but a network. There is constant flow of products, funds and informa on throughout the supply chain in all direc ons (Chopra & Meindl,2007). Supply chain aims to maximise the overall value generated, its design depends on the customer’s needs, and the role of different actors.
Compe ve strategies set an organisa on apart from its compe tors. It defines the cus-tomer needs that the organisa on wants to fulfil. Compe ve strategy should align the supply chain strategy (Chopra & Meindl,2007). All func ons in a supply chain contribute to its success. For a func onal product with stable demand pa ern, a highly efficient supply chain is required whereas an innova ve product require a highly responsive supply chain (Fisher,1997). A highly responsive supply chain also incurs high cost. As per Chopra and Meindl (2007), a responsive supply chain can meet the following requirements.
• Respond to wide range of quan es demanded • Meet short lead mes
• Handle large variety of products • Build highly innova ve products • Meet a high service level
3.1.2 Facili es
One of the drivers of a supply chain is the facili es where the products are stored or fabri-cated. A facility can be used to transform raw materials into finished goods, or it could refer to a warehouse, or distribu on centre (DC), which shall distribute the products to customers. Having flexible capacity at the facili es can enable an organisa on to be responsive to mar-ket demands. But higher responsiveness will decrease efficiency and increase cost (Chopra & Meindl,2007). As per Chopra and Meindl (2007), following are some of the metrics that are measured at a facility.
• Capacity: Maximum amount that can be processed. • U liza on: Amount of capacity u lized.
• Theore cal flow/cycle me of produc on: Time required to process an item. • Average flow/cycle me: Average actual me taken to process an item.
• Flow me efficiency: Ra o of the above two metric, theore cal and average flow/cycle me.
• Product variety: Number of products that are produced.
• Volume contribu on of top 20% SKU and customers: To iden fy the source of majority of income.
• Processing / setup / down / idle me: The frac on of me that is spent on each ac vity. • Average produc on batch size: The size of an average batch.
• Produc on service level: Frac on of orders that are completed on me.
3.1.3 Forecas ng
Forecast is es ma ng the future trend. There are different types of forecast depending on its applica on. They can come from different sources and have different levels of aggrega on. For example, if a company is having a promo on, the demand forecast is updated based on promo on. This enables suppliers to ensure that supplies match the demand.
Forecas ng is not an easy task. Mature products like milk, with stable demand, are easier to forecast. Whereas products that have unpredictable supply of raw materials or demand, are difficult (Chopra & Meindl, 2007, p. 188). Forecasts contain an expected value and an error. Both parameters are important and influence supply chain management. Some other parameters of forecasts, are that long term forecasts are less accurate than short term forecast, and aggregated forecasts are more accurate than individual forecasts (Chopra & Meindl,2007, p. 188).
There are many methods of forecas ng. They range from simple methods like checking past demand, to complex methods where different sources of informa on are aggregated and analysed. Informa on like, state of economy (GDP, consump on), natural phenomena (rain-fall, temperature), is used in conjunc on with organiza onal sta s cs (price, sales, promo-ons, marke ng), to increase the accuracy of the forecast (Makridakis et al.,1998). When past informa on is available in the form of numerical data it is called quan ta ve forecas ng. An assump on in quan ta ve forecas ng is that past pa ern will con nue into the future (Makri-dakis et al.,1998). Quan ta ve can be further divided in to explanatory and me-series. In explanatory, the rela onship between different factors are considered, whereas in me series past variables and errors are used to make predic ons (Makridakis et al.,1998). Time series can predict what will happen but not why it happens. It is used when it is difficult to under-stand the system and the rela ons between the different factors. Explanatory can be used only when system is well understood, and rela ons are known. Qualita ve forecasts requires different inputs and are dependent on the specific method. They are seldom used to make forecasts on their own and are used as a supplement to quan ta ve methods (Makridakis et al.,1998).
Forecast can be divided in to three types – short, medium, and long term. Short term forecast is used to schedule resources, transporta on, and produc on, so that they are used efficiently. Medium term is used to acquire resources such as, raw materials and personnel. Long term forecasts are mainly used for determining resource requirements and making capital expenditure. (Makridakis et al.,1998)
The basic five steps in forecas ng, as per Makridakis et al. (1998) are
1. Problem Defini ons: This involves understanding how the forecast will be used, who will use it and how it aligns with the organiza on goals.
2. Gathering Informa on: Different quan ta ve and qualita ve informa on is collected to make the forecast.
3. Preliminary Analysis: Correla ons between data is studied to get a preliminary feel of data. This will help to iden fy which model to apply.
4. Choosing and Fi ng Model: Several models are fi ed to select the best model.
5. Using and Evalua ng a Forecas ng Model: Performance of a model is evaluated a er data for forecast period is obtained. This is used to con nuously update and fine tune the model.
As per Chopra and Meindl (2007, p. 57), some of the metrics related to forecast are • Forecast Horizon
• Frequency of update • Forecast Error • Seasonal factors • Variance of plan
• Ra o of demand variability to order variability
3.2 Informa on Flow
Informa on is the data that flows between different actors in a supply chain. Informa on can be about prices, inventories, transporta on, customers, facili es etc. Informa on can make a supply chain more responsive and efficient, and is the biggest driver of performance (Chopra & Meindl,2007, p. 45). It connects different opera ons. For example, with the availability of forecast informa on, an organiza on can decide how much to produce to meet customer de-mand. The internet has allowed organiza ons to share informa on instantly across the world. Enterprise Resource Planning (ERP) allows the informa on to about the supply chain to be shared across the organiza on. Radio Frequency Iden fica on (RFID) tag allows automa c tracking of products.
3.2.1 Flow Theory and System Thinking
The four cornerstones of flow theory are: me, conversion, system, and structure. A sys-tem approach is helpful when analysing flows. A syssys-tem has clearly defined boundaries and is considered to be dynamic, changing over me. For something to change state in a system there has to be ac on triggers. These can be exogenous which is caused by something outside the system, like a customer requirement or endogenous which is caused by something inside the system, like plan ini a on. In flow analysis there are three different system perspec ves that are important which are, the legal-, physical-, and logical perspec ves. The legal perspec-ve has informa on regarding financial performance of the system, which is deriperspec-ved from all the physical transac ons taking place in the system. The physical perspec ve deals with all the physical transforma ons in the system such as, transforma on of-, form (manufacturing), transporta on (moving) and me (storing). The logical perspec ve focuses on the general as-pects of flow such as: the driver-, who controls- and differen a on of the flow. As can be seen in Figure6, three triads are iden fied based on the perspec ves. Each represent the sys-tem from each perspec ve which for legal is company based, for physical – Supply Chain and Opera ons (SCO) based and logical - process based. (Wikner,2018)
Looking into the logical system it is based on Logical en es (LoEs) put together in a net-work. The LoEs represent where control can be applied. A LoE can be described as a flow
Supplier actor
Reciever value-add Focal
value-add
Focal actor Customer actor
Provider value-add
Pre contol Focal control Post control
Legal triad Physical triad Logical triad Handover of ownership Value-add handover Handovers of control
Figure 6: The three triads with handovers. Adapted from Wikner (2018)
structure consis ng of a network of segments. Were a line segment being the core compo-nent of the flow structure and is represented as a line with a dot at each side, see Figure7. The dots represent the star ng and end point of the segment and the line represent some sort of transforma on being performed. There are four ways of connec ng line segments which are seen and described in Figure7. (Wikner,2018)
One flow segment ending Two flow segment ending
One flow segment start
Sequential flow Diverging flow
Two flow segment start
Converging flow Combining flow
Flow segment
Figure 7: Different flow structures. Adapted from Wikner (2018)
When combining mul ple segments into complex figures and adding the LoEs for Pre-Control, Focal Pre-Control, and Post-control, we get a flow structure from a logical perspec ve, see example in the Figure8. In Figure8, there are two pre-control LoEs, one for each of segment
V and Q, it could be because of two different suppliers for example. In Figure8, sequen ally placed segments could be both dependent i.e. coupled and independent to varying degrees, this is known as decoupling. Decoupling is when independence between demand and supply is introduced, for example via inventory. Decoupling is represented by a decoupling point (DP). There are three different types of decoupling points: Interopera on DPs, item DPs, and strate-gic DPs. An interopera on DP separate different ac vi es from being performed. An Item DP iden fies the results of sub-processes (different groups of ac vi es) that are performed together when ini ated. A strategic DP are related to iden fica on of processes that are of a strategic significance, o en connected to customers or suppliers. Some mes when dis nc-ons between upstream and downstream proper es of the flow from the DP is not clear a hybrid called a Decoupling Zone (DZ), is used. (Wikner,2018)
Pre-Control 1 Pre-Control 2 Focal Control Post-Control V Q W X U Y Z
Figure 8: Flow structure from a logical perspec ve. Adapted from Wikner (2018)
Flow thinking is mostly concerned with strategic decoupling points, and they are o en po-si oned based on strategic lead mes (SLT). Time is a fundamental aspect of flow management and a has to be at the core of flow thinking, therefore a me perspec ve is added to the flow structure. We then get a me-phased flow structure where the length of each segment is the amount of me it takes to perform that segment. (Wikner,2018)
There are three different types of strategic lead mes, these are: Risk-based-, control based-, and variant-based strategic lead mes. Risk is related to the amount of specula on re-quired. If concentrated on demand based specula on, it can be reduced if informa on about customer requirements are available. The SLT delivery lead me,D, is based on the customers requested delivery lead me. Downstream of D, ac vi es are performed based on commit-ment to customer orders, and upstream they are based on specula on of future customer or-ders. There is another risk-based SLT, that is system lead me S, which is the total cumula ve lead me of the me-phased supply structure. If looking at a risk perspec ve again, upstream of D the LoEs own the risk, and downstream of D the customer own the risk. Control-based SLT are based on which parts of the flow structure which is under the organisa ons control. The only part of the flow structure under control is the Focal Control part of the flow, these lead mes are the referred to as internal SLT – I. Those outside of the Focal Control are external SLT – E. these are divided further into upstream and downstream external lead mes, based on if they are before or a er the focal control. The variant-based lead mes comes from variants
based on a specific customer order. The variant lead me is expressed by the adapt SLT A, which is the me to create variants. (Wikner,2018)
Pre-Control 1 Pre-Control 2 Focal Control Post-Control V Q W X U Y Z SVZ EUS IVZ EDS A LV LW SQZ D IQZ EUS
Figure 9: Flow structure with External/internal SLTs (green), system SLTs (black) and
deliv-ery/adapt SLTs (yellow). Adapted from Wikner (2018)
There are two groups of decisions categories (DCs) which is based on whether they are based on the boundary and SLTs of the system, these are called Exogenous decision categories (ExDCs). The other is based on the conversion perspec ves and are called Endogenous decision categories (EnDCs). (Wikner,2018)
3.2.2 Endogenous Decision Categories
Endogenous perspec ve of the system gives characteris cs such as conversion perspec ves. The first of these is related to boundaries and its impact on resources. This refers the LoE customers and the services they require, the conversion perspec ve (CP) is therefore called customers and services. The focus is to understand customers and their requirements, as well as in coopera on with customers services can be produced. The second CP concerns products that are transformed and is called products and processes. Important is that product catego-riza on and the impact of these on processes needs to be inves gated to make the approach industry generic. The third CP is labelled resources and capacity and is based on execu on of transforma on processes. Interes ng is how depending on transformed object or service the available capacity resources used in transforma on processes impact the con nuity of the flow. The last CP is called planning and control which concerns the control of transforma ons related to all aspects of flow management of the LoE. (Wikner,2018)
3.2.3 Exogenous Decision Categories
Exogenous-based decoupling can be categorized based on ques ons represen ng logical rea-soning to the ExDCs into five different types.
The first ques on is: What are the external boundaries of the flow system? This is used to iden fy what it included in the analysis. The boundary of the system is labelled B1 and has two variants, B1a which iden fies the end point of the flow and is called the Flow boundary sink. The other B1b, iden fies the start of the flow and is called the Flow boundary source. These are represented in the picture as SourceDP and SinkDP in Figure10.
The second ques on is: What is the extension of the controllable part of the flow system? As the boundaries of the system might include parts beyond the LoEs control. As explained earlier, the part of the system that is under control is called Focal Control LoE, as it is possible to apply control in all parts of the flow within the Focal Control LoEs. The control boundary is labelled as B2, and is divided into, B2a which is the Flow controllability sink, and B2b which is the Flow controllability source. Downstream of B2b and upstream of B2a, the flow is under the Focal Control. There are two DPs that are linked to these. The Downstream controllability DP (DCDP) linked to B2a, and the Upstream controllability DP (UCDP) linked to B2b. There are three STL lead mes connected to the controllability of the flow, which is the Internal lead me
I, and the external lead mes EUS(external upstream lead me) and EDS(external downstream
lead me).
The third ques on is: What is the driver of the flow? Focuses on what ini ates the flow, it is iden fied by B3 and is called a Flow driver. The Flow driver represent why the flow is happening this can be drivers such as, forecast and customer orders. The Flow driver is represented by the Costumer Order DP (CODP), upstream of this point the flow has to be ini ated based on specula on, and downstream based on actual known demand.
The fourth ques on deals with the level of uniqueness of the flow and is: How can a flow be differen ated for different flow sinks? As B3 only deals with a request for something and has no informa on regarding if it is standardized or individualized, there is a need for a deci-sion category that deals with this, B4 Flow differen a on. This can be divided into, B4a Flow differen a on supply, which represent that individual variants can be created from the supply side, which of need specific lead mes AS. The other variant of this decision category B4b Flow differen a on demand which is related to the Customer adap on DP (CADP), where the flow changes from standardiza on to individualiza on.
The fi h ques on deals with how informa on outside the system is shared and is: To what extent is exogenous informa on shared in the flow? This decision category deals with observ-ability of informa on for decision making. The first variant of this is B5a Flow observobserv-ability demand, it is based on the availability to observe upstream informa on of external demand at B1a. This is labelled the Demand Informa on DP (DIDP). Informa on about real demand must be available downstream of CODP (to be able to act on customer orders) and therefore the DIDP must be posi oned between B1b (SourceDP) and B3 (CODP). The other variants of this decision category is related to the observability of capacity these are, B5b Flow