I
N T E R N A T I O N E L L AH
A N D E L S H Ö G S K O L A NHÖGSKOLAN I JÖNKÖPING
C h a n g i n g I m p o r t P a t t e r n s
o f Ta i w a n
Bachelor’s thesis within Economics Authors: Lars Lundqvist
Karin Löwbeer
Tutors: Scott Hacker, Professor James Dzansi, Ph.D Candidate
J
Ö N K Ö P I N GI
N T E R N A T I O N A LB
U S I N E S SS
C H O O LJönköping University
Ta i w a n s F ö r ä n d r a d e I m
-p o r t m ö n s t e r
Kandidatuppsats inom Nationalekonomi Författare: Lars Lundqvist
Karin Löwbeer
Handledare: Scott Hacker, Professor James Dzansi, Ph.D Candidate Jönköping Juni, 2007
Acknowledgement
Acknowledgement
Acknowledgement
Acknowledgement
We wish to thank Henrik Byström at the Swedish Trade Council in Taipei for inspiration to an interesting topic. A special thanks to Professor Scott Hacker and Ph.D James Dzansi at Jönköping International Business School for good supervision.
Jönköping, June 2007
Bachelor’s Thesis in Economics
Bachelor’s Thesis in Economics
Bachelor’s Thesis in Economics
Bachelor’s Thesis in Economics
Title:Title: Title:
Title: Changing ImpChanging ImpChanging ImpChanging Import Patterns of Taiwanort Patterns of Taiwanort Patterns of Taiwan ort Patterns of Taiwan Author
Author Author
Authorssss:::: Lars LundqvistLars LundqvistLars LundqvistLars Lundqvist Karin LöwbeerKarin LöwbeerKarin LöwbeerKarin Löwbeer Tutors:
Tutors: Tutors:
Tutors: Scott Hacker, ProfessorScott Hacker, ProfessorScott Hacker, ProfessorScott Hacker, Professor
James Dzansi, Ph.D CandidateJames Dzansi, Ph.D CandidateJames Dzansi, Ph.D CandidateJames Dzansi, Ph.D Candidate Date Date Date Date: 2007200720072007----060606----0706 070707 Subject terms: Subject terms: Subject terms:
Subject terms: Taiwan, Sweden, Import, Gravity model of trade, Language, Exchange rate, GDP, Regional trade
Abstract
This thesis investigates the determinants of Taiwan’s import changes and the underlying factors of the decreasing Swedish export to Taiwan between 1994 and 2005.
The empirical study includes 36 countries from both the Pacific Rim and OECD. Based on a modified gravity model of trade, the regression model aims to examine how GDP growth in the exporting country, exchange rate changes, common language, and membership in APEC affect Taiwan’s import volume. The result shows estimates with expected signs, with 49.8 percent of the vari-ance in Taiwan’s changed import volume explained by the exogenous variables. Exchange rate change and language are statistically significant.
Data on commodity groups of importance for Sweden and Taiwan are also ex-amined, and they show that Taiwan has changed its import demand and has started to import goods other than those Sweden in previous years strongly exported to Taiwan. Taiwan’s regional trading partners have also gained export shares at the expense of Swedish exports.
The results are in line with theory and it will be hard for Sweden in the future to compete with the increasing regional trade of East Asia where common lan-guage and culture are of big importance.
Kandidatuppsats inom Nationalekonomi
Kandidatuppsats inom Nationalekonomi
Kandidatuppsats inom Nationalekonomi
Kandidatuppsats inom Nationalekonomi
Titel:Titel: Titel:
Titel: Taiwans FörändrTaiwans FörändrTaiwans FörändrTaiwans Förändrade Importmönsterade Importmönsterade Importmönsterade Importmönster Författare:
Författare: Författare:
Författare: Lars LundqvistLars LundqvistLars LundqvistLars Lundqvist Karin LöwbeerKarin LöwbeerKarin LöwbeerKarin Löwbeer Handledare:
Handledare: Handledare:
Handledare: Scott Hacker, ProfessorScott Hacker, ProfessorScott Hacker, ProfessorScott Hacker, Professor
James Dzansi, Ph.D CandidateJames Dzansi, Ph.D CandidateJames Dzansi, Ph.D CandidateJames Dzansi, Ph.D Candidate Datum Datum Datum Datum: 2007200720072007----060606----0706 070707 Ämnesord Ämnesord Ämnesord
Ämnesord Taiwan, Sverige, Import, Gravitations modell av handel, Språk, Växelkurs, BNP, Regi-onal handel
Sammanfattning
Denna kandidatuppsats undersöker bestämmande faktorer till Taiwans föränd-rade importmönster samt underliggande faktorer till Sveriges sjunkande export till Taiwan under åren 1994 och 2005.
Den empiriska studien inkluderar 36 länder från både Pacific Rim och OECD. Baserad på en modifierad gravitationsmodell av handel, syftar regressionsmo-dellen till att undersöka hur BNP-tillväxt i det exporterande landet, växelkurs förändringar, språk, samt ett medlemskap i APEC ändrar Taiwans importvo-lym. Resultatet visar signifikanta bedömningar med förväntade tecken. 49.8 procent av Taiwans förändrade importvolym förklaras av de oberoende vari-ablerna. Växelkursförändringar och språk är de mest bestämmand faktorerna. Vidare är statistik över varugrupper av betydelse för Sverige och Taiwan un-dersökta. Taiwan ändrar sin importefterfrågan och börjar importera andra va-ror än vad Sverige tidigare har exporterat till Taiwan. Taiwans regionala han-delspartners har vunnit exportandelar på bekostnad av svensk export.
Resultaten stämmer överens med teorin. Det kommer att bli svårt för Sverige att konkurrera med den ökande regionala handeln i Ost-Asien där språk och kultur spelar en stor roll.
Table of Contents
1
Introduction... 2
1.1 Problem Discussion... 2 1.2 Purpose... 4 1.3 Literature Review ... 4 1.4 Outline... 52
Theoretical Framework ... 6
2.1 Trade Theories ... 62.2 Imports, Exports and GDP ... 6
2.3 Gravity Model of Trade... 7
2.4 Exchange Rate Impact on Imports ... 7
2.5 Distance and Geographic Transaction Costs ... 8
3
Empirical Framework ... 10
3.1 Data Selection and Time Period... 10
3.2 Regression Model ... 11
3.3 Econometric Challenges ... 12
3.4 Empirical Results... 12
3.5 Commodity Data... 15
4
Analysis ... 19
5
Conclusion and Further Research ... 23
Figures
Figure 1.1 Sweden's export to Taiwan ... 3
Figure 1.2 Taiwan's total import ... 3
Figure 3.1 Partial plot of changes in exchange rate and imports... 14
Figure 3.2 Sweden's exported commodities to Taiwan 1994-2004 ... 15
Figure 3.3 Taiwan's total imported commodities from the world 1994-2004. 15 Figure 3.4 Taiwan's sub-commodities of Machinery and Transport equipment from the world 1994-2004... 16
Figure 3.5 Sweden's import value of sub-commodities of machinery and transport equipment 1994-2004 ... 16
Figure 3.6 Share of imports in Telecommunication 1994-2004 ... 17
Figure 3.7 Share of imports in Road Vehicles 1994-2004... 17
Tables
Tabel 3.1 Variables percentage change for various countries. ... 12Table 3.2 The impact of GDP growth, exchange rate changes, D1 and D2 on % change in Taiwanese imports... 13
Equations
Equation 2.1. ... 7 Equation 2.2 ... 7 Equation 2.3 ... 8 Equation 2.4 ... 8 Equation 3.1 ... 11 Equation 3.2 ... 11 Equation 3.3 ... 11Appendix
Appendix 1 ... 271
Introduction
The reasons for the existence of trade, and how countries choose their trading partners are many. Not only natural production possibilities but also economic, historical, geographical, political, sociological and cultural factors decide the extent and composition of trade be-tween countries. In addition to these factors, the rules and regulations implemented by countries for the economic actors are of big importance (Kleen, Moberg & Palm, 2003). One of the most important single insights of international economics is that there are gains from trade (Krugman & Obstfeldt, 2003). The “East Asian miracle” is a spectacular exam-ple of this fact. In the 1960s, Singapore, Hong Kong, South Korea and Taiwan, which in that time were seen as poor developing countries, began a high and persistent GDP growth. With trade as a significant stimulator, the “Tiger Economies” started an impressive economic development that hardly any developing country had experienced before (Wick-man, 2005).
In the field of international trade, Taiwan’s achievement is astounding. The Taiwanese economy has since the 1960s advanced steadily from exporting agricultural goods to low technology manufactured goods, followed by high technology manufactured goods through the phases of import substitution, export promotion, and high-tech industrializa-tion (Hsiao & Hsiao, 2001). The Taiwanese economic success can also be explained as be-ing due to a pragmatic mixture of a real liberal economy and a planned economy. Given conditions such as free access to the world’s developed markets, successful agricultural re-forms, specialization in labor-intensive industries, and education and training facilities that promote technology improvements, Taiwan has shown that development is compatible with high sustained rates of economic growth (Aspalter, 2001).
Taiwan is a dynamic market that has developed rapidly and today Taiwan is a world leader within several areas (Swedish Trade, 2007). The island runs a trade surplus, and foreign re-serves are the third largest in the world. Taiwan’s biggest industries include electronics, pe-troleum refining, armaments, chemicals, textiles, iron and steel, machinery, cement, food processing, vehicles, consumer products, and pharmaceuticals (CIA, 2007). Taiwan’s largest shares of import products in 2006 were agriculture and industrial raw materials, machiner-ies and electrical equipment, minerals, electronic products, capital goods, crude petroleum, chemicals, machineries and consumer goods (Econwin, 2007). Japan is Taiwan’s largest source of imports followed by China, United States, South Korea and Saudi Arabia (CIA, 2007).
Sweden, for a long time an important trading partner to Taiwan, is heavily oriented toward foreign trade. Since the middle of the 1990s, the Swedish export sector has expanded sub-stantially. Sweden runs a trade surplus and its export is of high importance for economic growth. The structure of Swedish export has changed prominently from traditional indus-try as steel, paper and pulp to IT indusindus-try and telecommunication. Sweden’s biggest export partners are the US, Germany, Norway, United Kingdom, Denmark, Finland, France, Netherlands, and Belgium (CIA, 2007).
1.1
Problem Discussion
Taiwan has for a long time been an important trading partner for Sweden and for several years, Taiwan was among Sweden’s 30 largest export markets in the world. During the ten
last years, however, Swedish exports to Taiwan have declined even though Taiwan’s overall imports have risen (Swedish Trade, 2007).
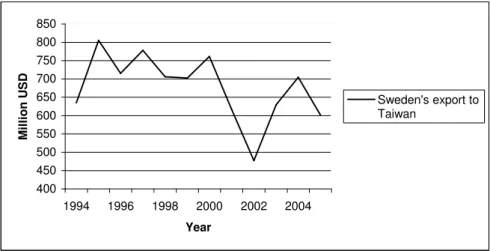
Figure 1.1 and figure 1.2 show that Sweden’s exports to Taiwan have declined and Tai-wan’s total imports have grown during 1994 to 2005.
400 450 500 550 600 650 700 750 800 850 1994 1996 1998 2000 2002 2004 Year M il li o n U S D Sweden's export to Taiwan
Figure 1.1 Sweden's export to Taiwan (Econwin, 2007) 0 20 40 60 80 100 120 140 160 180 1994 1996 1998 2000 2002 2004 Year B il li o n U S D
Taiwan's total import
Figure 1.2 Taiwan's total import (Econwin, 2007)
Swedish exports to Taiwan reached their peak in 1995 and amounted to 805 millions of USD. In 1995, the total Taiwanese imports amounted to 75.78 billions of USD. After 2000, Swedish exports to Taiwan decreased severely until 2002, where it gained some momen-tum. In the period 2000–2005, Swedish exports to Taiwan decreased on average by more than 150 million USD and in 2005, Swedish exports to Taiwan amounted to 602 million USD. In 2005, total Taiwanese imports reached 161.48 billion USD (Econwin, 2007). The numbers above indicate that Sweden’s share of Taiwan’s total import is decreasing, and in relation to the total, it is negligibly small. The factors influencing how countries choose their trading partners are, as already described, many. Why Sweden’s share of
ports to Taiwan has decreased the latest years is presumably a situation that may not be ex-plained only by structural or geographical factors in Taiwan or its trading partners. Ex-change rate Ex-changes, transportation costs or other barriers to trade, natural or political, may have major effects on changes in Taiwanese trade.
This thesis will analyze the changed import pattern for Taiwan from 1994 to 2005. Taking Taiwan’s total increase in import along with the decrease in import from Sweden as a start-ing point raises the followstart-ing questions. First, which factors durstart-ing the studied period could have affected Taiwan’s import decisions? Second, has Taiwan changed its import demand and started to import other goods than those Sweden in previous years exported to Taiwan or has Taiwan changed trading partners? These research questions lead to the purpose of this thesis.
1.2
Purpose
The purpose of this thesis is to investigate the determinants of Taiwan’s import changes and to analyze underlying factors of Taiwan’s declining import from Sweden over the latest years.
1.3
Literature Review
There have not been any major studies on Sweden’s exports to Taiwan before, nor any studies on Taiwan’s imports. However, several studies have been made in the subject of the transforming economic landscape of East and South East Asia.
Previous studies of trade and what affects trade are many. Earlier studies of trade deal with the more direct question of trade creation, and why countries start trading with each other in the first place, but these models are very basic since they often only consider two coun-tries. The more recent studies of trade take more specific aspects of what affect trade into consideration, such as exchange rates, transportation costs and regional trade agreements. The notion of intensity of interdependence is the idea of an uneven playing field, where some countries have different barriers to trade, natural or political, than others. One exam-ple of such a differential barrier is distance, where transport costs lead to differences in the intensity of commercial relationships. Beyond distance, there are many different factors that can make the economic playing field uneven, such as language, culture, past relation-ship, and migration (Petri, 2006).
Asia has a strong tradition of trade with Organisation for Economic Co-operation and De-velopment countries (OECD) and this trade is expanding, but intra-Asia trade is also accel-erating rapidly, which is efforts facilitated to liberalize trade and propagate growth linkages over regional supply networks (Roland-Holst, Verbeist & Zhai, 2005).
Not all studies argue that Taiwan has benefited fully from Preferential Trade Agreements (PTA) in East Asia. China’s unwillingness to recognize Taiwan’s political diplomatic legiti-macy has significantly narrowed Taiwan’s options of free trade agreements and its chances of becoming an Association of Southeast Asian Nations (ASEAN) plus three (APT) mem-ber (Dent, 2005).
Regional integration is the way forward for rapid and sustainable growth in Asia. By diver-sifying its established trade patterns toward emergent demand within the region, the Asian economies can reach higher domestic growth rates, accelerate economic diversification, and
broaden the foundation for regional development. Greater convergence can in this way be achieved in the region (Roland-Holst et al 2005).
1.4
Outline
The rest of this thesis is organized as discussed below.
In section two, the theoretical framework is presented which includes theories of trade, marginal propensity to import, gravity model of trade, exchange rate impact on imports, and general theories discussing distance and geographic transaction costs.
Section three presents the empirical framework where a motivation for the data selection is given and a discussion of the gravity model is described and further modified in order to fit the purpose of this thesis. The variables of the econometric model are explained and the empirical results are presented and discussed. Furthermore, descriptive data of Taiwan and Sweden’s most important traded goods are presented.
The results are analysed in section four and in section five, the final conclusions are pre-sented and suggestions for further researches are given.
2
Theoretical Framework
This section discusses theories of trade, the relation between GDP and trade, the exchange rate impact on imports, and the effects of distance and geographic transaction costs on trade. Furthermore, the gravity model of trade, which will be examined further in the em-pirical framework is presented.
2.1
Trade Theories
Many theories in the field of international trade have been developed, explaining why economies trade and how they choose their trading partners. Among the most famous clas-sical trade theories are The Ricardian Model, The Specific Factor Model and the Hecksher-Ohlin Model. Each model makes different assumptions about the determinants of produc-tion possibilities. Each of the three models simplifies reality and leaves out aspects that the others stress. When analyzing real problems, insights are based on a mixture of the models (Krugman & Obstfeld, 2003).
In the Ricardian Model, developed by David Ricardo, production possibilities are deter-mined by the allocation of labour. This model conveys the fundamental idea of compara-tive advantage based on differences in labour productivity, but does not consider income distribution (Krugman & Obstfeld, 2003).
The Specific Factor Model, developed by Paul Samuelson and Ronald Jones, also assumes an economy that produces two goods but can allocate its labour supply without restraints between the two sectors. In the specific factor model, there are other factors of production besides labour, which are specific, i.e. they can be used only in the production of particular goods. This model explains the effect of trade on income distribution (Krugman & Obstfeld, 2003).
The Heckscher-Ohlin theory or the Factor Endowment Trade Theory, developed by Eli Heckscher and Bertil Ohlin, shows how multiple factors of production can move between sectors and how resources control trade patterns. This theory assumes that countries have access to the same technological possibilities for all goods and trade arises because coun-tries are endowed with different relative factor supplies. A country will export that product which more intensively uses its relatively abundant factor. An economy that is relatively abundant in labour has a comparative advantage in producing commodities that intensively use labour in production. Such an economy will focus on production of labour intensive goods and export the surplus. An economy that is relatively abundant in capital will pro-duce capital intensive goods and export the surplus. When economies engage in trade with each other, they can move consumption outside the confines of their production frontiers and end up in a situation where both countries can consume more than without trade (Krugman & Obstfeld, 2003).
2.2
Imports, Exports and GDP
GDP represents the output of a country and also its income. Other things remaining the same, an increase in real GDP implies larger production and thus a larger export (Dorn-busch, Fischer & Startz, 2004). Further, as income raises, people increase their expenditures on most goods and services and since many goods and services are imported, an increased income brings an increase in imports. This relationship is described by the marginal
pro-pensity to import (MPI), which is the fraction of an increase in real GDP that is spent on imports: GDP IM MPI ∆ ∆ = (2.1)
This is assumed to be positive given the reasoning noted above (Bade & Parkin, 2004).
2.3
Gravity Model of Trade
The gravity model of trade is a successful effort to show that location matters in interna-tional trade. The model predicts bilateral trade flows based on the economic sizes (GDP measurements) and distance between two countries (Brakman, Garretsen & Marrewijk van, 2005). The gravity model of trade has been used to analyze the patterns of trade. Conse-quently, the gravity models in their most general form are consistent with standard models of international trade since they suggest that the magnitude of trade between two countries depends on the supply circumstances in the home country and the demand circumstances in the foreign country (Krugman & Obstfeld, 2006).
The following equation shows the theoretical relationship between the size of a country’s economy and the volume of its import and export. The equation predicts the volume of trade between any two countries (i and j):
3 2 1 β β β ij j i ij D Y Y A T = (2.2)
Where Tij is the value of trade flows between country i and j, A is a constant term, Yi is equal to country i’s GDP, Yj represents country j’s GDP, and Dij is the distance between the two countries. The equation indicates that when GDP for country i or j increase, the trade flow between i and j will increase. Furthermore, when distance between i and j in-crease, the trade flow between i and j will decrease (Krugman & Obstfeld, 2006).
2.4
Exchange Rate Impact on Imports
There has been an extensive debate about the impact of exchange rate volatility on interna-tional trade ever since the adoption of floating exchange rates (Cheong, 2004). Given do-mestic and foreign prices are held constant, when a currency appreciates, foreign goods in that country become cheaper and its domestic goods become more expensive for foreign-ers. Under the same circumstances, when a country’s currency depreciates, its goods abroad become cheaper and foreign goods in that country become more expensive (Mishkin, 2006). A real depreciation by the home country shifts the demand from goods produced abroad to goods produced at home, thus improving the trade balance (Dornbusch et al, 2004). Hence, there should tend to be a positive relationship between the foreign currency value of the Taiwanese Dollar, TWD, and import from other countries, all else equal. Below a conventional demand function is provided for imports to investigate the impact on trade of exchange rate changes.
) , , (RPt Yt Ht f IM = (2.3)
where IM is equal to real import volume, RP represents relative prices1, Y is the income level, and H represents the exchange rate volatility (Cheong, 2004).
Ceteris paribus, an increase in the relative price should have a negative effect on imports as they become more expensive. A depreciation of the domestic currency will lead to an in-crease in relative prices. An inin-crease in the income level should have a positive effect on imports as purchasing power increases. The exchange rates volatility effect on imports is, however, not given since it depends on traders’ attitudes to risk in exchange rate. If the traders are risk-neutral and the exchange rate is uncertain, it could lead to additional oppor-tunities to increase profit and boost trade flows. However, the risk due to exchange rate uncertainty is an additional cost if the traders are risk-averse, and hence decrease the trade volumes (Cheong, 2004). In this thesis, the issue of exchange rate volatility is not investi-gated and will not be taken into consideration.
2.5
Distance and Geographic Transaction Costs
All transport and transaction costs that vary with distance in geographical networks are called geographic transaction costs. These geographic transaction costs can be related to distance, differences in language and culture, social and political differences, and political strategies leading to barriers between states (Hacker & Johansson, 2001).
Transportation costs play an important role when it comes to trade and have been meas-ured in many different ways, from travel time to direct cost. The difference between the so-called cif (cost, insurance, freight) and fob (free on board) is a straightforward measure of cost in international trade. Cif is a measurement of the value of the imports from the point of entry, cost insurance and freight inclusive. Fob is a measurement of the cost of the im-ports inclusive of all charges involved in placing the goods on the carrier in the exporting port. The differences between these two values measure the cost of getting an item from the exporting country to the importing country. The formula for this trade cost as a per-centage of value at the exporting port is
(
)
[
cif / fob −1]
100% (2.4)which gives a measure of the transport cost rate on imports (Brakman et al, 2005).
In 1952, Paul Samuelson introduced the concept of iceberg cost of transportation. This concept implies that a fraction of the manufactured goods will not arrive at the destination when goods are shipped between regions. The fraction of the goods that does not arrive at the destinations, T, represents the transport cost rate. For example, if it takes 107 units of a good to be sent in order for 100 units to arrive safely at the destination, then T equals seven percent (Brakman et al, 2005).
In general, lower transportation costs and a greater likelihood of common characteristics of the traders such as language, culture, taxes, laws etc. bring low geographic transaction costs in comparison to transactions over longer distance. The greater the differences between the traders, the greater the rise in cost (Hacker & Johansson, 2001).
Differences in language are considered a barrier to communication. Countries that share the same language are believed to have lower barriers of communication and will hence trade more with each other than otherwise (Hacker & Johansson, 2001). Thus, having the same language as a trading partner has a positive relationship with import.
Culture differences should be considered as providing additional cost to trade. How people interact with companies, institutions and other people is determined by cultural attributes. Religious beliefs, race, social norms and language have all a huge impact on trade. Language as a cultural attribute is easy to understand, but other things such as social norms are a more deeply rooted system of unspoken principles that guide people in their daily interac-tions and choices (Ghemawat, 2001).
Accession to a regional free trade agreement, RTA, may stimulate trade among the member countries and may cause major effects at the expense of third parties. If an RTA leaves all prices unchanged, with tariffs eliminated between members but maintained on all other countries, then member countries will buy more from one another. Each member state will substitute away from consumption of goods bought from non-member countries. In order to clear markets, the price of non-member goods will have to fall, which will create a posi-tive terms-of-trade-effect for the member countries (Fernandéz & Portes, 1998). Accession to a regional free trade agreement is expected to have a positive relation on import if Tai-wan belongs to the same trade agreement as another country, and vice versa (Bussière, Fidrmuc & Schnatz, 2005).
3
Empirical Framework
The empirical test aims to analyse how changes in GDP in the exporting country, exchange rate changes, language and membership of APEC affect the Taiwanese import. This sec-tion also includes commodity data.
3.1
Data Selection and Time Period
In addition to Taiwan and Sweden, thirty-four countries are selected to be included in this study. Twelve of these countries belong to the Pacific Rim. The remaining countries are the OECD member economies excluding Slovakia, Iceland and Turkey, which are not included in the study because of lack of data.
The years of study are 1994 to 2005. The examination of the imported commodities to Taiwan is, according to limitations of available data, observed until 2004.
The exchange rates are calculated with the Taiwanese Dollar as the base currency. In deal-ing with the Euro-countries, the value of their currencies against the Euro has been calcu-lated in 1999. The 1999 year’s ration has been used as a base year and then extended back to 1994, allowing the Euro-countries to have one currency, the Euro, during the whole pe-riod of study.
The statistical program SPSS has been used for the regression. The regression model is tested at a 5% significance level. The null hypothesis states that the explanatory variables do not affect the percentage change in imports of Taiwan. The data used when running the regression is cross-sectional between the different countries. Percentage changes of the av-erage GDP and avav-erage exchange values between two periods 1994-2000 and 2001-2005 are calculated for the analysis. The first period is chosen on the basis that Sweden up to the year 2000 experienced strong export to Taiwan. The latter period is chosen since the Swed-ish export in this period has been decreasing. An average for each factor and period has been calculated, and then the percentage change between them is taken.
The commodities of study are chosen on the basis of presented commodity groups at the Swedish Trade Council of Taiwan. The commodity groups have further been compared and matched with commodity groups on Source OECD database. Taiwan’s highest valued import products have also been covered with respect to Source OECD database.
Because of difficulties obtaining one full-covering database, it should be kept in mind that the data have been collected from different sources. The interpretation of the data should hence be done with prudence since different data sources calculate, collect and handle sta-tistics differently.
The data on Taiwanese imports from the chosen countries are collected from Econwin. The estimates of GDP are collected from the United Nations Statistical Division and the National Statistics Republic of China. The data on exchange rates are from
www.gocurrency.com and United Nations Statistical Division, and the commodity groups are collected from www.swedishtrade.com and the Source OECD database.
3.2
Regression Model
Gravity models are one of the most commonly used empirical techniques to analyse pat-terns in international trade. Because of their simplicity and explanatory power, the gravity model has been applied in several studies (Bussière et al, 2005).
Four dummy variables are commonly added to the gravity model. First, it is likely that countries that share the same language trade more with each other than otherwise. Second, countries that in the past have been members of the same territory may have closer trade ties than otherwise. Third, countries that share a common border may have reduced trans-action costs, which may generate higher bilateral trade. Finally, accession to a free trade ar-rangement may stimulate trade among the member countries (Bussière et al, 2005).
Using logarithms, equation (2.2) can be converted to a linear form for econometric analysis:
ij ij j i ij A Y Y D T =ln +β ln +β ln +β ln +ε ln 1 2 3 (3.1)
Alternatively, equation (2.2) may be converted to percentage changes in each of the vari-ables, indicated with a ^.
ij ij j i ij Y Y D Tˆ =β0 +β1ˆ +β2ˆ +β3 ˆ +ε (3.2)
Equation (3.2) has been modified in this thesis to consider the change in exports to Tai-wan, specifically we use the equation
i t i i ij Y e D D Xˆ =β0 +β1ˆ +β2ˆ +β3 1+β4 2 +ε (3.3)
where Xij is Taiwan’s percentage change in imports of goods from the selected countries, Ŷi is the percentage change in GDP for the exporting country, êi is the percentage change in exchange rate, and D1 and D2 are the dummy variables that have been included for lan-guage commonality and free trade agreements. The dummy variables are coded either 1 or 0, see Table 3.1. Countries, which have the same official language as Taiwan, according to Swedish Trade Council (2007), have D1 coded with 1. Otherwise D1 is coded with 0. D2 is coded with 1 if a country is a member of APEC, of which Taiwan is a member, and is coded with 0 if a country is not a member of APEC.
Based on theory, (2.2), one can assume the coefficient estimate to be positive for GDP growth since the larger production leads to more output that can be exported.
Furthermore, there is a positive relationship between an appreciation in the Taiwanese Dollar and imports from other countries, and a negative relationship between a deprecia-tion in the Taiwanese Dollar and imports from other countries according to theory (2.4). Hence, one can assume the coefficient estimate to be positive for êi.
From the theory discussion in section (2.5), exports to Taiwan should be positive if a coun-try shares the official language with Taiwan, so the coefficient estimate for D1 should be positive. According to theory, (2.5), the coefficient estimate will be positive if a country be-longs to the same regional free trade agreement as Taiwan. Since the growth in Taiwan’s GDP is constant it will not be used in the regression. The same applies for geographical distance.
3.3
Econometric Challenges
Assessing trade patterns and estimating the gravity model is subject to several econometric challenges. The focus in recent literature on gravity models, has been on the impact of pol-icy variables such as free trade areas, common borders or the participation in a currency union on international trade instead of the structure of trade (Bussière et al, 2005).
The gravity model approach in many papers still uses cross-section or a pooled OLS speci-fication, and often ignores country heterogeneity. Average data over longer periods or re-peated cross-section regression has been used by other authors to account for structural changes in the trade of transition economies (Bussière et al, 2005).
That some of the explanatory variables have some endogenous characteristics is also a po-tential threat of standard estimation techniques, which can not be ruled out. For instance, the initial level of bilateral trade may be very important when establishing a free trade area. The establishment of a free trade arrangement may come from very high trade flows, rather than vice versa (Bussière et al, 2005).
3.4
Empirical Results
Table 3.1 shows the values for the variables in equation (3.3) for various countries.
Country % change in exports to Taiwan GDP Growth % apprecia-tion of TWD vs currency D1 D2 Australia 0,162341 0,36059 -0,03633 0 1 Austria 0,09032 0,166565 -0,06342 0 0 Belgium -0,18353 0,189133 -0,06288 0 0 Canada -0,16923 0,416295 -0,1359 0 0 China 2,212812 0,789149 -0,1423 1 1 Czech Rep -0,11726 0,626206 -0,17019 0 0 Denmark 0,000744 0,229132 -0,07576 0 0 Finland 0,356244 0,2898 -0,06948 0 0 France -0,33877 0,206564 -0,07258 0 0 Germany -0,02546 0,074858 -0,0617 0 0 Greece -0,26762 0,435422 -0,03406 0 0 Hong Kong 0,021073 0,039333 -0,12474 0 1 Hungary 0,26933 0,789206 0,11511 0 0 India 0,427534 0,51817 0,078666 0 0 Indonesia 0,484368 0,198465 0,618165 0 1 Ireland 1,255932 0,931134 -0,06596 0 0 Italy -0,17606 0,259631 -0,08498 0 0 Japan 0,182664 -0,05409 -0,08917 0 1 Luxemburg 0,180693 0,437742 -0,06288 0 0 Malaysia 0,283798 0,23904 0,067087 0 1 Mexico 0,236097 0,609938 0,205717 0 0 Netherlands 0,087507 0,289448 -0,06024 0 0 New Zealand 0,038184 0,35924 -0,07568 0 1 Norway -0,16331 0,491937 -0,1054 0 0 Philippines 1,03497 0,107082 0,359568 0 1 Poland -0,51982 0,491253 0,043393 0 0
Portugal 0,569314 0,344477 -0,06451 0 0 Singapore 0,254542 0,144556 -0,5744 1 1 South Korea 0,751031 -0,79273 0,033555 0 1 Spain 0,05798 0,47758 -0,05978 0 0 Sweden -0,16878 0,192597 -0,05012 0 0 Switzeraland -0,07347 0,142447 -0,12166 0 0 Thailand 0,299502 0,010666 0,146035 0 1 UK -0,12466 0,418095 -0,15929 0 0 USA -0,08201 0,339667 -0,12802 0 1
Tabell 3.1Variables percentage change for various countries.
According to the table, Taiwan has increased its import from all observed countries in the Pacific Rim. The most remarkable increase is the imports from China. One surprising find-ing is that Ireland is the country next after China, in havfind-ing the strongest increasfind-ing change in export to Taiwan among the countries in this research. Taiwan has faced decreasing im-port from the major part of the OECD countries, i.e. Sweden’s decreasing exim-port to Tai-wan is not deviant.
The changes in GDPi are positive for all countries except Japan, South Korea and Hun-gary. Ireland and China proved to have the highest positive changes in GDP.When study-ing the change in the exchange rates, it can be observed that Taiwan has faced depreciation against most of the countries including Sweden.
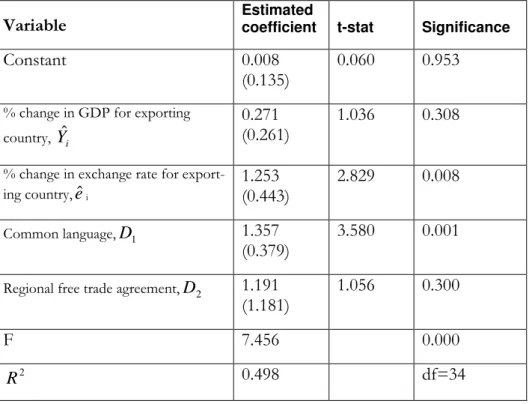
The data from Table 3.1 have been used in estimating the regression model (3.3). The re-gression results are summarized in table 3.2 below. The signs of the estimated coefficients are in accordance with theoretical framework and prior expectations.
Variable
Estimated
coefficient t-stat Significance
Constant 0.008
(0.135)
0.060 0.953
% change in GDP for exporting country, Yˆi
0.271 (0.261)
1.036 0.308
% change in exchange rate for export-ing country,eˆi
1.253 (0.443) 2.829 0.008 Common language,D1 1.357 (0.379) 3.580 0.001
Regional free trade agreement,D2 1.191
(1.181)
1.056 0.300
F 7.456 0.000
2
R 0.498 df=34
Tabel 3.2 The impact of GDP growth, exchange rate changes, D1 and D2, on percent change in Taiwanese
The empirical results show that R² equals 0.498 which means that 49.8 percent of the ance in Taiwan’s import in the selected time period is determined by the explanatory vari-ables.
The coefficient estimates for the rate of appreciation and the language dummy are signifi-cant at the one-percent significance level. The other two variables indicate insignifisignifi-cant val-ues for the coefficient estimates. The probability-valval-ues, p-valval-ues, for exchange rate and dummy 1 indicates a low risk of committing a Type 1 error.
From the result of the regression above we can obtain partial plots of the residuals. Of im-portance is the partial plot for exchange rate, which is shown in figure 3.1.
Figure 3.1 Partial plot of changes in exchange rate and imports
When examining the partial plot2, one can observe how countries differs in comparison to each other. Two prominent observations can be seen. First, Sweden (sw) is not deviant from the majority of the studied countries. However, its rate of increase in exports to Tai-wan is somewhat less than the regression would predict, as shown by the regression line. Second, Ireland (ir), South Korea (sk), China (ch), and the Phillipines (ph) can be observed as having notable higher-than-predicted exports to Taiwan. Appendix 1 provides a full list of the countries’ abbreviations.
2 The partial plot is generated by having both variables regressed separately on the rest of the independent
variables, and than plotting their residuals against each other.
% appreciation of TWD 0,6 0,4 0,2 0,0 -0,2 -0,4 % change in imports 1,0 0,5 0,0 -0,5 -1,0 pg po me lu hu gr cz ca be au us th sw sk si ph nz ma jp ins in hk ch oz uk sz sp no ne it ir ge fr fi de
Dependent Variable: % change in export to Taiwan
3.5
Commodity Data
In order to investigate whether Taiwan has changed its import demand and started to im-port other goods than those Sweden had in previous years exim-ported to it and also see whether Taiwan has changed trading partners, data on different commodity groups and countries have been gathered.
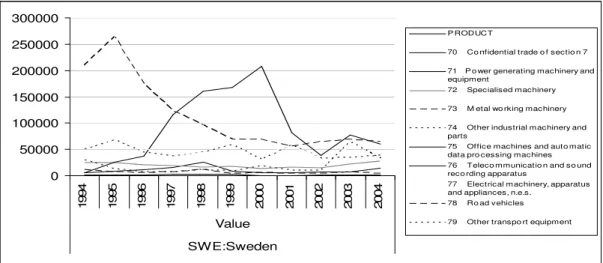
The Y-axis values in figures 3.2 to 3.7, are expressed in thousands of US Dollars. Figure 3.2 shows a summary of Sweden’s exported commodities to Taiwan from 1994 to 2004.
0 50000 100000 150000 200000 250000 300000 350000 400000 450000 500000 1 9 9 4 1 9 9 5 1 9 9 6 1 9 9 7 1 9 9 8 1 9 9 9 2 0 0 0 2 0 0 1 2 0 0 2 2 0 0 3 2 0 0 4 Value Sweden PRODUCT
0 Food and live animals 1 Beverages and tobacco 2 Crude materials, inedible, except f uels
3 Mineral f uels, lubricants and related materials
4 Animal and vegetable oils, f ats and w axes
5 Chemicals and related products, n.e.s.
6 Manuf actured goods 7 Machinery and transport equipment
8 Miscellaneous manuf actured articles
9 Commodities and transactions, n.e.s.
Figure 3.2 Sweden's exported commodities to Taiwan 1994–2004 (Source OECD, 2007)
The most important observation of figure 3.2 is that Sweden has strongly decreased its ex-ports principally in its biggest export commodity group to Taiwan, machinery and transport equipment. From figure 3.2 one can observe that manufactured goods are also an impor-tant export commodity group from Sweden to Taiwan and this group has fluctuated sub-stantially during the period. The export value of the manufactured goods ends up at the same value as in 1994. Hence, manufactured goods will not be discussed further. The re-maining commodity groups are shown to be of less importance for this thesis since they show considerably low values.
Figure 3.3 shows Taiwan’s total imported commodities from the world from 1994 to 2004.
0 10000000 20000000 30000000 40000000 50000000 60000000 70000000 80000000 1 9 9 4 1 9 9 5 1 9 9 6 1 9 9 7 1 9 9 8 1 9 9 9 2 0 0 0 2 0 0 1 2 0 0 2 2 0 0 3 2 0 0 4 Value AAA:World PRODUCT
0 Food and live animals 1 Beverages and tobacco 2 Crude materials, inedible, except f uels
3 Mineral f uels, lubricants and related materials
4 Animal and vegetable oils, f ats and w axes
5 Chemicals and related products, n.e.s.
6 Manuf actured goods 7 Machinery and transport equipment
8 Miscellaneous manuf actured articles
9 Commodities and transactions, n.e.s.
From figure 3.3 it can be observed that Taiwan has substantially increased its import of machinery and transport equipment during the studied time period. Compare this figure to the figure 1.2, it can be concluded that imports in machinery and transport equipment is a large part of the source behind Taiwan’s overall increase in imports.
0 5000000 10000000 15000000 20000000 25000000 30000000 35000000 40000000 1 9 9 4 1 9 9 5 1 9 9 6 1 9 9 7 1 9 9 8 1 9 9 9 2 0 0 0 2 0 0 1 2 0 0 2 2 0 0 3 2 0 0 4 Value AAA:World P RODUCT
70 Co nfidential trade o f sectio n 7 71 P o wer generating machinery and equipment
72 Specialised machinery 73 M etal wo rking machinery 74 Other industrial machinery and parts
75 Office machines and auto matic data pro cessing machines 76 Teleco mmunicatio n and so und reco rding apparatus
77 Electrical machinery, apparatus and appliances, n.e.s.
78 Ro ad vehicles 79 Other transpo rt equipment
Figure 3.4 Taiwan’s sub-commodities of machinery and transport equipment from the world 1994-2004 (Source OECD, 2007)
Looking further into the sub commodities of machinery and transport equipment in figure 3.4, it can be observed that the only sub-commodity group within machinery and transport equipment, that considerably increases in import into Taiwan is electrical machinery, appa-ratus and appliances. Comparing this curve with the machinery and transport equipment curve in figure 3.3, it seems likely that the electrical machinery apparatus and appliances group is of high importance in explaining the growth of machinery and transport equip-ment and thus Taiwan’s overall increase in imports.
0 50000 100000 150000 200000 250000 300000 1 9 9 4 1 9 9 5 1 9 9 6 1 9 9 7 1 9 9 8 1 9 9 9 2 0 0 0 2 0 0 1 2 0 0 2 2 0 0 3 2 0 0 4 Value SWE:Sweden P RODUCT
70 Co nfidential trade o f sectio n 7 71 P o wer generating machinery and equipment
72 Specialised machinery 73 M etal wo rking machinery 74 Other industrial machinery and parts
75 Office machines and auto matic data pro cessing machines 76 Teleco mmunicatio n and so und reco rding apparatus
77 Electrical machinery, apparatus and appliances, n.e.s.
78 Ro ad vehicles 79 Other transpo rt equipment
Figure 3.5 Taiwan’s import value from Sweden of sub-commodities of machinery and transport equipment 1994-2004 (Source OECD, 2007)
Figure 3.5 shows Taiwan’s import value from Sweden of the sub-commodities of machin-ery and transport equipment from 1994 to 2004.
From this figure, one can see that the Swedish export of road vehicle equipment to Taiwan has decreased during the whole period of study. In the telecommunication category, Swe-den has experienced a sharp decrease from the year 2000. The electrical machinery, appara-tus and appliances group, which Taiwan has sharply increased its imports of, has never had great importance as an export commodity of Sweden to Taiwan.
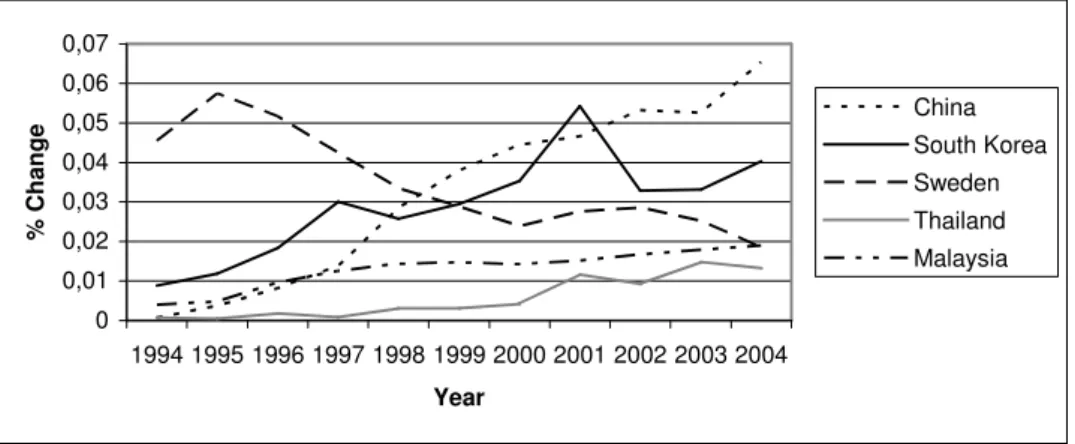
In order to investigate which countries that have gained market shares in the two commod-ity groups that Sweden has lost export volume in, telecommunication and road vehicles, data on these commodity groups for different countries have been collected. Figure 3.6 re-veals that the economies that have increased their share of exports to Taiwan in telecom-munication at the expense of the Swedish share are China and South Korea.
0 0,05 0,1 0,15 0,2 0,25 1994 1995 1996 1997 1998 1999 2000 2001 2002 2003 2004 Year % c h a n g e China South Korea Sweden
Figure 3.6 Share of imports in Telecommunication 1994-2004 (Source OECD, 2007)
Sweden’s share of total Taiwanese imports in telecommunication has declined from six percent in 1997 to 1.6 percent in 2004. China has during the studied period increased its share of exports to Taiwan in telecommunication from two percent of the total Taiwanese imports in 1994 to 21 percent in 2005. South Korea has also increased its share of exports to Taiwan in telecommunication from five percent in 1994 to 16 percent in 2004.
Figure 3.7 describes the economies that have increased their share of exports in road vehi-cle to Taiwan at the same time as Sweden has lost shares of exports in road vehivehi-cle to Tai-wan. 0 0,01 0,02 0,03 0,04 0,05 0,06 0,07 1994 1995 1996 1997 1998 1999 2000 2001 2002 2003 2004 Year % C h a n g e China South Korea Sweden Thailand Malaysia
Figure 3.7 Share of imports in Road Vehicles 1994-2004 (Source OECD, 2007)
During the whole period of study, Sweden has experienced a decline of its share of exports to Taiwan in road vehicle. In 1994, Sweden’s share of exports of total Taiwanese imports in
road vehicle reached 4.5 percent, and in 2004 the shares of exports had dropped to 1.9 per-cent. China has increased its share of exports of total Taiwanese imports in road vehicle from 0.06 percent in 1994 to 6.5 percent in 2004. South Korea has during the same studied period and industry increased its share of exports of total Taiwanese imports from 0.9 per-cent to four perper-cent. Thailand and Malaysia have also increased their share of exports in road vehicle to Taiwan from 0.07 percent and 0.4 percent respectively to 1.3 percent and 1.9 percent respectively.
4
Analysis
Taiwanese imports are shown to be affected positively by the income in the exporting country, an appreciation in the Taiwanese Dollar, a common language, and by a shared membership of a regional free trade agreement. Based on theoretical framework, sections (2.2), (2.3), (2.4) and (2.5), and in accordance to the empirical tests in section three, all pre-dictions are supported by the signs on the associated coefficient estimates in model (3.3). The coefficient estimates for the rate of appreciation and the common language dummy are significant at the five percent significance level. This means that these variables signifi-cantly have affected Taiwan’s changed trade pattern during the studied time period.
Overall, Taiwan has increased its imports. This is supported by the regression since most countries have faced positive GDP growth. Furthermore, the countries that Taiwan has in-creased its imports from the most are the countries which Taiwan also has faced an appre-ciation against. Even though the GDP of Taiwan was not included in the regression, theory predicts that a rise in a country’s income raises its import spending (2.2). Taiwan shows a positive percentage change in GDP over the years of study and has more than doubled its total import value during the studied time period.
Theory (2.2) predicts that a rise in a country’s output implies larger production and larger export. The regression results indicate that an increase of one percent in the output of the exporting countries increases Taiwanese overall imports by 0.271 percent. China has a strong GDP growth and China is the country in this study that shows the highest increase in export to Taiwan. South Korea, on the other hand, has faced a negative GDP growth, which theory (2.2) suggests should have a negative effect on exports. However, South Ko-rea has incKo-reased its export to Taiwan during the studied period. Culture similarities and a depreciation in the Korean Won may overcome the GDP-effect of the exporting country. At the one percent significance level it can be concluded that the exchange rate is an im-portant factor to the change in imports for Taiwan. Hence the null hypothesis may be re-jected that exchange rate changes do not affect changes in import of Taiwan. The coeffi-cient estimates for exchange rate shows that an appreciation of the Taiwanese dollar by one percent will increase Taiwanese imports by 1.25 percent.
Taiwan has actually faced a depreciation of its currency against most economies of OECD. In accordance with theory, Taiwan has also decreased its import from most of the coun-tries it has depreciated against since Taiwan has faced relatively more expensive imports. The only countries Taiwan has appreciated against over the two periods are India, Indone-sia, MalayIndone-sia, South Korea, Thailand, the Philippines, Hungary, Poland and Mexico, as many of these where strongly affected by the Asian crises. In line with the theory (2.4), Taiwan has also increased its import from these economies, with the exception of Poland. Looking at the partial plot of exchange rate, the countries that having notable higher-than-predicted exports to Taiwan are Ireland (ir), South Korea (sk), China (ch), and The Philip-pines (ph). Indonesia (ins), Poland (po) and Singapore (si) have prominent lower-than-predicted exports to Taiwan. Sweden (sw) lies just below the OLS regression line in the partial plot together with most of the other OECD economies.
Even though there has been a depreciation of TWD against the Chinese Yuan there has been a substantial increase in the Taiwanese imports from China. This is most probably due to language and cultural ties between the two countries, which may overwhelm the
supposed negative effect of the exchange rate. Further, the colonial history between the two (not included in the regression model), surely has a strong effect. The “rise of the dragon” and its enormous production possibilities will affect most countries import deci-sions.
Even though theory (2.4) predicts that a strong euro ought to have a negative effect of Taiwanese imports from Ireland, Ireland shows strong export to Taiwan despite its strong currency. Ireland has experienced the highest GDP growth of all observed countries in this study, which may crowd out the negative exchange rate effect. The Swedish Krona has faced an appreciation against the TWD at the same time as Sweden has decreased its ex-port to Taiwan in accordance to theory predictions, which is a common result. The major-ity of the OECD countries have experienced appreciations against TWD along with a de-creased export.
The positive coefficient estimate for D1, common language, confirms a positive relation-ship between Taiwan sharing the same language as a trading partner and import growth from that trading partner. The p-value is significant at one percent level of significance, which supports a rejection of the null hypothesis that language commonality does not af-fect imports of Taiwan. Language is hence a considerably important factor for the determi-nation of economies’ trading partners.
As theory suggests, geographic transaction costs can be related to distance, but also to bar-riers between states such as differences in language and culture, social and political differ-ences, different religious beliefs, and different political strategies. Hence, language goes hand in hand with factors such as culture, and social, political and religious conditions. Common characteristics of the traders lower the geographic transaction costs and makes it easier and more inexpensive to trade.
Taiwan has increased its import from all countries in the Pacific Rim during the studied time period and one can assume the culture in these countries to be similar to Taiwan. China, South Korea and the Philippines show the highest increase in their export to Tai-wan out of all studied countries (except Ireland).These are also the countries, which geo-graphically lie closest to Taiwan and should have the absolute lowest geographic transac-tion costs, this in line with theory (2.5). Taiwan is sharing the same language as China and Singapore. China’s export to Taiwan shows the most significant increase of all observed countries. Taiwan has decreased its import from the major part of the OECD countries. The Asian culture is considerably different from the culture in the West, which implies a higher geographic transaction cost for Taiwan with non-Asian countries.
The positive coefficient estimate for D2, common membership of a RTA, supports the positive relationship between a membership of a RTA with Taiwan and exports to Taiwan. Theory also predicts (2.5) that accession to a RTA stimulates trade among the member countries and may cause major effects at the expense of non members. The theory and the statistical insignificance of the result are not in line. Hence, the establishment of free trade agreements may come initially from very high trade flows rather than vice versa. This may explain the insignificant result for dummy 2. There is a relationship between accessions to the same RTA as Taiwan, in this case APEC, and Taiwan’s import growth but this relation-ship is insignificant and not as important perhaps as exchange rate changes and common language in determining import growth. Nevertheless, Taiwan has increased its import from all APEC-members except from the US and has decreased its import from most of the OECD countries during the analysed period.
Taiwan has, during the studied period increased its trade volume with its neighbouring countries at the expense of the major part of the OECD countries. Taiwan has also during this period extensively increased its import value in the machinery and transport equipment commodity group.
Sweden has faced a strong decrease in its export to Taiwan of the biggest commodity group machinery and transport equipment. This is also the biggest commodity group for Taiwan imports and the group in which Taiwan has increased its imports the most. This gives the impression that Taiwan has not decreased its demand for machinery and trans-port equipments, and that Sweden has lost its market shares to newly emerging trading partners of Taiwan. However, it can be observed by figure (3.4) that the commodity in which Taiwan has increased its import demand the most is electrical machinery, apparatus and appliances. Hence, Taiwan has consequently not only changed its trading partners but relatively also changed its import demand. This commodity group is in the Swedish case not growing significantly, observed in figure (3.5). Sweden’s export value to Taiwan has de-creased severely in road vehicles during the whole period of study. In the telecommunica-tion category Sweden has experienced a sharp decrease from the year 2000, and comparing this graph to figure (1.1) one can observe that the two have very similar features. The Swedish export declines in a group, which Taiwan does not significantly change its demand in. Taiwan increases its import in a commodity group, in which Sweden never has been any major exporter to Taiwan.
From the figures (3.6) and (3.7) it shows that Sweden’s lost shares of export in telecommu-nication and road vehicle on the account of countries geographically much closer to Tai-wan; China, South Korea, Malaysia, and Thailand. In accordance to both theory and em-pirical results it is not strange that Taiwan has chosen these countries as trading partners instead of Sweden. China and South Korea have increased their shares of exports to Tai-wan in telecommunication considerably. In road vehicles, China and South Korea again gained the largest shares of export to Taiwan at the expense of Swedish shares of export. Furthermore, Malaysia and Thailand have also increased their shares of exports in road ve-hicles to Taiwan.
For South Korea and Thailand, which have experienced depreciations against TWD, ex-change rates have likely been an important factor of Taiwan’s import decisions. The em-pirical results show that an appreciation of TWD by one percent will increase Taiwan’s im-ports by 1.253 percent. Further, these countries are in comparison to Sweden very close to Taiwan, which theory suggests has strong effects on trade decisions.
In China’s case, common language with Taiwan is likely as an important determinant factor of rising exports to Taiwan, in line with the empirical results and theory (2.5). A prominent feature for China and also South Korea, Malaysia and Thailand is that culture and social norms are similar between them and Taiwan. According to the theories and empirical re-sults, it will be very hard for Sweden to compete with these growing regional economies when language and culture are of such big importance.
Import decisions of Taiwan are more and more dominated by regional trade. Not only that the geographic transport costs are lower, but also similar culture attributes such as lan-guage, religious beliefs and social norms, makes it much more obvious for Taiwan to choose these countries as its trading partners. In addition, and in line with theories (2.1), (2.2) and (2.3), when these local economies experience economic growth, they will of course produce more goods and export their surplus. The economic growth of emerging economies of Asia shifts the world production from the west (most of the OECD) to the
economies in Asia, which have a comparative advantage in relatively low labour cost. This shift in economic activity makes it even more obvious that Taiwan will be importing more from its regional neighbours now than ten years ago.
5
Conclusion and Further Research
The purpose of this thesis has been to investigate the determinants of Taiwan’s import changes, and more specifically, to analyze underlying factors of Taiwan’s declining import from Sweden over the last years.
The empirical results showed that the Taiwanese import growth is affected positively by the income in the exporting country, appreciation of the TWD, common language with the exporting country, and by a shared membership of a regional free trade agreement. These variables determine 49.8 percent of the variance in import growth of Taiwan. Exchange rate and language are shown to affect Taiwan’s changed trade pattern significantly in a sta-tistical sense.
Electrical machinery, apparatus and appliances is the commodity group that Taiwan has in-creased its imports of the most. This is a commodity group which Sweden never has been a major exporter of to Taiwan. Swedish exports to Taiwan have declined in a group, which Taiwan does not significantly change its demand in. Sweden has apparently lost export market shares on the account of Taiwan’s neighbouring countries.
The final conclusion of this thesis is that the factors that arguably have determined Swe-den’s declining export to Taiwan over the latest years are exchange rate changes, common language and increased Asian regional trade. Sweden is not an exception among the OECD countries, which overall have lost export shares to Taiwan. As long as language and culture are important determinants for trading decisions, Sweden and the rest of the western economies will have difficulties to compete on the Asian market.
The question of what determines the import and export volumes in specific industries arose during the work with this study. Since Sweden is a big exporter of IT industry and telecommunication and the results of this thesis shows that Sweden is losing market shares to Taiwan in this industry, further studies on what affects export in the telecommunication industry would be of interest.
Asian regional trade has grown strong during the period studied in this thesis, and to inves-tigate the extent of this trend and its consequences in the future is another subject to exam-ine further.
This thesis has also shown that Sweden and other OECD countries had difficulties to compete with Taiwan’s regional trading partners. However, Ireland was shown to be an outstanding economy with respect to increasing export volume to Taiwan. It would be in-teresting to examine the cause of those increasing exports.
References
Aspalter, C. (2001) Understanding Modern Taiwan, Essays in economics, politics and social policy. England: Ashgate Publishing Limited
Bade, R. Parkin, M. (2004) Foundations of Macroeconomics. 2nd ed. Boston: Pearson Addison Wesley
Brakman, S. Garretsen, H. and Marrewijk van, C. (2005) An introduction to geographical econom-ics. United Kingdom: The press syndicate of the University of Cambridge Bussière, M. Fidrmuc, J. and Schnatz, B. (2005) Trade Integration of Central and Eastern
European Countries: Lessons from a Gravity Model. Working Paper Series, No. 545 European Central Bank
Cheong, C. (2004) Does the risk of exchange rate fluctuations really affect international trade flows between countries? Economics Bulletin, Vol 6, No. 4 pp. 1-8
CIA The World Factbook (Updated: 2007-04-17) Sweden [online] Available from:
https://www.cia.gov/library/publications/the-world-factbook/geos/sw.html#Econ
Retrieved: 2007-04-26
CIA The World Factbook. (Updated: 2007-04-17) Taiwan [online] Available from:
https://www.cia.gov/cia/publications/factbook/geos/tw.html#issues Retrieved: 2007-04-26
Dent, C.M. (2005) Taiwan and the New Regional Political Economy of East Asia. China Quarterly, Vol 182, pp. 385-406
Dornbusch, R. Fischer, S. and Startz, R. (2004) Macroeconomics. 9th ed. Boston: Mcgraw- Hill/Irwin
Econwin, Reuters database. Retrieved: 2007-05-03
Fernández, R. Portes, J. (1998) Returns to Regionalism: An analysis of non-traditional gains from regional trade agreements. The World Bank economic review, Vol 12, No. 2, pp. 197-220
Ghemawat, P. (2001) Distance Still Matters, the Hard Reality of Global Expansion. Harvard Business Review, September 2001, pp. 137-147
Go Currency.com. (Updated: 2007-04-10) Historic Exchange Rates [online] Available from: http://www.gocurrency.com/
Retrieved: 2007-04-05 to 2007-04-10
Hacker, S. and Johansson, B. (2001) Sweden and the Baltic Sea Region: Transaction Costs and Trade Intensities. In Bröcker, J. and Herrmann, H. ed. Spatial Change and
Interregional Flows in the Integrating Europe. Essays in Honour of Karin Peschel. Heidel-berg: Physica-Verlag
Hsiao, F. and Hsiao, M. (2001) Taiwan in the global economy –Past, Present and Future, Working paper 2001-17 (September 2001) University of Colorado at Boulder and University of Colorado at Denver, USA
Kleen, P. Moberg, C. and Palm, G. (2003) Världshandeln –Utveckling, Aktörer och Spelregler. Stockholm: SNS Förlag
Krugman, P.R. and Obstfeld, M. (2003). International Economics Theory and Policy. 6th ed. Pat-parganj Delhi, India: Pearson Education.
Krugman, P.R. and Obstfeld, M. (2006) International Economics Theory and Policy. 7th ed. Bos-ton: Addison Wesley
Mishkin, F.S. (2006) The Economics of Money, Banking, and Financial Markets. 7th ed. USA: Daryl Fox
National Statistics Republic of China (Taiwan). (Updated: 2007-03) Key indicators of
na-tional income [online] Available from:
http://eng.stat.gov.tw/public/data/dgbas03/bs2/yearbook_eng/Y093.pdf
Retrieved: 2007-04-11
Petri, P. (2006) Is East Asia becoming more interdependent? Journal of Asian Economics 17, pp. 381-394
Roland-Holst, D. Verbeist, J. and Zhai, F. (2005) Growth and Trade Horizons for Asia: Long-term Forecasts for Regional Integration. Asian Development Review. Vol. 22, No. 2, pp 76-107
Source OECD. (Updated: ) SourceOECD ITCS International Trade by Commodities Sta-tistics, Chinese Taipei (1994-2004) [online] Available from: http://oecd-stats.ingenta.com/OECD/eng/TableViewer/Wdsdim/dimensionp.asp?IVTFil eName=6nr3twn.ivt
Retrieved: 2007-04-03
Swedish Trade Council. (Updated: 2007-02 ) Trade Profile Taiwan [online] Available from:
http://tradeprofiles.swedishtrade.se/default.asp?id=112 Retrieved: 2007-02-15
United Nations Statistics Division. (Updated 2007-01) GDP [online] Available from:
http://unstats.un.org.bibl.proxy.hj.se/unsd/snaama/SelectionQuick.asp
Retrieved: 2007-05-03
United Nations Statistics Division. (Updated 2007-01) Exchange Rate [online] Available from:
Retrieved: 2007-05-03
Wickman, K. (2005) De asiatiska mirakelekonomierna -ekonomisk liberalism, inte skyddstullar. Ud-devalla: AB Timbro