Abstract
Nynas Petroleum is one of the world´s largest producers of naphthenic specialty oils. They have refineries in several parts of the world and their largest production facility is situated in Nynäshamn, Sweden. They also have oil depots in all continents and their largest depot is located in Antwerp, Belgium. In the beginning of 2007 Nynas introduced a new type of transformer oils, called Nova grades, to the market. Nova grades consisted of oils produced both in Nynäshamn and at other refineries around the world. This forced Nynas, who had previously blended these oils in Nynäshamn, to blend the nova grades at the central hub in Antwerp. This change complicated the handling of the depot in Antwerp as some of these oils needs to be oxidation tested, a process that can take up to 23 days. They realized that they did not have control of their hub in Antwerp and how much tank volumes that were needed to fulfill their customers´ service expectations. This thesis maps the factors that are crucial for the hub in Antwerp and from this knowledge a simulation model was built using the simulation software Extend. The model was built up around a number of logical blocks, which makes decisions depending on different criteria. The model was then used to simulate a number of different scenarios. A total of 15 different scenarios were simulated where the tank setup, the demanded volumes, the quarantine times and the number of boats transporting oil to Antwerp were altered. Each run generated a report consisting of average inventory levels, service levels, average service level, filling station utilization, and more. With help from the reports we were able to examine the performance of the Antwerp hub and how the different parameters impacted on the overall efficiency. After running the simulations we can establish that the tank setup as it was in 2007 cannot cope with the alteration in product slate, with the introduction of the Nova grades and especially not with the anticipated growth in sales volume. In the first phase investments in tank capacity is needed and if the anticipated sales growththe next bottleneck. Another option, which would lessen the need for investments in tank capacity would be to drastically cut the oxidation test time. This would make the system easier to overview and handle. By investing in the hub in Antwerp the service level can be kept at a high level, leading to higher customer satisfaction and increased likelihood for returning customers. It is always hard to put a certain value on this type of investments but our beliefs are that investments to keep service level reasonably high are needed in a market where competition is fierce.
Preface
This mater thesis is the final phase of our M.Sc. Industrial management and Engineering. It was written during the summer and fall of 2007. While working on the thesis we were situated at Nynas Petroleum’s head office in Johanneshov. The thesis comprises 30 points and was conducted in collaboration with the Department of Industrial Management and Logistics department Production Management at Lund Institute of Technology and Nynas Petroleum AB in Stockholm. Our supervisors have been Stefan Vidgren at the university and Andreas Jerper at Nynas Petroleum. We would like to take this opportunity to thank the people who have helped us through the thesis. First and foremost we would like to thank Stefan and Andreas for their support. Next we would like to thank the whole supply department at Nynas Petroleum in Johanneshov for taking time to answer our questions, especially Anders Nilsson who has always encouraged us and been very enthusiastic over this thesis. Another person who we must not forget to thank is Matts Nordlund who helped us find the data necessary to complete this thesis. Thank you! Stockholm 2008‐01‐18 Erik Andersson Oskar LönnContents
1 Introduction ... 1 1.1 Problem introduction ... 1 1.2 Purpose ... 1 1.3 Directives ... 2 1.4 Constraints ... 2 1.5 Target group ... 2 2 Nynas ... 3 2.1 Nynas history ... 3 2.2 Nynas today ... 4 2.2.1 Organization ... 4 2.2.2 Vision ... 4 2.2.3 Nynas Bitumen ... 5 2.2.4 Nynas Naphthenic ... 6 2.2.5 Naphthenic Supply Chain ... 7 2.2.6 Production ... 8 3 Methodology ... 9 3.1 Introduction ... 9 3.2 Scientific approach ... 9 3.2.1 Analytical approach ... 9 3.2.2 Systems approach ... 10 3.2.3 Actors approach ... 10 3.2.4 Positivism and hermeneutism ... 11 3.2.5 Our approach ... 11 3.3 Research approach ... 123.4 Data gathering ... 13 3.4.1 Validity and reliability ... 13 3.4.2 Qualitative and Quantitative data ... 14 4 Theory ... 15 4.1 Inventory management ... 15 4.2 Inventory costs ... 15 4.3 Ordering systems ... 16 4.4 Service levels ... 18 4.5 Transport and carrying devices ... 20 4.5.1 Boats ... 20 4.5.2 Trucks ... 21 4.6 Drums and containers ... 21 5 Empirics ... 23 5.1 Mapping the Nynas supply chain ... 23 5.1.1 Physical layout ... 23 5.1.2 Activities in the supply chain ... 24 5.1.3 Lead times ... 24 5.1.4 Demand ... 24 5.1.5 Inventory ... 24 5.2 Nynas replenishment order system ... 25 5.3 Data Collection ... 28 5.3.1 The Antwerp depot ... 28 5.4 Operations in Antwerp ... 31 5.4.1 Oil transfers ... 31 5.4.2 Blending stored oils ... 31 5.4.3 Inline blending ... 32
5.5 Nynas ships ... 32 5.6 Demand ... 34 5.6.1 Truck lifts ... 37 5.6.2 Boat lifts ... 38 5.6.3 Drum lifts ... 38 5.7 Oil data ... 38 5.7.1 Base oils ... 38 5.7.2 Blend oils ... 39 6 The simulation model ... 41 6.1 Extend overview ... 41 6.2 Concept of time in the model ... 41 6.3 Simulation order ... 42 6.4 Detailed description of the model ... 43 6.4.1 Replenishment manager ... 43 6.4.2 Truck demand manager ... 44 6.4.3 Ship demand manager ... 46 6.4.4 Drum demand manager ... 48 6.4.5 Ship manager ... 49 6.4.6 Ship loading manager ... 50 6.4.7 Ship unloading manager ... 51 6.4.8 Thirteen tanks ... 52 6.5 Input data ... 52 6.5.1 Tank data ... 53 6.5.2 Boat Data ... 53 6.5.3 Filling station data ... 54 6.5.4 Drum data ... 54
6.5.6 Oil data ... 54 6.5.7 Demand data ... 55 6.6 Visual interface ... 55 6.7 Reports generated by the model ... 56 6.7.1 Filling station utilization ... 56 6.7.2 Boat data ... 56 6.7.3 Lift data (trucks) ... 56 6.7.4 Inventory levels ... 56 6.7.5 Inventory level drums ... 56 6.7.6 Replenishment orders ... 56 6.7.7 Lift data (boats) ... 56 6.7.8 Lift data (drums) ... 57 6.7.9 Backorders ... 57 6.8 Test and verification ... 57 6.8.1 Testing the modules ... 57 6.8.2 Testing the entire model ... 58 6.9 Calibrating the model ... 61 6.9.1 Issues when setting R and Q ... 61 6.9.2 Setting the reorder point ... 61 6.10 Setting the batch size ... 63 6.10.1 Setting the reorder point modifier ... 63 6.10.2 Other issues ... 63 6.11 Designing tank setup ... 64 6.12 The 2008 setup ... 64 6.12.1 Simulation process ... 65 7 Scenarios ... 67
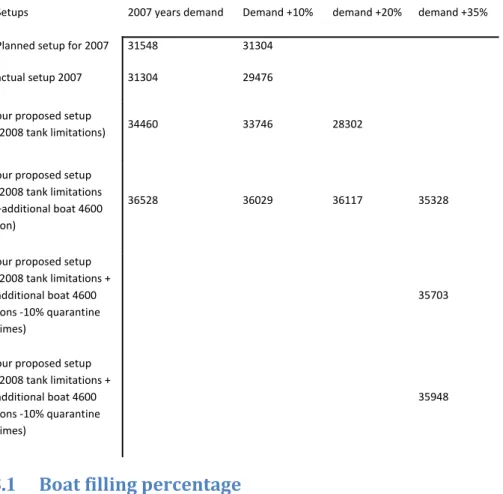
7.2 Scenario 5‐7 ... 67 7.3 Scenarios 8‐11 ... 67 7.4 Scenarios 12‐13 ... 67 7.5 Demand ... 69 7.6 Setups ... 70 8 Results ... 71 8.1 Boat filling percentage ... 74 9 Analysis ... 77 9.1 Scenario 1‐4 ... 77 9.2 Scenario 5‐7 ... 77 9.3 Scenario 8‐11 ... 78 9.4 Scenario 12‐13 ... 79 9.5 Scenario 14‐18 ... 79 9.6 Impacts of quarantine times ... 80 10 Final thoughts and conclusions ... 81 11 References ... 83 11.1 Literature ... 83 11.2 Figures ... 84 11.3 Tables ... 85
1 Introduction
1.1
Problem introduction
Nynas Petroleum has recently made a radical change in their production slate for naphthenic special oils. After extensive research and development Nynas introduced a new generation of transformer oils, called Nova grades. These grades have been developed to meet tougher operating conditions that the new generation of transformer faces. The benefits are good oxidation stability and improved performances in terms of less copper corrosion. Both which have a positive impact on transformer lifetime expectancy and maintenance cost. During the introduction phase older products have gradually been removed from the market. The previous generation of transformer oils contained mainly ingredients that were produced in Nynäshamn and therefore it was natural to blend these at the Nynäshamn facility and then transport them to the Antwerp distribution depot. The new generation is blended, partly of oils from Nynäshamn and partly from other refineries. This has pushed the blending operations down to the Antwerp depot. This has made the planning operations for the supply chain department more complicated. Nynas is experiencing high demand for their naphthenic products at the moment. This puts the company in a position where they in many cases can sell more products than they can produce. Even with the high current demand Nynas is anticipating a large volume increase in the forthcoming years. This will put additional stress to the European Supply Chain, especially the Antwerp distribution hub. Altogether Nynas find themselves in a position where they need to question the infrastructure of their European supply chain. Especially the setup of the Antwerp hub needs to be examined in order to find out where capacity improvements are necessary.1.2
Purpose
The master thesis consists of three parts. The first part is examining the factors that affect the performance of the Antwerp hub (i.e. number of stock outs, service level,average storage levels etc.). In the second part we are developing a simulation model over the European supply chain with focus on the Antwerp depot. In the third part we are simulating a number of scenarios to examine the effects of increased sales volumes and different investments to improve capacity. With help of the simulation model a proposal for how the hub should be set up for 2008 will be created.
1.3
Directives
The directives for this master thesis are to build a simulation model of the European supply chain focusing on the hub In Antwerp. The model should be a good enough representation of reality so it could be used to compare different investment proposals. A proposal for the setup for 2008 will also be produced.1.4
Constraints
Since we only have a limited time period to undertake this master thesis some constraints are necessary. The simulation model will focus on the Supply chain connected to the Antwerp facility. Other depots and production facilities will not be included. A constraint in number of products used will also be included. There are also numerous delimitations in the simulation model. These will be described in more detail further on.1.5
Target group
The target group for this Master thesis is first and foremost Nynas Petroleum and especially its supply department. The thesis should also serve as a guide for management when they discuss the need for future capacity investments at the Antwerp hub. Secondly this thesis is intended for other students at university level with an alignment towards supply chain management and simulation in particular.2 Nynas
2.1
Nynas history
The origin of Nynas can be traced to the later parts of the 1920’s when Charles Almqvist and consul‐general Axel Axelsson Johnson started Sweden’s first oil refinery in Nynäshamn. In 1928 the first shipment of crude oil was delivered from America to the newly built refinery. After Nynas was established by Axel Axelsson Johnson in 1930 the company began building a national network of petrol stations (Nynas Petroleum u.d.). Nynas played an important role in the domestic supply of oil substitutes during the Second World War. By using supplies of coal tar and wood tar, which both could be found domestically, Nynas could continue to produce oil products. After the War the demand for Nynas products increased dramatically due to the rise of private motoring and the many road construction projects undertaken. These developments lead to an increase in the total number of gas stations and the opening of Nynas second refinery in 1956 (Nynas Petroleum u.d.). During the 1960’s the company expanded continuously with the ambition to become a national integrated oil company. Besides fuels and bitumen the company also sold lubricants and solvents. The oil crisis during the 1970’s showed that Nynas was too small to compete with larger international oil companies in the gasoline and diesel market. This forced the company to change direction and focus on special products. Nynas sold its network of petrol stations to Shell Sweden. Nynas quickly transformed from a traditional oil company to an international player focusing on naphthenic oils and bitumen. During the 1980’s Nynas increased its production capacity by acquiring a refinery in Antwerp and undertaking major investments in Nynäshamn. In 1986 the state owned Venezuelan oil company Petroleos de Venezuela (PDVSA) acquired 50 % of the Nynas shares. The final owner structure was established in 1989 when the Finnish company Neste acquired the remaining stocks (Nynas Petroleum u.d.).2.2
Nynas today
2.2.1 Organization The parent company of the organization is AB Nynas Petroleum which is situated in Sweden. Under this company lies a group specializing in producing and selling specialty oil products. This group is divided into different departments handling manufacturing, naphthenic, bitumen UK and continental and bitumen Nordic. 2.2.1.1 Supply chain organization The supply chain department at Nynas is divided in four divisions; crude, bitumen, naphthenic specialty products and planning and optimization. Responsible for these divisions is the supply chain director, Simon Day who reports directly to the president, Staffan Landström. Figure 1 ‐ Organization schedule over the Supply Chain Department 2.2.2 Vision To become successful as a small specialized oil company competing in a world where large oil companies dominates the markets it is important for Nynas to have clear visions and objectives. They must aim high in terms of customer satisfaction, have a modern product portfolio, outstanding quality and extraordinary service. Nynas hastherefore stated a vision, which is spread within the company. The vision is stated as the following: "Through the world‐class dedication of our people, Nynas will be the best long‐term partner in specialized oil applications, doubling the business every five years”. (Nynas Petroleum n.d.) 2.2.3 Nynas Bitumen As mentioned earlier Nynas have been a supplier of bitumen for about 75 years. Bitumen is mostly used as a binding component in asphalt but can also be used in roofing felts and insulation. Bitumen is one of the heaviest components that come out of a refining process. Nynas delivers bitumen all over Western Europe including the Nordic and the Baltic markets. Nynas is the leader of bitumen supply in Sweden and Norway with over 95% of the market. To secure its position in the future Nynas acquired one of the leading bitumen emulsion manufactures in Sweden in 2007. Nynas is also distributing bitumen in the U.K. with separate refineries in Hull and Dundee (Nynas Petroleum 2007). When Nynas refines its crude oil about 70% of the outcome is bitumen. The additional 30% is split evenly between naphthenic oils and fuels. An illustration of this can be seen in Figure 2. This can be compared to a “normal” oil company where 96% of the outcome is fuels. The big difference in output depends on what oil is used as a base. The oil found in the Middle East is excellent for fuel productions while the oil found outside Venezuela is better suited for bitumen production. Modern large‐scale refinery’s can make fuel from the heavier output such as naphthenic oil in a process called cracking.
Figure 2 ‐ Comparison between Nynas and a traditional oil company (Nynas) 2.2.4 Nynas Naphthenic Nynas Naphthenics are one of the world leaders in naphthenic specialty oils and the business grows with about 20% per year. Nynas delivers naphthenic oils to companies in the electrical, lubricant and chemical industry around the world. The naphthenic oils are divided into three groups depending on their use. The three groups are; base oils, process oils and transformer oils. Base oils are used as cutting and grinding fluids, industrial lubricants and grease. Process oils are used in applications such as explosives, fertilizers and tires (as a supplement for the forbidden HA‐oils). The tire industry is a relatively new business for Nynas with potential to sell large amounts of process oils in future years. Transformer oils are mainly used in transformers as insulating and cooling elements. The characteristics of naphthenic oils make them an excellent choice in transformers. They have low viscosity at high temperatures and high solvency at low temperatures, which means that their characteristics are static as temperature shifts. The naphthenic division has sales offices in all parts of the world. They are represented in Africa, Asia, Australia, South and North America and Europe. To shorten lead time for their customers Nynas rents depot space in most locations where they have sales offices and on some additional locations as well. Totally Nynas has 23 depots with 182 tanks available around the world. (Nynas Petroleum 2007)
2.2.5 Naphthenic Supply Chain Nynas supply chain department is centralized to Johanneshov, Sweden with an additional office in Houston, US that is responsible for the South and North American market. Although most supply personnel are situated in Johanneshov they are in contact with the other sales offices, depots and refineries on a daily basis. Nynas claim that the closeness to their customer (sales offices) and sources are of crucial importance to gain “supply excellence” which is what they strive for. This goal is set but a bit hard to define. The overall goals are to guarantee deliveries of agreed volumes in the most cost effective way. This is made possible by: • Predictable deliveries • A cost efficient supply chain • Transparency in delivery costs In 2006 Nynas shipped 666.652 tons of naphthenic specialty oils in 196 shipments around the world. This year Nynas changed their product line and introduced a new line of transformer oils called “Nova Grades”. Before these were introduced the transformer oils were blended in Nynäshamn and then shipped to the depot in Antwerp. After the introduction the blends are made in the hub in Antwerp. The new grades have components that are shipped in from Curacao and Houston and because of this Nynas found it better to blend these grades in Antwerp and through that minimize transport costs. The new structure has made the hub in Antwerp more difficult to operate in an efficient way. The majority part of the products in Antwerp comes from the refinery in Nynäshamn. As the naphthenic products come out of the same crude oil as the bitumen it is important to co‐operate the naphthenic and bitumen supply departments. Different crude oils give different blends and qualities of naphthenic oils and bitumen. The two supply departments meet every month to make sure that both parts are up to date with the production plans and crude oil purchases (Nynas Petroleum 2007). A bottleneck is the insecurity in the crude oil deliveries from Venezuela. The political (in) stability in Venezuela is a serious issue for Nynas, which receives a majority of its crude oil from oil fields in Venezuela. As mentioned earlier fifty percent of Nynas is owned by PDVSA, which is controlled by the government in Venezuela. Negotiations
are currently held with PDVSA to secure deliveries in the next few years and parallel with this new crude oil sources are contracted to diminish the dependence on Venezuelan sources. Additional sources of supply will be needed to cover the expected future growth in sales. In addition to this, new partners with naphthenic oil production are contracted. These partners are often fuel producers who do not see naphthenic oils as their core business. This means that Nynas can expand its naphthenic sales without investing in expensive production facilities. The contracted companies’ oils are laboratory tested to see in which recipes they can be implemented without changing the end products chemical characteristics. It is important that the changes in recipes can be made without any changes of the end product to avoid spending time to sell in new products to existing customers. If the new recipes have other characteristics it might be possible to create and launch new products if there is place for them in the market. 2.2.6 Production Nynas main production utility is the refinery in Nynäshamn, which was built as early as 1928. Through the years the refinery has been upgraded and modernized and is now specialized in production of bitumen and naphthenic oils. The utility is running 24/7 all year round except for maintenance which is required every other year. Added to this are unforeseen breakdowns such as the fire in a hydrogen treater in 2006 and other malfunctions. As mentioned earlier Nynas sells all the products they are producing and could probably sell even more if the production capacity was higher. This means that every stop in the production is extremely costly and results in large profit losses. The supply chain has an important mission, to make sure that production facilities have the correct level of the right crude oil at the right time. If the facility would run empty it would take several days to get it restarted again and this would of course render large financial losses.
3 Methodology
3.1
Introduction
Methodology is important to ensure that a scientific paper holds the quality that is required in order to appear trustworthy. There are several different methods to ensure this in the theories around methodology. In this chapter we will briefly take the readers´ through some of the most commonly used terms around this subject. In the end of each section we will explain which method we chose to work according to and the reasons why we chose this, subject to the conditions in our project.3.2
Scientific approach
The scientific approach on methodology is historically divided into three different groups; the analytical approach, which is the oldest, the systems approach and the actors approach. In addition to these you can divide the examiners into those who seek to explain reality and those who seek to understand it. These two groups are commonly named positivists and hermeneutics. The figure below is a guide to how the different approaches relate to each other.3.2.1 Analytical approach The analytical approach means that a result can be seen as a sum between the parts it consists of. If the examiner can find all parts that will sum up to the result it is Actors Analytical Systems Explaining knowledge Positivism Understanding k l d Hermeneutic
possible to sum these parts and get the solution to the task (Arbnor and Bjerke 1994, 65‐66). The approach is presuming that reality is independent. The examiner strives to distinguish objective and subjective facts and only take the objective facts into consideration. Things that are invariable are seen as more true than those that change according to the environment around them (Arbnor and Bjerke 1994, 97). An illustrative example of the analytical approach can be described as a football team where the coach forms the team by selecting the players that are the best at the time in each position. No consideration is taken to how they cooperate with each other; only their current form is considered (Arbnor and Bjerke 1994, 66). 3.2.2 Systems approach The systems approach is different from the analytical approach in the way that the sum of the parts does not add up to the solution. The reason is the synergic effects that exists between the parts, when you add the parts up the sum might be larger or smaller than the expected sum i.e. 1+1=3 (Arbnor and Bjerke 1994, 67). If we yet again refer to the football example the coach would choose the team where the players that, when playing together, adds up to the best team available at the moment. Therefore some of the best players can be left out of the game because they cannot cooperate with the others (Arbnor and Bjerke 1994, 67). According to the systems approach the examiner can use the entirety to explain and understand the parts of it (Arbnor and Bjerke 1994, 67). 3.2.3 Actors approach The actors approach means that the characteristics of the parts are used to understand the entirety. This approach works out of the social aspects of the issue. In the same environment different actors can experience the solution differently. A system of this type is said to be owned by the examiner and she can put her own values into it. Back to the football example once again; if the coach chooses the team by doing reviews with the players and choosing those that are highly motivated or has something to prove and therefore can be considered to do his best in the game the actors approach is chosen. Another coach could choose an entirely different team because he might evaluate the players’ motivation in another way.
3.2.4 Positivism and hermeneutism There is a significant difference between those examiners who seeks to explain the reality and those who seeks to understand it. The former are usually called positivists or explanatics and the later are referred to as hermeneutics. The positivists decline that there is a difference between nature and society sciences. If one method can be used on nature science it can be used on society science projects without any changes (Arbnor and Bjerke 1994, 62‐63). Positivists would like all hypothesis and theories to be described as mathematical formulas and that the research should be performed according to the hypothetic‐deductive model. That is that the research should start with the theory and test the theories with empirical methods (Patel and Davidsson 1994, 24). Positivists work on the principle of reductionism which means that the problem can be divided into many smaller problems that can be solved independently to find the solution to the original problem (Patel and Davidsson 1994, 23). This is a very clear connection to the analytical approach discussed earlier. Another important thing is that the examiner is interchangeable and another examiner can take over in any phase and the result of the study would be the same (Patel and Davidsson 1994). The hermeneutics on the other hand consider the methods used in nature science as totally unsuitable in research for social sciences (Arbnor and Bjerke 1994, 62‐63). The hermeneutics seeks to understand the problem and approaches the problem with subjective thoughts in mind. The examiner tries to find connections between the entirety and the different parts. By approaching the problem from different angles they find an understanding about the problem (Patel and Davidsson 1994, 26‐ 27). 3.2.5 Our approach In this study the systems approach has been used. The reason is that we believe that in this study the interactions between different parts of the supply chain are important. The discussions in the beginning of the study showed that the interactions between the different parts are very important and a small change in one factor can change the whole supply chain drastically. By using the systems approach both the understanding and explaining knowledge can be used. The use of both these approaches is important as the thesis will be carried out both through studies of computer material from the ERP system and from dialogs with personnel at Nynas.
3.3
Research approach
To produce theories the examiner needs to relate it to reality, the empirics. There are two ways two connect these two, deduction and induction. Deduction is also called the proving way. When taking this path the examiner use general theories to prove a hypothesis. He uses theory as a base and then tries to apply this on the hypothesis. If the assumptions are correct the hypothesis is proved and can be used to build the theory. If the examiner chooses to precede his work according deduction it comes with a focus on the working method base (Patel and Davidsson 1994, 20). Induction on the other hand is called the discovering way. In this case the examiner uses separate events to assign a theory. The examiner finds the information that he wants to collect and examines the data and constructs a theory according to this. When using the inductive way the work is not as focused on the method as it is when using deduction. In this case the answer the examiner is giving to his or her problems is in focus. The scientific quality of the work depends on the patterns which are traceable in the gathered information(Patel and Davidsson 1994, 20‐21). Figure 3 ‐ Picture of the relations between theory and reality (Patel and Davidsson 1994) modified by the authors
3.3.1 Our approach The research approach used for this study is the abductive approach. When using abduction you can shift between different levels of abstraction as the master thesis work is evolving (Björklund and Paulsson 2003, 62). In our case we will start by study reality to get an overview of the situation and the problem. After that we’ll study theories to see which ones that can be used and then we will gather actual data to build our model with the theories in mind. As the simulation model grows the connection between the empirics and the theories will be regarded at all levels.
3.4
Data gathering
3.4.1 Validity and reliability In what extent the measurements have been concluded accordingly to the chosen subject is called validity. If the study can be performed again with the same instruments and still obtain the same results the reliability is said to be high (Björklund and Paulsson 2003). A simple illustration of validity and reliability can be seen in Figure 4. The leftmost illustration shows an example with both low reliability and low validity. The spread is large and the accuracy is bad. The middle figure shows an example with high reliability but low validity. In this case the spread is small but the accuracy is still bad. The rightmost illustration shows an example with both high validity and reliability. In this case there is a low spread and good accuracy. A way to increase the validity of a study is to make questions in questionnaires as objective as possible. a b c Figure 4 ‐ Illustration of validity and reliability (Björklund och Paulsson 2003)To increase the reliability of the study the examiner can use multiple methods that all shows the same results. 3.4.2 Qualitative and Quantitative data Quantitative data gathering is performed through searches in databases and ERP systems to find for example sales data over time, volumes, profit, and so on. As the company’s auditors verify the data it can in most cases be seen as objective and trustworthy. The data represents actual events in the company’s history. Qualitative data is collected through interviews or questionnaires with people with knowledge of the subject. This often gives a deeper understanding of a specific subject or situation (Björklund and Paulsson 2003, 63). There are several important issues to consider when collecting qualitative data. People tend to be subjective by nature and in order to decrease this bias it is of great importance to do several interviews with different people to confirm details and double‐check facts. By doing multiple interviews the information can be confirmed and viewed as reliable. When making an “eye‐to‐eye” interview the interviewer can also read the body language and get additional information out of that (Björklund and Paulsson 2003, 70). When an interview guide is designed the interviewer must consider that the questions are not leading in any way. The interview guide must be neutral and objective of its nature to give the interviewee a chance to answer as correctly as possible.
4 Theory
4.1
Inventory management
Inventories are held in all parts of the supply chain from raw materials, work in progress to finished products. There are several reasons to hold stock i.e. • Create buffers against uncertainties in supply and demand • Transports of larger volumes can be done at a lower cost per item • Producing large batches gives a lower production cost per item To be able to minimize the inventory levels there are several functions where uncertainty needs to be minimized. Forecasts must become more accurate, sales information and forecasts should be shared with suppliers, production variation should be reduced, and the differentiation of products should be moved downstream in the supply chain. Although these steps are carried out there might still be substantial uncertainties left in the system. All uncertainties can never be entirely reduced and inventories will be required as a buffer for these. Holding costs, shortage costs, replenishment delays and probabilistic demand distributions for products are all parts of the inventory management problems (Shapiro 2001, 477‐ 478).4.2
Inventory costs
To understand how the different ordering systems work it is necessary to have some basic knowledge about the cost associated with holding stock and transporting goods. The reason why you cannot hold infinite stock is quite clear; the capital tied up in stock could be better utilized in other ways. Then we need to know how to find the optimal stock level. The optimal stock level is the level at which customer satisfaction can be guaranteed at a minimum cost. Generally you consider three costs when you determine the size of your inventory. These costs are; holding costs, ordering costs and shortage costs (Axsäter 2006, 43‐46). Holding costs are costs related to the physical holding of the products. It includes for example warehousing, material handling, damage and insurance. These costs are all variable costs and are closely tied up to a separate unit of the product. Fixed costs that do not origin directly from the products should not be considered (Axsäter 2006, 44).Ordering costs on the other hand are costs that can be directly associated to a single replenishment order. This cost is fixed no matter how big or small the order is. Examples of ordering cost are filling out order forms, receiving, and handling of invoices (Axsäter 2006, 44‐45). Shortage costs are costs that occur when a customer have ordered a product which cannot be delivered to him on time. These costs are difficult to estimate. The customer can choose either to wait for his order to arrive, which would cause the company small or no shortage costs depending on if the customer is still satisfied. The customer might also choose another supplier and might not return. These costs are not tangible and could for example be loss in good will, which is very hard to estimate a price on. Service levels are often used as a substitute for shortage costs. Even if these are not easy to put a price on they are often more straight/forward than shortage costs (Axsäter 2006, 45).
4.3
Ordering systems
In ordering systems the physical stock level is not the only thing to consider before sending a replenishment order. To know when and how much to order you must know how much has already been ordered and is on route between supplier and warehouse. These are called outstanding orders. Another issue to consider is the backorder log i.e. the number of orders that have been placed but not delivered. When you put these three aspects together you get the inventory position according to the following formula (Axsäter 2006, 46): Holding costs and shortage costs however are derived out of the inventory level (Axsäter 2006, 46): There are two different ways to investigate the inventory levels; continuous review and periodic review. If continuous review is used it means that the inventory level is updated continuously and orders are made as soon as a certain level is passed (this level is called the reorder point, R). When an order is laid the time until the products are in stock is called lead time and often denoted L.Periodic review means that the inventory level is read at certain predetermined interval (the interval is denoted with T). This means that the reorder point, R, must be slightly higher than on a continuous review system because the review period is added to the lead time as an uncertainty. Periodic review is mainly used on articles with high demand and is also preferred when synchronization of orders is required. Continuous reviews are best applied on articles with low demand due to the costs of running an inventory control system (Axsäter 2006, 47). One of the most commonly used ordering systems is the (R, Q) system. The basic principle is that when the inventory position sinks below a certain point, R, the quantity Q is ordered. If demand between the inspections is higher than anticipated it might be necessary to order a quantity n*Q to get the inventory position to a point above R. If a continuous review system is used the inventory position will become R+Q when an order is triggered. If a periodic review system is used it is likely that the level R+Q will not be reached as the inventory position at the time for review often will lie below R. Another commonly used ordering system is the (s, S) policy. In contrast to the (R, Q) policy, the ordered quantity is not fixed. When the inventory position drops below the reorder point, s, an order is triggered that set the inventory position to S. No matter how far below s the inventory position is the order‐up‐to level is always S. If continuous review is applied the (s, S) and (R, Q) policies perform similarly. With a Inventory Inventory position L R R+Q Time Q T Figure 5 ‐ (R, Q) policy with periodic review (Axsäter 2006, 48), modified by the authors
small modification on the (s, S) policy we can achieve the S policy or base stock policy. In this policy there is no reorder point but orders are triggered up to S at every inspection as long as the demand during the time between reviews is greater than zero (Axsäter 2006, 49‐50).
4.4
Service levels
Service levels are a quite easy way to determine reorder points or safety stocks. Three different definitions are usually considered S1, S2 and S3. S1 is calculated as the probability that there are no stock‐outs during an order cycle. That is the probability that a replenishment order arrives before the inventory has gone empty. This is the simplest variation to the service level definition but also the one with the most uncertainty. Depending on size of the ordered batches it can give probabilities that are not even close to the actual service level. With a small batch size it is easy to overestimate S1 and with large batch sizes it is easy to underestimate it (Axsäter 2006, 94‐95). S2 is the fraction of time when orders can be delivered immediately from stock and is also called “fill rate”. Tim Inventory Inventory L s S T Figure 6 ‐ (s, S) policy with periodic review (Axsäter 2006, 50), modified by the authorsS3 is called “ready rate” and is the fraction of time when the physical stock is larger than zero. These two service levels are the same if the demand is continuous or Poisson distributed. Although this is not true if customers orders several units per order, as stock on hand can be positive but still the order can be larger than the sufficient stock. (Axsäter 2006, 94‐95). Demand often grows rapidly as service levels increases from a low level. Although, as service level comes closer to 100% the demand is not increasing as much. This can be seen as the S‐shaped curve in Figure 7. In most markets a certain service level is required to be able to collect market shares. This can be seen as the lower left part of the S‐curve, as this level is passed demand increases up to a level where the marginal utility starts to decrease and the curve flattens out. As this happens demand will not rise with the same intensity as before this level was reached (Mattsson, Effektivisering av materialflöden i supply chains 2001). Where this level is situated is linked to the service levels of the competition in the market. The conclusion is that a company should strive to maintain a service level that is slightly higher than its competitors. The cost of increasing service level is higher as the service level comes closer to 100%. The cost of increasing service level is not linear as the service levels rise. This Figure 7 ‐ Connection between demand and service level (Mattsson, Effektivisering av materialflöden i supply chains 2001)
is linked to the cost of the tied up capital in the system, which is increasing faster as service level comes close to 100%. A visualization of this can be seen in Figure 8. The optimal service level would be the one where the difference between the benefit of the service level and the cost of that service level are at its maximum. Figure 8 ‐ Costs vs. benefit of increased service level (Mattsson, Effektivisering av materialflöden i supply chains 2001)
4.5
Transport and carrying devices
Transport of physical goods are conducted in four different ways; sea, rail, road, and air. For each and one of those there are several different types of vehicles that can carry the goods. For example can road transports be carried out by large trucks, small cars, and in many other ways (Mattsson och Jonsson, Logistik ‐ Läran om effektiva materialflöden 2005). Different types of transportation have different characteristics, which makes them suitable for different types of goods. 4.5.1 Boats Vessels are the most commonly used transporting device for bulk products on long distances. The only competitors on long distances are pipelines and railway. Thereare pros and cons with the different methods. Vessels have the disadvantage that they only can ship products where there are harbors to unload oil in. On the other hand are pipelines and railways expensive to build and hard to change once they are built. Tankers also have an advantage that they can be used on different routes around the world whereas pipelines and railways are fixed to where the infrastructure is built. Vessels have the lowest cost per ton km in almost all cases (Mattsson och Jonsson, Logistik ‐ Läran om effektiva materialflöden 2005). A ship takes approximately 20 hours to load depending on the pump equipment in the harbor and the number of different compartments that are used in the boat. When unloading, the boats own pumps are used and in most cases the unloading takes longer time due to lower pump capacity on board. In general the unloading procedure takes twice the time of the loading procedure. 4.5.2 Trucks When it is time to send oil out to customers, trucks are usually the best choice. Their flexibility is the main advantage and customers can get the oil to the exact locations they want it. Truck transports can be used for almost all goods but tend to have a cost disadvantage against rail and sea transport as it comes to low value goods. Another disadvantage that often is discussed today is the environmental issues compared to rail freight (Mattsson och Jonsson, Logistik ‐ Läran om effektiva materialflöden 2005). The capacity of the trucks is between 22 and 28 tons depending on how they are equipped.
4.6
Drums and containers
Before the introduction of tank ships, barrels were the most common way to transport oil. Still the 42 US Gallon barrel is the main pricing unit of crude oil in the market. Drums are nowadays used as carriers when there are no other ways of storing liquid material or if they are transported to remote locations where smaller amounts of oil is needed. The most common size of drums today is 208 liters (55 US Gallons). Oil storing barrels made of steel is most common. In some cases plastic barrels might also be used. Often the barrels have ribbings on the outside to strengthen them against pressure damages.
5 Empirics
5.1
Mapping the Nynas supply chain
This thesis is concentrating on the third part of the logistic pipeline, the distribution (see Figure 9). The two preceding parts are not included. Even though they have a large impact on the Supply chain performance as a whole it is not desirable to include them in the simulation model. The reason for this is that the disturbances generated further up in the supply chain would make it harder to evaluate the distribution part. In order to compare scenarios it is important to keep the prerequisites equal among the scenarios. In this case all activities concerning crude oil purchase and transportation as well as the refining process are left out. The distribution in this case begins with transportation of products from the production facilities. There are two major components that affect the performance of the distribution. First we have the physical layout of the distribution system. Secondly we have the different activities in the distribution system. 5.1.1 Physical layout All activities in the supply chain are limited by the physical setup of the Antwerp hub. There are limitation in tank capacity, transportation capacity and customer lifting capacity. In order to increase capacity major investments are necessary. Since there is a long planning horizon for such investments the infrastructure will be considered fixed. All activities must therefore be contained within the existing setup. The infrastructure of the supply chain will be investigated in further detail in the data collection chapter. Production Distribution Raw Materials Customer Supplier Throughput time Figure 9 ‐ Logistic pipeline5.1.2 Activities in the supply chain There are three different concepts that affect the distribution in the supply chain. They all have a direct influence on the service level Nynas can provide for its customers. In order to understand these concepts and their roll in Nynas supply chain each of them will be examined in detail. • Lead times • Demand • Inventory 5.1.3 Lead times Because we only focus on the third part of the logistic pipeline the lead time will in this case be the time between a replenishment orders is issued until it is available to the end customer. In Nynas case lead times can be split down into three components. The first component corresponds to the time it takes for a replenishment order to be loaded onto a vessel. In order to load onto a vessel a ship needs to be present at the quay connected to the refinery. The ship must also have available capacity. If several replenishment orders are issued in the same time span orders might have to be prioritized. This could lead to a situation where orders have to wait for another vessel to arrive. The second part of the lead time corresponds to the actual transportation time between the refinery and the target destination. This time is dependent on the vessels average speed and weather conditions. The third part corresponds to the quarantine time. Even though all components for a blended oil are available it does not mean that the blend is available for the customers. The oil might be stored in order to perform quality testing. 5.1.4 Demand The variation in demand plays a major role in the supply chain. At the Antwerp facility there are two types of demand. There are internal demand, which consists of shipments to smaller depots around the world and external demand, which corresponds to external customers. The demand by external customers is of three types, namely truck, boat and drum lifts. The demand will be examined further in the data collection chapter. 5.1.5 Inventory The third part that plays a major role in the supply chain’s ability to maintain a high service level is inventory. In Nynas case inventory consist of several large tanks. This
is a special situation since each tank can only hold one product. In an ordinary inventory each product can be stored on shelves independent of what other products are stored around them. Since each tank only can hold a single product it is harder to keep a high utilization of the inventory capacity. There are two main parameters that affect the average inventory in the system. These are the reorder point and the batch size. These parameters will be examined in the data collection chapter.
5.2
Nynas replenishment order system
The responsibility for replenishment orders to the facility in Antwerp lies on the supply chain department in Johanneshov. The main responsibility lies on the “supply planner Europe” who controls oil inventory and is the link between the refineries, the shipping agency, the Antwerp hub, and the sales department. The main control tool for this job is an Excel‐sheet where all Nynas base oils are included. Underlying this sheet is a number of other sheets and calculations. The basic sheet is one where all oils that are being sold by Nynas are included. In this sheet the different sales departments insert their sales forecast for the next three months. The sheet is being updated every month to give better accuracy. The sheet can then be crunched down to the base oils that are produced at the refinery. The sheet is used to see how much base oils that needs to be produced, how much that needs to be transported to Antwerp to avoid running out of stock and when blending of oils are planned. An example of how an Excel sheet can look like can be seen in Figure 10.Figure 10 ‐ An example of a planning file In the next few paragraphs we will explain how the order planning in the Excel sheet works. The first column is the date and the next illustrates what date a certain boat will arrive. The third column shows how much oil the ship will carry to Antwerp and the fourth is how many different oils that will be on the specific shipment. After this the oil’s specific fields come. There are different numbers of fields depending on the oils different supply patterns. The first oil is a basic oil where there are only three fields. The first field represents deliveries to Antwerp. This has impact on the second field, which is the inventory level in Antwerp. This column represents the lifts on trucks and drums and is calculated from the forecast. The third field is where the planner puts the boat lifts when one is planned to come. This also affects the inventory level. When the inventory level is red the planner knows that he must put a delivery earlier to cover demand. He must then check if there are any changes he can do to get a delivery on an earlier boat and if the oil is available at the refinery at the earlier time. The second oil (NS8) has an extra column where it says “Out N10XT”. This column is for planned lifts of an oil that is NS8 only with a small addition of a chemical substance. These are not made as blends but are mixed straight into the transport vehicle of choice.
The fourth oil in the table (T9) has more attributes than most oils have in this planning file. Excessive of those of the first oil it also has fillings from Isla, which represents deliveries from the refinery in Curaçao. In the column after the forecasted inventory there is also a field where lifts for blends are scheduled. When the planner schedules a blend of oil the components required volumes automatically shows in this field for each oil that is included in the blend. In some cases oil can also have fields for deliveries from other refineries and depots such as Houston and Hull. The reason that large volumes lifted by boats are handled separately is that they are different from truck and drum lifts in many aspects. The demand for truck and drum lifts can be seen as evenly spread between the replenishments. They are calculated as the monthly forecast divided by the number of available lift days in the month. The boat lifts on the other hand are very irregular in both time between arrivals and order size. The boat lifts are also known longer in advance than the other lifts and can therefore be planed better. The tricky part in the planning is to make sure that all oils are covered at all times. Nynas current situation with high demand makes this very difficult. Almost all oils are stressed at all times and the planner needs to prioritize between oils in order to make sure the most important oils are delivered on time. In some cases negotiation with customers can be held and it may turn out that they can wait a couple of days extra before they receive the oil. Maybe the customers can receive two smaller deliveries of oil with a few days between the deliveries. If there are no possibilities to change any of the deliveries Nynas might be forced to prioritize between customers. This might be the case for long distance shipments where boats are booked months in advance and there are no possibilities to change the terms. Orders of this kind are always prioritized as the demurrage fees Nynas has to pay if an oil is not lifted to the boat on time are huge. In cases of prioritizing there is a certain risk that a customer feel ignored and Nynas reputation is negatively affected. The planning of shipments are made in co‐operation with the refinery in Nynäshamn and the ship‐booking agency Nyship. Flawless communication between those departments is a major component for successful operations. The refineries inventory levels and production plans are studied continuously to see if oil deliveries to Antwerp have to be rescheduled in order to make sure the most
essential oils are shipped. Discussions with the production department can lead to production plan changes that can enhance the performance of the Antwerp hub without making too much impact on the refinery’s production yield. Nyship controls the boats and has full overview over this part of the supply chain. The supply planner checks with Nyship which volumes are booked, how much available volumes there are on the ships and how many compartments that can be used. Nyship also handles the contact with harbors and books unloading and loading slots for the ships. If the supply planner needs more information about departure and arrival times Nyship is the information source.
5.3
Data Collection
5.3.1 The Antwerp depot As mentioned earlier in this thesis Nynas have 23 depots worldwide. This master thesis is focused on the Antwerp facility, which is the main hub in Europe. The tanks in the Antwerp depot are leased from LBC, one of the world’s largest operators of tank storage facilities for bulk chemical products. Nynas shares the facility with other companies, as they do not have the volumes to fill it up themselves. LBC is responsible for planning and scheduling the depot. Nynas collects orders from customers which are then scheduled by LBC. The same goes for Nynas internal shipments, which must get scheduled lift dates from LBC. There are usually no problems to get slots for unloading replenishment orders arriving to Antwerp. Most of Nynas replenishment orders are shipped on their own boats and they can therefore give LBC information about arrival times relatively long time in advance. The intercontinental shipments are also planned in advance and relatively easy to schedule. 5.3.1.1 Physical equipment Currently Nynas is leasing 55 tanks from LBC in Antwerp with a total capacity of about 70.500 m3 (at a filling grade of 95%) which corresponds to about 62.000 tons of oil (calculated with the medium density of 0.88kg/m3). The 95% filling grade is set because of operational reasons. The size of the tanks varies from 180m3 to about 4.000m3. The smallest tanks have a radius of 3 meters and are 6.5 meters high and the largest tanks have a radius of 9.5 meters and are 14.5 meters high. An overview of the Antwerp depot is pictured in Figure 11. The depot area is approximately 97000m2 (570m*170m).Figure 11 ‐ Drawing of the Antwerp depot (LBC, modified by the authors) The tanks are divided into different tank farms depending on what quay connection they are connected to, and in some cases if they are able to load onto trains. Some tanks are not connected to a quay and must receive oil by transfers from other tanks. An example of a tank farm can be seen in Figure 11. The tanks marked in red to the left are connected to the same quay connection but only the tanks on the bottom half is connected to train loading. This divides the tanks into two different tank farms. The first digit(s) in the tank number explains which tank farm the tank belongs to. Figure 12 ‐ Three tank farms in the Antwerp layout enlarged In Figure 12 an example can be seen of how the tanks are connected to their different truck loading racks. More information about these racks follows further on in the chapter. All tanks in the 100‐ and 500‐series are connected to the S1 quay
connection for filling of the tanks from vessels. The 600‐series are not connected to the quay so they must receive their oil from other tanks or from trucks. When a tank is filled from a ship the tank is blocked from transferring oils to filling racks and other tanks. This is necessary as the level in the tank is measured before and after the filling procedure to control transferred volumes. If they tap oil from a tank that is currently being filled there are obvious risks that the measuring of volumes would fail. The unloading of a ship takes around 20 hours depending on transferred volumes and pump capacity. Nynas has access to 19 different truck loading racks for transfers of oil from tanks to trucks and trains. Each tank is connected to one loading rack (some of the very large tanks are not connected to a loading rack), meaning several tanks share the same rack. Nynas shares the racks with other LBC customers and has approximately 10 slots per loading rack and day available. These slots are planned by LBC to in advance to optimize the hub’s throughput. Since LBC must take several customers into consideration there are sometimes capacity problems for slots. In these cases some of the orders are kept on hold until there are available slots or, in some cases when transports are urgent, LBC personnel work overtime to allow more trucks to load in a single day. Some of the tanks are connected to an inline blender which take oils from different tanks and make blends straight into the truck or vessel. In Nynas case this works on the tanks connected to quay connection S1 (see appendix 2 for information). In this case the pumps are reversed and instead of pumping into the tanks they pump out through the S1 connection. The inline blender is used to make blends that are not stored in Antwerp. When a tank is pumping out to the inline blender it is locked from filling trucks and transfer oils to other tanks. The inline blender can serve about 10 trucks for Nynas every day. The total number of possible slots is something LBC does not share with its customers. Nynas also has the option to drum oils from some of the tanks in the facility. They have currently 26 tanks available for drumming operations of which 6 are transfer tanks that is almost exclusively used for drumming procedures. These six tanks are the smallest in the facility and the reason they use small tanks for the drumming is that they, by transferring oil to these tanks, are able to avoid locking large tanks during the drumming process. These six tanks are not connected to any quay line
and can only receive oil by transfer from other tanks via pipelines or trucks. There are two lines for drumming in the facility, each with a capacity of 400 drums a day which corresponds to about 73 tons oil per day and line. Nynas also keep a stock of drums on certain oils, in order to offer a high service level to its customers. The batch size when making new drums are fairly high since long setup times are associated with the change of oils in the drumming process. Different tanks are also differently equipped when it comes to heating and insulation. Some of the oils require heated tanks to remain at a viscosity that can be handled by the pumps in the system. The heating consists to one part of heating coils in the tanks and to the other part of insulation in walls and roof of the tanks. Some tanks are only equipped with heating coils and no insulation. It is of course more energy consuming to warm a tank without insulation than one with insulation. Measuring tank levels are made either by radar or a servo in the tank.