IZA DP No. 3764
Electoral Participation as a Measure of Social
Inclusion for Natives, Immigrants and
Descendants in Sweden
Pieter Bevelander Ravi Pendakur DISCUSSION P APER SERIES Forschungsinstitut zur Zukunft der Arbeit Institute for the Study October 2008Electoral Participation as a Measure of
Social Inclusion for Natives, Immigrants
and Descendants in Sweden
Pieter Bevelander
Malmö University, MIM and IZA
Ravi Pendakur
University of OttawaDiscussion Paper No. 3764
October 2008
IZA P.O. Box 7240 53072 Bonn Germany Phone: +49-228-3894-0 Fax: +49-228-3894-180 E-mail: iza@iza.orgAny opinions expressed here are those of the author(s) and not those of IZA. Research published in this series may include views on policy, but the institute itself takes no institutional policy positions.
The Institute for the Study of Labor (IZA) in Bonn is a local and virtual international research center and a place of communication between science, politics and business. IZA is an independent nonprofit organization supported by Deutsche Post World Net. The center is associated with the University of Bonn and offers a stimulating research environment through its international network, workshops and conferences, data service, project support, research visits and doctoral program. IZA engages in (i) original and internationally competitive research in all fields of labor economics, (ii) development of policy concepts, and (iii) dissemination of research results and concepts to the interested public.
IZA Discussion Papers often represent preliminary work and are circulated to encourage discussion. Citation of such a paper should account for its provisional character. A revised version may be available directly from the author.
IZA Discussion Paper No. 3764 October 2008
ABSTRACT
Electoral Participation as a Measure of Social Inclusion for
Natives, Immigrants and Descendants in Sweden
*Three decades ago, Sweden extended municipal and county voting privileges to non-citizen residents arguing that it would increase political influence, interest and self-esteem among foreign citizens. Three decades later, electoral participation on the part of immigrants is perceived as being substantially lower than for native born citizens and questions have arisen regarding the degree to which this may be symptomatic of a larger integration issue. The aim of this paper is to explore the determinants of voting within the context of social inclusion by comparing immigrants, their descendants and native citizens in Sweden while controlling for a range of socio-economic, demographic characteristics and contextual factors. We use two unique sets of data to conduct our research. The 2006 Electoral Participation Survey contains information on individual electoral participation in national, county and municipal elections. We match this information to registry data from Statistics Sweden which contains socio-demographic information for every Swedish resident. From these two sources, we are able to create a database which matches voting behaviour to individual characteristics for more than 70,000 residents of whom almost 13,000 are not citizens. We find that after controlling for demographic, socio-economic and contextual characteristics, acquisition of citizenship makes a real difference to the odds of voting and is therefore, a likely and powerful indicator of social inclusion. Immigrants who obtain citizenship are far more likely to vote than those who do not. Arguably, some of this may be attributed to the number of years of residency in the country. However, even non-citizens born in Sweden have substantially lower odds of voting. Country of birth also makes a difference. Immigrants from the Americas and those born in Sweden with immigrant parents are more likely to vote than immigrants from other countries. Somewhat surprisingly, age at immigration does not make a substantial difference to the odds of voting.
JEL Classification: D72, J15, J61
Keywords: political participation, immigrants, descendants, electoral participation, human capital, citizenship, social inclusion
Corresponding author: Pieter Bevelander IMER, Malmö University 205 06 Malmö
Sweden
E-mail: Pieter.bevelander@mah.se
Introduction
Voting in free elections is often viewed as the most basic and important form of political participation. As such, the level of participation can be seen as an indicator of how well democracy is faring. On this yardstick, electoral participation in Sweden is high
compared to other democratic countries. Four fifths of eligible voters exercised their franchise in the 2006 national, county and local elections.3
Immigration to Sweden over the last 50 years has been substantial. In 2006, 13 percent of the population, or about 1.2 million individuals residing in the country were born abroad. There are an additional 300,000 people born in Sweden who are the children of immigrants (about 4% of the population). Sweden was one of the first countries to extend local and county voting rights to immigrants with resident status, arguing that it would increase political influence, interest and self-esteem among foreign citizens. Three decades later, electoral participation on the part of immigrants has been shown to be substantially lower than for native citizens (see Öhrvall, 2006). To our minds, this could be evidence of a larger social inclusion issue. Thus, the aim of this paper is to explore the act of voting as a measure of social inclusion by comparing voting probabilities of immigrants, their descendants and native citizens in Sweden after controlling for a range of contextual, socio-economic and demographic characteristics.
We find that after controlling for demographic, socio-economic and contextual
characteristics, acquisition of citizenship makes a real difference to the odds of voting. Immigrants who naturalise are far more likely to vote than those who do not. Country of birth also makes a difference. Immigrants from the Americas and those born in Sweden with immigrant parents are more likely to vote than immigrants from other countries. Somewhat surprisingly, age at immigration does not make a substantial difference to the odds of voting. Being born in Sweden, even if parents are born abroad, has a positive impact on the odds of voting. While the odds of voting are lower than for Swedes,
3
. We note that all three elections take place on the same day. This means that the voter turnout is about the same across municipal, county and national elections. The elections of 2006 are particularly interesting because it represents a reversal in the downward trend in electoral participation in Sweden.
people with foreign-born backgrounds who are born in Sweden but have immigrant parents generally have higher odds of voting as compared to those born abroad. Marital status does not have a substantial impact on voting, but having a Swedish spouse
increases the odds of voting by almost half. Owning a house is associated with higher odds of voting as compared to either owning an apartment or renting.
Contextual factors are important. The larger the city, the lower the odds of voting. However the larger the size of the immigrant population, the higher the odds of voting, which suggests that high immigrant populations are not a detriment to voting behaviour. The municipal employment rate is also important – the higher the employment rate, the higher the odds of voting. Foreign-born representation on municipal councils has no measurable impact on voting in any of the models we tested.
Research Question:
Our goal is to assess the degree to which differences in voting probabilities are a product of immigrant status as compared to a set of demographic, human capital and socio-economic characteristics. The primary questions we ask are:
• To what extent do differences in voting participation across immigrant and Swedish born categories exist?
• If there are differences, to what extent are they explained by contextual, demographic and socio-economic factors, human capital attributes and immigration related factors?
• Does the act of extending voting privileges in municipal to non-citizens serve to increase electoral participation and social inclusion?
In order to assess these questions we first provide a basic historical overview of
immigration to Sweden. We then review the literature concerning inclusion and voting participation. With this historical and theoretical background in hand, we then assess the degree to which the probability of voting differs across socio-demographic and
immigrant status in the 2006 municipal elections.
We use two unique sets of data to conduct our research. The 2006 Electoral Participation Survey by Statistics Sweden contains information on individual electoral participation in
national, county and municipal elections. We match this information to registry data from Statistics Sweden which also contains information for every Swedish resident. From these two sources, we are able to create a database which matches voting to individual characteristics for more than 70,000 residents of which 13,000 do not have Swedish citizenship but are eligible to vote in municipal and county elections.
Context Immigration
A bird’s eye view of immigration to Sweden would divide the post-war period into two distinct periods. The first is primarily characterized by labour-force immigration while the second by a shift towards refugee and family reunion intake. The first period began after World War II and ended in the first half of the 1970s. During this time, Sweden's economy expanded rapidly, due in part to reconstruction efforts in neighbouring countries. Labour shortages in Sweden were solved in the 1950s through the import of skilled labour through immigration which served to complement the native labour force. This skilled labour was mainly recruited from North-Western Europe with the majority coming from Western Germany and the Nordic countries.
The 1960s saw a shift in the labour force toward unskilled or low-skilled (often imported) workers. In contrast to their counterparts a decade earlier, these workers were used more as a substitute for the native workforce rather than as a complement. While earlier immigrants allowed the economy to grow in size, the immigrants of the 1960s facilitated a widening of the economy. As they arrived, these new immigrants found employment in jobs vacated by Swedes during the expansion of the service sector. The fact that these newly vacated jobs could be filled by unskilled workers was a result of a massive industrial investment aimed at increasing international competitiveness and reducing costs (Lundh and Ohlsson, 1999). Immigrants now came largely from Nordic countries but also from Mediterranean countries such as Greece, Yugoslavia and Turkey.
By the end of the 1960s, the situation began to change for immigrants. Fuelled by trade unions, the state changed the rules governing entrance into Sweden. The new rules,
implemented in 1968, meant that future applicants for work and residence permits from non-Nordic countries had to apply before they entered the country. Simultaneously, the applicant needed to arrange for both a job and a place to live. This dramatically cut down the labour immigration of non-Nordic countries over the next decades.
Sweden’s economic growth dropped substantially following the oil shock crisis of the early 1970s. As was the case for many western countries, the Swedish economy passed through a period of structural change which saw the decline of the industrial sector and the emergence of a strong service sector. Nordic labour migration, especially Finnish, gradually declined mainly because of a diminishing gap in the standard of living between Sweden and Finland and an increasing demand for labour within Finland. While labour migration dwindled during the 1970s and more significantly in the 1980s and 1990s, other types of migration started to increase. These new groups were predominantly non-economic migrants (family reunification) and refugees. This also led to a major shift in the country of origin mix amongst the immigrant population. In the 1970s, the major contributors to the immigrant population in Sweden were primary refugees from Chile, Poland and Turkey. In the 1980s, the lion’s share of this new immigration came from Chile, Ethiopia, Iran and other Middle Eastern countries. The entrance of Sweden into the European Employment Strategy/European Union (EES/EU) in 1994/1995 resulted in an increase in labour migration of EU citizens. At the same time, refugee and family reunification policies allowed increasing numbers of immigrants from Iraq, the former Yugoslavia and other Eastern European countries (Bevelander, 2004).
Extending the electorate: citizenship and foreign citizens Citizenship:
Citizenship in Sweden is based on the jus sanguinis principle. People whose parents are Swedish citizens are automatically granted citizenship. However, unlike the case of Canada, the children of non-Swedish citizens who are born in Sweden are not automatically entitled to Swedish citizenship. That aside, Swedish legislation on
naturalisation is one of the most liberal in Europe. In 2006, 77 percent of eligible foreign born residents with non-Swedish parents had obtained Swedish citizenship.
Since the 1970s, foreign citizens from most countries over the age of 18 without a criminal record have been able to acquire Swedish citizenship after five years of residency (four years for refugees). Foreign citizens from other Nordic countries can obtain citizenship after only two years of residence.4 Gaining citizenship by notification is also possible. This is basically a simplified juridical naturalization procedure used mainly by Nordic citizens. Acquiring Swedish citizenship by notification is possible if the applicant is eighteen years of age or older, has lived in Sweden for five years and has not been sentenced to prison during this time.
While entrance to Swedish citizenship has become successively easier, there has existed one formal deterrent. Dual citizenship was forbidden in Sweden until July 1, 2001 except in cases where countries did not allow renunciation of citizenship. While many
individuals may see uptake of a citizenship as a fairly casual act, renunciation of a citizenship is much more serious. After 2001, no such demands were placed on applicants (Bevelander, 2006).
4
If the foreign citizen is either under 18 or with a criminal record, there is a waiting period before the applicant can apply for Swedish citizenship.
Electorate:
General elections based on universal suffrage were introduced in Sweden in 1921 when the population voted for the second chamber of the Swedish parliament. It is in this election that women gained the right to vote thereby doubling the electorate. Since then, the electorate has expanded through gradually lowering the voting age. In 1976, foreign citizens obtained the right to vote in municipal and county elections after three years of registered residency. The stated goal of this change was to increase the political
influence, interest and self-esteem of foreign citizens (SOU, 1975:15). In 1998, the three year waiting period for foreign citizens from EU countries, Iceland and Norway was removed. However, voting in national elections still requires Swedish citizenship.
Earlier Elections
According to Öhrvall (2006), a distinct increasing trend in electoral participation is visible up to the middle of the 1970s. In 1976, 91.8 percent of the electorate voted in the national election (see figure 1).5
V o te r p a rtic ip a tio n b y S e x , S w e d e n , 1 9 2 1 -2 0 0 6 0 2 0 4 0 6 0 8 0 1 0 0 1921 1928 1936 1944 1952 1958 1964 1970 1976 1982 1988 1994 2002 Ye a r p e rcen t F e m a le s M a le s F ig u re 1 5
. In figure 1, voting participation is given based on the 2006 electoral survey. Individuals over the age of 75 are included from 1988 on. This means that prior to 1988, the participation rates shown in figure 1 are somewhat higher than the actual electoral participation for the years up to 1985.
V o te r p a rtic ip a tio n b y S e x fo r n o n -c itiz e n s , S w e d e n , 1 9 7 6 -2 0 0 6 0 1 0 2 0 3 0 4 0 5 0 6 0 7 0 1 9 7 6 1 9 7 9 1 9 8 2 1 9 8 5 1 9 8 8 1 9 9 1 1 9 9 4 1 9 9 8 2 0 0 2 2 0 0 6 y e a r pe rc e n t M a le s F e m a le s F ig u re 2
This represents the highest level of electoral participation measured in Sweden. 60 percent of foreign citizens exercised their franchise and voted in municipal and county elections in 1976 (see figure 2). Electoral participation gradually decreased until the election of 2006 which saw a slight upsurge in participation (SCB, 2006).
Statistics Sweden does not consistently collect information on foreign-born electoral participation. However, they have published electoral participation rates of foreign-born citizens since 1988. Their data suggest that participation rose between 1988 and 1991 and then fell substantially in the 1998 elections. However, Öhrvall (2006) notes that while foreign-born citizens are on average about 8 percent less likely to vote, the decline in voter participation by foreign-born citizens is lower than for native-born citizens.
Tracking voting probabilities of foreign citizens is more difficult, in part because a substantial number of foreign citizens leave the country without telling anyone (Öhrvall, 2006). Thus, at least part of the issue may be one of measurement -- it is difficult to determine the denominator. Nonetheless, some work has been done which suggests that while initially assessed as high in 1976 (see Hammar, 1979), participation rates have decreased substantially since then. In 2002, it was down to 35 percent.
Earlier research
The social inclusion literature states that a fundamental goal of society is to enable its members to participate fully as valued, respected and contributing members (see Toye and Infante, 2004; Laidlaw Foundation, 2002; European Union 2001). Indeed, the European Union defines social inclusion as
“a process which ensures that those at risk of poverty and social exclusion gain the opportunities and resources necessary to participate fully in economic, social and cultural life and to enjoy a standard of living and well-being that is considered normal in the society in which they live. It ensures that they have a greater participation in decision-making which affects their lives and access to their fundamental rights” (European Commission, 2005:10).
The concept of social inclusion is linked to that of social exclusion. Both are concerned with access to societal resources (be they tangible, such as financial resources or
intangible, such as decision-making power). However, “where exclusion is viewed as the problem, inclusion is seen as the solution” (Cushing, 2003: 5). Much of the debate has focused on exclusion and the continuum running from economic deprivation to societal participation (Rodgers, 1995; Byrne, 1999). Inclusion has garnered somewhat less attention (Winstanley and Stoney, 2000), in part because benchmarking through accepted measures of both inclusion and exclusion are hard to come by (see Gordon et al., 2000).
Studies that have delved into political participation tend to focus on political
representation within the context of minority involvement (for recent work see Dawson and Bobo, 2006; Kaufman, 2007; White and McAllister, 2007; see also Reeves, 1997; Tate, 2004). These studies have examined political representation of Latino and Black candidates in the United States and have generally argued that representation is low.
Palermo and Woelk (2003) in examining the rights of national minorities in Europe and rules by which participation can be implemented argue that the solution is to "facilitate the inclusion of minorities within the State and enable minorities to maintain their own identity and characteristics, thereby promoting the good governance and integrity of the State.”
Representation is a fairly high-level indicator of inclusion, however, within the context of broad political engagement, Burchardt et al. (2002) argues that simple participation in elections through voting can constitute an important measure of inclusion because it taps the degree to which individuals feel that they should take part in the decision-making process at a very broad level.
Many studies have tried to identify factors that affect the likelihood and nature of voting behaviour for the population as a whole. However, studies that include an analysis of the voting behaviour of immigrants and their descendants are far less frequent in part because of lack of data and in part because immigrants are generally not given voting privileges until after attaining citizenship. This means that there are relatively few studies which look at voting and immigrant status and even fewer that include foreign citizens. Tuckel and Meisel (1994) who look at voting by European minorities living in the United States argue that demographic and socio-economic factors, such as age, education and labour force characteristics are the dominant factors in explaining voting
probabilities (see also DeSipio, 1996; Bass and Casper, 2001 and Verba et al, 1995). Ramakrishnan and Espenshade (2001) use multiple years of the Current Population Survey (CPS) to measure the probability of voting based on minority status. They find that minorities are substantially less likely to vote in elections as compared to native born majority residents. Further, these differences are not always reduced from one generation to another. Bass and Casper (2001) using 1996 CPS data similar results, concluding that generally, age and education are positively correlated with voting as is the length of residence of immigrants. Finally, Lien (2004) finds that Asians born in the United States are less likely to vote than natives-born citizens.
Ramakrishnan and Espenshade (2001) extend the model of immigrant voting behaviour by adding controls for generation, language proficiency (in English), duration of stay, ethnic residential concentration and political socialization in the home country. Across generations, they find different patterns in voting participation among different
the United States increases the probability of voting. Being an immigrant from a repressive regime has a weak negative effect on voting participation. Language proficiency, as measured by the presence of Spanish-language ballots and proximity to co-ethnics (measured at a state level) did not have a strong effect on the probability of voting. They did find, however, that the political culture in a state influences voting behaviour.
Cho (1999) uses a 1984 survey of California residents to measure the effect of socio-economic variables on voting behaviour of four minority groups (Latino, Black, Asian and non-Hispanic white). She argues that socio-economic variables merely provide the skills for political activity. Socialization determines the degree to which these skills are used. Given that immigrant groups in particular have different socialization experiences, their pattern of voting will differ despite having similar socio-demographic
characteristics. Thus, while education had little impact for Asian-Americans, it had twice the impact for Latinos.6
Chui et al. (1991) use the 1984 Canadian Election Survey (CES) to measure seven attributes of electoral participation (including voting) using Multiple Classification Analysis. They find that while immigrants did participate less, their offspring either had the same or higher participation rates than was the case for ‘deeply rooted Canadians’. A more recent study by Jedwab (2006) uses the 2002 Ethnic Diversity Survey to conduct a tabular analysis of voting by minorities in Canada. He finds that increased ethnic belonging and ethnic identity had no negative impact on voting participation and that sense of belonging to Canada correlated with higher voter participation. White et al. (2006), using the Canadian Election Survey data, find that immigrants in general have similar voting participation rates to the native-born after controlling for education and income. As with Jedwab, they found that years of residence is important in explaining voting behaviour by immigrants. Using the 2002 wave of the Equality Security
6
A study by Daniel Gordon (1970) looked at voting patterns using aggregate level data from 1934 to 1960 in an attempt to determine the impact of the presence of minorities on the electoral process. Using the size of the immigrant group in each of 198 cities and comparing it to voter turnout, he concluded that the presence of immigrants has a strong impact in cities that have municipal parties, but not in cities that are non-partisan.
Community Survey, Bevelander and Pendakur (forthcoming) explored the relationship between personal characteristics, work characteristics, social capital attributes, ethnic characteristics and voting. They find that the combination of socio-demographic and social capital attributes largely overrides the impact of immigration and ethnicity and suggests that it is not the minority attribute that impacts voting. Rather it is age, level of schooling and level of civic engagement which affects voting, both national and county.
Messina (2006), while comparing voting results for the latest elections by citizens and non-citizens in a number of European countries, argues that obtaining citizenship and increased years of residency in the country are positively related to higher rates of
electoral participation. At the same time, different minorities and immigrant groups show very different voting rates. This could, to some extent, be explained by alienation and apathy due to lower integration by minorities and immigrants. Also, with the increase of refugee migration, a larger share of these individuals is more concerned with the politics of their country of origin.
Adman and Strömblad (2000) study the electoral participation of immigrants in the 1998 Swedish municipal elections. Using a sample of 3000 individuals, they find that
immigrants are less likely to vote. However, controlling for background factors causes these differences to disappear. They conclude that this is an indication of the effects of naturalization. In a similar study, Oskarsson (2003) found the same results.
Öhrvall (2006), using a much larger sample for the municipal election of 2002 (and indeed similar in size to the one used in this study), finds a clear difference in participation between foreign-born citizens and non-citizens. After controlling for various background factors, he finds only a small difference in electoral participation between foreign-born and Swedish-born children of immigrants. Explaining these results, Öhrvall (2006) argues that the exclusion of immigrants from national elections, which receives most attention in the media, reduces peoples’ inclination to vote in municipal and county elections. He also argues that for immigrants who are not socialized in the Swedish political system, local elections are the least interesting to
participate in (Öhrvall, 2006; Bäck and Soininen, 1994). The other explanation is based on the idea that immigrants that have obtained Swedish citizenship should be more committed to the country than non-citizens. Common to all these Swedish studies is that women are more likely to vote than men, employed more than unemployed, increasing participation with increased age, income and higher educational level.
Internationally, Sweden has a high electoral participation although large differences are measured between different societal groups. Participation is lower for young people, singles, low educated and the unemployed. Järnbert and Örhvall (2003) suggest that it is these groups which have contributed to the gradual decline in electoral participation since the 1970s in Sweden. Moreover, they observe a clear lower participation of immigrants relative to natives.
Much of the social inclusion literature focuses upon tangible and required activities such as working, or access to a dwelling. However in our view these are non-negotiable. People need a place to live and by and large families require an income, generally based on employment. There is little choice, and therefore these measures may not reflect actual inclusion. Voluntary involvement on the other hand, such as membership in organizations, charitable activity and voting may therefore be better markers of inclusion than income and employment. Indeed voting, is completely voluntary, does not involve a negative sanction for non participation may be a very good measure of the degree to which people feel they are connected with nation-state. Thus measuring the independent effect of foreign-born background on voting, after controlling for socio-economic factors could offer a useful measure of the degree to which immigrants and their descendents are included in Swedish society.
Based on earlier studies we expect age, marital status and socio-economic integration (based on education and income) to have a positive effect on electoral participation. Having children tends to lower mobility (both national and international) and is thus expected to be indicative of higher levels of integration and in turn higher voting
a Swedish-born partner is associated with a higher degree of inclusion and thus should result in higher voting participation. Homeownership will likely be associated with higher voting participation. Being educated in Sweden is expected to increase voting participation. Contextual factors such as higher ethnic representation on municipal councils should result in higher levels of voting; however increased city size and
immigrant population should be associated with lower voting rates. Finally, naturalization is expected to result in higher rates of voting.
Data and method
The data we use is drawn from two unique data bases. The 2006 Electoral Participation Survey by Statistics Sweden contains information on individual electoral participation for all those eligible to vote in national, county and municipal elections. The current
electoral surveys for Sweden, since 1964, are based on the sample information of the labour force survey in Sweden. To this sample, Statistics Sweden matches the actual participation information which is held by the county authorities in Sweden. This information is then again matched to registry data from Statistics Sweden, which also contains information for every Swedish resident. Combining these two sources of information, allows us to run weighted logistic regressions to explore the relationship between socio-economic and immigrant characteristics and the odds of voting in the 2006 municipal election. In total we have information for 70,932 residents in Sweden, a third of who are immigrants (23,678). More than half of the immigrants (12,790) are not citizens but have the right to vote in municipal and county elections.
We include twelve variable types in our models. Contextual variables include the log of the city population, the log of the immigrant population, the unemployment rate for the
city and foreign born municipal council representativity.7 Demographic variables include
age (6 dummy variables), sex (a dummy for males), marital status (4 dummy variables), a
7
Information on the log of city size and the log of immigrant population for each respondent are drawn from the Registered Total Population (RTB) database 2006. The municipal employment rate is drawn from 2007 Statistics Sweden data and the proportion of foreign born council members is drawn from Democracy Statistics 2007 (Persson and Öhrvall 2007).
dummy variable indicating whether there are children in the household and a dummy variable indicating whether the spouse is born in Sweden and has Swedish parents.
Socio-economic variables include income quintile (6 dummy variables including no income), housing tenure (three dummy variables), schooling (five dummy variables), and schooling interacted with whether the last level of schooling was obtained outside
Sweden. Central to our analysis is the categorization of people with foreign
backgrounds. We include 12 country of birth dummy variables, including 2 dummy variables that define the number of immigrant parents a Swedish-born respondent with a foreign background has. We also control for years since immigrating and citizenship and we interact years since immigrating with citizenship.
Results Descriptives
Table 1 shows descriptive statistics for all the characteristics tested in the 4 logistic models. Nearly 80 percent of the population voted in the 2006 municipal election. However, the results from table 1 suggest that there are substantial differences by age, place of birth, income and level of schooling. Voting by non-citizens is much lower than voting by citizens. Only about 35 percent of non-citizens voted in the 2006 municipal election. As suggested by the literature, younger citizens are less likely to vote. Only 71 percent of those less than 25 years old voted in the municipal election. Non-Swedes, with the exception of those born in North-America and Oceania, or those with only one immigrant parent are also less likely to vote. Income makes a substantial difference. Only about two-thirds of people with no income voted, whereas over 90 percent of people in the top quintile voted.
Schooling also has a substantial impact on the degree to which people vote. As schooling increases, so does the proportion of people who vote. However, it appears that
immigrants are generally less likely to vote than Swedish-born citizens with the same level of schooling.
Columns 2 and 4 of table 1 show results for non-citizens. Overall, non-citizens are substantially less likely to vote than citizens. However, there are some interesting patterns. First, the results suggest a somewhat different pattern in terms of age and
income, but are generally consistent by schooling.8 Younger non-citizens are actually
more likely to vote than older non-citizens and income appears to be inversely correlated with voting for non-citizens. As income increases, the proportion of non-citizen voters decreases. Thus, at least at the level of the descriptive information for citizens, there is broad agreement with previous research. The question we ask is: to what degree do contextual and individual characteristics override those of immigrant status? And how important is citizenship in determining voting propensities and enhancing social inclusion.
Logistic Regressions
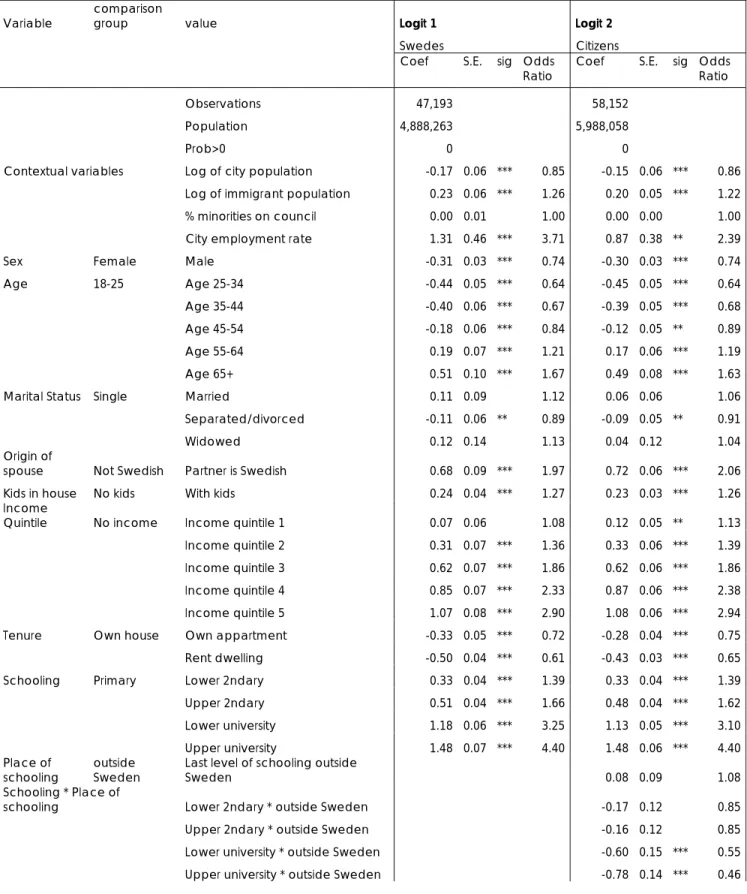
Table 2 shows results from four weighted logistic regressions (labeled Logit 1 to Logit 4) assessing the impact of these characteristics on voting in municipal Swedish elections. The first includes only Swedes (people with Swedish citizenship with two parents born in Sweden). The second includes all citizens, regardless of place of birth. The third selects only the foreign born and the last pools the entire voting population. The models which include non-citizens interact place of birth with citizenship. Thus, interpreting the coefficients for non-citizens requires adding the non-citizen coefficient to the place of birth for non-citizens. For all dummy variable sets, the comparison group is identified in parentheses.9 The four columns in each regression identify the coefficient, the standard error, the level of significance and the odds ratio.
Looking first at the model which includes only Swedes (Logit 1), we see that three of the four contextual variables have significant effects. The larger the city, the less likely residents are to vote. Indeed, every log unit increase in the city population reduces the odds of voting by about a sixth. Concomitantly, every log unit increase in the immigrant
8
. It should be noted that there are very few immigrants who arrived after age 24 who have a university degree.
9
. For example, the comparison category for sex is females and the comparison category for marital status is people who are married.
population increases the odds of voting by a quarter. High employment rates are also associated with higher rates of voting. Living in a city with full employment changes the odds of voting by almost four fold as compared to a city with no employment. Having minority representation on municipal councils has no impact on voting.
As is to be expected, age is important. Being 55 to 64 increases the odds of voting by about a fifth and being over 64 increases the odds by about two-thirds. Marital status does not have a strong impact on voting, but having a Swedish spouse doubles odds of voting. Having children also increases the odds of voting by a quarter. Being male reduces the odds of voting by about a quarter.
Income is important. The higher the income, the higher the odds of voting. Indeed, being in the fifth quintile changes the odds of voting by a factor of 2.9 as compared to people who report no income. As compared to owning a house, either owning an apartment or renting is associated with lower odds of voting.
The higher the level of schooling, the higher the odds of voting. Obtaining an upper university certificate changes the odds of voting a factor of 4.4 as compared to those who only have primary schooling.
Logit 2 includes all citizens regardless of origin. This regression adds 10,959 foreign born citizens to the population. It also adds a variable that imputes the place of
schooling, a variable for place of birth and years since immigrating. For all foreign-born citizens, we include an interaction term for place of schooling and level of schooling. 10
Looking only at the variables that are the same between the first two regressions, we see that results for Logit 2 are very similar to those seen in Logit 1. All the variables have coefficients that go in the same direction and are of roughly the same magnitude. Place
10
. The database we used does not contain a variable indicating place of schooling. We used age, age at immigration and level of schooling to impute place of schooling. For example, if an immigrant arrived in Sweden before the age of 19 and obtained upper secondary schooling, we defined that person as being schooled in Sweden.
of schooling is not significant; suggesting that overall, getting your last level of schooling from outside Sweden does not affect the odds of voting. However, interacting place of schooling with level of schooling suggests some interesting results. Foreign-born citizens with secondary schooling from outside Sweden have about the same odds of voting as those with Swedish secondary school (the coefficient for the interaction with secondary school is insignificantly different from the comparison group). However foreign-born citizens with foreign university level schooling do have significantly lower odds of voting than those with Swedish university schooling. This impact is high enough to wipe out the effect of university schooling. Thus in essence, people with foreign university level schooling, have about the same odds of voting as people with Swedish secondary school education.
After controlling for socio-economic and demographic attributes, we find that place of birth still appears to matter. People not born in Sweden are less likely to vote. Being born in South America reduces the odds of voting by about a third, while being born in Europe reduces the odds by up to half. Being born in East Asia also reduces the odds by up to two-thirds. Generation also matters. Having one immigrant parent reduces the odds of voting by a fifth and having two immigrant parents reduces the odds of voting by about two-fifths. Years since immigrating has only a minor (and weakly significant) effect. Indeed, being in Sweden for 30 years only changes the odds of voting by about a sixth.
At least part of the reason for the small effects on years since immigrating is because the majority of people in our Logit 2 population are Swedes (who have not immigrated). For this reason Logit 3 includes only the 23,678 foreign born and their descendents who are eligible to vote in municipal elections, and drops all Swedes. We include the same variables as found in Logit 2, but add a variable identifying whether the respondent is a citizen and we interact citizenship with years since immigrating to Sweden.
The most striking thing about the results from Logit 3 is the impact of citizenship. Obtaining citizenship increases the odds of voting in a municipal election by two and a
half times, as compared to a foreign-born non-citizen. For citizens, every year of residence in Sweden increases the odds of voting (being a foreign-born Swedish citizen with thirty years of residence increases the odds of voting by half as compared to a newly minted Swedish born citizen). However for non-citizens, years since immigrating has no significant impact on the odds of voting. These results are reiterated in Logit 4 which includes all eligible voters.
Conclusions:
Social inclusion as a policy goal presumes that a fundamental goal of society is to enable all members to participate fully as valued, respected and contributing members. Thus, the concept describes a means by which everyone, regardless of their experiences and circumstances, may gain access to social and economic resources required to achieve their potential (see Aguilera, 2003; Levitas, 2003, 1998; Atkinson et al., 2002; Robila, 2006; Siemiatycki, 2005; Toye and Infanti, 2004; Monnickendam and Berman, 2008).
Much of the social inclusion literature concentrates on ‘hard’ activities. Sweden’s Strategy Report For Social Protection And Social Inclusion 2006 – 2008 for example examines access to housing, segregation and work. These are useful and typical measures of inclusion, however, we would argue that voting is at least as useful a measure because there is a degree of choice. People have to work, must have housing and ideally should not have to be ethnically segregated. There is little individual level choice in these measures. As such, they may not be good measures of social inclusion. Voting is different. You don’t have to vote, but voting does allow the individual to express an opinion and affect a societal outcome. Further, if inclusion is about participation then voting is an effective measure of social inclusion because it taps a purely voluntary willingness to participate (see Burchardt et al. 2002).
Given increased globalization and immigration, the integration and inclusion of minority populations is of increased importance within receiving societies. Despite this, little work has been done on electoral participation of immigrants and minorities both in
Europe and North America. However, certain trends in the literature are apparent. Basically, immigrants are viewed as less likely to vote even after controlling for socio-economic characteristics. Even less work has been done on the voter participation rates of resident non-citizens. Often, the impact of being foreign-born is not captured because of a lack of data. However, given the unique dataset we have, we are able to examine the impact of immigrant status in some detail. We find that place of birth and citizenship make a big difference in the odds of voting, but it is nuanced. Age at arrival is important in that people who arrive later in life have lower odds of voting. However, this is only true for immigrants with primary and secondary schooling. Having a university certificate appears to override the importance of age at immigration and in fact, these individuals appear to have high odds of voting.
We found that place of birth is very important. Europeans and Africans are not likely to vote. They simply do not exercise their franchise as much as people from other regions. The reasons for this are worth speculating upon. In the case of Europeans, (both EU and non-EU members), it may be that they simply do not see themselves as sufficiently tied to Sweden to take part in the process. This is despite having the right to vote even if they don’t have citizenship and even if voting could have real impacts on their lives.
Generation does have an impact on voter participation. People born in Sweden, but with at least one immigrant parent are less likely to vote than people with two Swedish parents. However the effects are muted. Those born in Sweden with immigrant parents are more likely to vote than immigrants. Further, having only one immigrant parent means a higher likelihood of voting than having 2 immigrant parents. Whether this represents a continuation of segregation or a step toward integration is up for debate.
We find that contextual factors are important. Living in a large city reduces people’s propensity to vote. However, we find that higher immigrant populations are not correlated with lower rates of voter participation. This runs counter to Putnam (2007) who suggests that heterogeneous populations have lower levels of participation.
On that note, it appears that granting citizenship has a huge effect on voting. Despite giving people the right to vote, that right is often not exercised if people are not citizens. While it could be that only people who wish to be more involved take up citizenship, it could also be that citizenship offers people the opportunity to see that they have a stake in what is happening politically in Sweden. Thus as a means of encouraging social
inclusion, it appears that the policy of allowing citizenship acquisition has been extremely successful.
References
Adman, P. and Strömblad, P. 2000. “Resurser för politisk integration”, in Utanför Demokratin? Del 3. Norrköping: Integrationsverkets rapportserie 200:16.
Aguilera, Michael B. 2003. “The Impact of the Worker: How Social Capital and Human Capital Influence the Job Tenure of Formerly Undocumented Mexican
Immigrants.” Sociological Inquiry 73: 52–83.
Atkinson, Tony and Bea Cantillon, Eric Marlier, Brian Nolan, eds. Social Indicators: The EU and Social Inclusion. Oxford: Oxford University Press, 2002.
Bäck, H. and Soininen, M. 1994. ”Invandrarnas valdeltagande”, in Bäck, H and
Håkansson, A. (editors), Väljare i kommunvalet. Om missnöje, misstroende och politisk kultur. Stockholm: SNS förlag.
Bass, L. E. and Casper, L.M. 2001. “Impacting the Political Landscape: Who Registers and Votes among Naturalized Americans?”, in Political Behavior, Vol. 23, No. 2, pp. 103-130.
Bevelander, P. 2004. “Immigration patterns, economic integration and residential
segregation; Sweden in the late 20th century”, in Current Themes in IMER
Research, No 2., Malmö University.
Bevelander, P. 2006. “The Integration Challenges of Sweden” in Usha George (ed.), Canadian Diversity, Vol. 5, No.1, Association of Canadian Studies. pp. 86-91. Bevelander, P. and Pendakur, R. forthcoming. “Social Capital and Voting Participation of
Immigrants and Minorities in Canada”, Ethnic and Racial Studies.
Burchardt, T. et al. 2002. “Introduction”, in John Hills, Julian LeGrand and David Piachaud (eds.), Understanding Social Exclusion. Oxford: Oxford University Press.
Byrne, D. 1999. Social Exclusion. Buckingham: Open University.
Cushing, P. 2003. Policy Approaches to Framing Social Inclusion and Social Exclusion: An Overview. Toronto: Roeher Institute.
Cho, T. 1999. “Naturalization, Socialization, Participation: Immigrants and (Non-) Voting”, in The Journal of Politics, Vol. 61, No. 4, pp. 1140-1155.
Chui, T., Curtis, J. and Lambert, R. 1991. “Immigrant background and political
participation: examining generational patterns”, Canadian Journal of Sociology, Vol. 16, No. 4, pp. 375-396.
Dawson, M. and Lawrence B. 2006. “The More Things Change: Continuity and Change in American Racial Landscape”, in Du Bois Review: Social Science and Research on Race, Vol.3, No. 2, p. 257.
DeSipio, L. 1996. “Making citizens or good citizens? Naturalization as predictor of organizational and political behavior among Latino immigrants”, in Hispanic Journal of Behavior Sciences, Vol. 18, pp. 195-213.
European Commission. 2005. Report on Social Inclusion 2005: An Analysis of the National Action Plans on Social Inclusion (2004-2006) submitted by the 10 New Member States.
European Union Social Protection Committee. 2001. Report on Indicators in the field of poverty and social exclusion.
Gordon, D. 1970. “Immigrants and municipal voting turnout: implications for the changing ethnic impact on urban politics”, in American Sociological Review, Vol. 35, No. 4, pp. 665-681.
Gordon, D., Levitas, R. Pantazis, C. et al. 2000. Poverty and Social Exclusion in Britain. York: Joseph Rowntree Foundation.
Hammar, T. 1979. Det första invandrarvalet. Stockholm: Liber förlag.
Järnbert, M. and Öhrvall, R. 2003. “Det svenska valdeltagandet”, in Vogel, J. (ed.), Väfärd och ofärd på 90-talet. Stockholm: Statistiska centralbyrån.
Jedwab, J. 2006. “The ‘Roots’ of Immigrant and Ethnic Voter Participation in Canada”, in Electoral Insight, Electoral Participation of Ethnocultural Communities, Vol. 8, No. 2.
Kaufmann, K. M. 2007. “Immigration and the Future of Black Power in U.S. Cities”, Du Bois Review: Social Science and Research on Race, Vol. 4, No.1, pp. 79-96. Laidlaw Foundation. 2002. The Laidlaw Foundation’s Perspective on Social Inclusion.
Toronto: The Laidlaw Foundation, 2002. http://www.laidlawfdn.org/ files/children/summaries_dec2002.pdf.
Levitas, Ruth. 2003. ‘The Idea of Social Inclusion’. Paper prepared for the 2003 Social Inclusion Research Conference,. Available on:
http://www.ccsd.ca/events/Inclusion/papers/rlevitas.htm.
Lien, P. 2004. “Asian Americans and Voting Participation: Comparing Racial and Ethnic Differences in Recent U.S. Elections”, in International Migration Review,
Lundh, C. and Ohlsson, R. 1999. Från arbetskraftsimport till flyktinginvandrig. Stockholm; SNS Förlag.
Messina, A. M. 2006. “The Political Incorporation of Immigrants in Europe: Trends and Implications”, in Messina. A. M. and Lahav, G. (eds.), The Migration Reader, Exploring Politics and Policies. Boulder/London: Lynne Rienner Publishers. Ministry of Health and Social Affairs. 2007. Sweden’s Strategy Report For Social
Protection And Social Inclusion 2006 – 2008. Stockholm: Sweden.
Monnickendam, Menachem andYitzhak Berman. (2008). ‘An Empirical Analysis of the Interrelationship between Components of the Social Quality Theoretical
Construct.’ Social Indicators Research, 86:3, 525-538.
Öhrvall, R. 2006. “Invandrade och valdeltagande”, in Bäck, H. and Gilljam, M (eds.), Valets Mekanismer. Malmö: Liber förlag.
Oskarsson, S. 2003. Vem röstar och varför? En analys av valdeltagandet i 2002 års kommunfullmäktigeval. Stockholm: Justitiedepartementet, Ds 2003:54. Persson, J and R. Öhrvall 2007. Democracy Statistics Report no 7, Elected
representatives in municipalities and county councils 2007: A report on the number of politicians and representativity. Stockholm: Statistics Sweden. Putnam, Robert D. (2007). E Pluribus Unum: Diversity and Community in the
Twenty-first Century: The 2006 Johan Skytte Prize Lecture. Scandinavian Political Studies, 30(2), 137-174.
Ramakrishnan, S. K. and Espenshade, T. 2001. “Immigrant Incorporation and Political Participation in the United States”, in International Migration Review, Vol. 35, No. 3, pp. 870-909.
Robila, M. 2006. ‘Economic pressure and social exclusion in Europe.’ The Social Science Journal, 43:1, 85-97.
Rodgers, G. 1995. “What is special about a ‘social exclusion’ approach?”, in
International Labour Organization (ILO), Social Exclusion: Rhetoric, Reality, Responses. Geneva: ILO (International Institute for Labour Studies).
SCB (Statistics Sweden), Allmänna valen 2006 Del 4. Stockholm: Statistics Sweden. Siemiatycki, Myer. 2005. “From Social Exclusion to Social Inclusion: Conceptual and
Policy Approaches” for Social Development Canada’s Expert Roundtable on Social and Economic Inclusion, November 9-10th, Ottawa, 2005. Ottawa: SDC unpublished working paper.
Statens offentliga utredningar (SOU) 1975:15.
Toye, M. and Infanti, J. 2004. Social Inclusion and Community Economic Development Literature Review. Ottawa: The Canadian CED Network.
Tuckel, P. and Maisel, R. 1994. “Voter Turnout among Europeans Immigrants to the United States”, in Journal of Interdisciplinary History, Vol. 24, No. 3, pp. 407-430.
Verba, S. Lehman-Shlozman, K. and Brady, H. 1995. Voice and Equality. Civic Voluntarism in American Politics. Cambridge: Harvard University Press.
White, S. et al. 2006. “Making Up for Lost Time, Immigrant Voter Turnout in Canada”, in Electoral Insight, Electoral Participation of Ethnocultural Communities, Vol. 8, No. 2.
White, S. and McAllister, I. 2007. “Turnout and Representation Bias in Post- Communist Europe”, in Political Studies, Vol. 55, No. 3, pp. 586-606.
Winstanley, D. and Stoney, C. 2000. “Inclusion in the Workplace: The Stakeholder Debate”, in Peter Askonas and Angus Stewart (eds.), Social Inclusion: Possibilities and Tensions. New York: St. Martin’s Press.
Table 1
Descriptive statistics: % of group that voted, Sweden, 2006
variable value
Municipal Municipal incl.
non-citizens
Demographic sex female 82% 62%
Characteristics male 81% 66% Total 82% 64% age in groups < 25 71% 74% 25-34 79% 71% 35-44 83% 62% 45-54 85% 57% 55-64 88% 57% 65+ 80% 64% Total 82% 64%
Marital status widowed 71% 68%
divorced 77% 67% married 89% 57% never married 76% 73% Total 82% 64% group Total 82% 64% Swedish 84% 47%
Nordic not Swedish 72% 55%
EU not Nordic 70% 62%
Oth. Europe 59% 62%
African 58% 71%
N. Amer. & Oceania 81% 67%
S. Amer. 72% 62%
Asia. 63% 58%
2 immig. Parents 73% 69%
1 immig. Parent 80% 64%
city type Suburbs 84% 67%
Countryside 79% 61%
Cities 12.5 - 25K 81% 64% Cities 25,000+ 81% 60% Big cities 82% 64% Commuter towns 81% 66% Larger cities 82% 68% Industry towns 81% 65% Total 82% 64%
Socio-economic income quintile no income 63% 78%
first 71% 64% second 78% 61% third 84% 59% fourth 87% 50% fifth 92% 43% Total 82% 64%
Schooling/ primary native-born 79% 71%
Immigrant
status immigrated age 0-9 59% 76%
immigrated age 10-19 63% 75% immigrated age 20-24 64% 73% immigrated age 25+ 60% 67% secondary native-born 87% 44% immigrated age 0-9 76% 56% immigrated age 10-19 69% 68% immigrated age 20-24 75% 57% immigrated age 25+ 77% 53% university native-born 92% 27% immigrated age 0-9 77% 75% immigrated age 10-19 79% 78% immigrated age 20-24 66% 70% immigrated 70% 58%
Table 2 Results from logistic regressions estimating the odds of voting,
Sweden, 2006
Variable comparison group value Logit 1 Logit 2
Swedes Citizens
Coef S.E. sig Odds
Ratio Coef S.E. sig Ratio Odds
Observations 47,193 58,152
Population 4,888,263 5,988,058
Prob>0 0 0
Contextual variables Log of city population -0.17 0.06 *** 0.85 -0.15 0.06 *** 0.86 Log of immigrant population 0.23 0.06 *** 1.26 0.20 0.05 *** 1.22
% minorities on council 0.00 0.01 1.00 0.00 0.00 1.00
City employment rate 1.31 0.46 *** 3.71 0.87 0.38 ** 2.39
Sex Female Male -0.31 0.03 *** 0.74 -0.30 0.03 *** 0.74
Age 18-25 Age 25-34 -0.44 0.05 *** 0.64 -0.45 0.05 *** 0.64
Age 35-44 -0.40 0.06 *** 0.67 -0.39 0.05 *** 0.68
Age 45-54 -0.18 0.06 *** 0.84 -0.12 0.05 ** 0.89
Age 55-64 0.19 0.07 *** 1.21 0.17 0.06 *** 1.19
Age 65+ 0.51 0.10 *** 1.67 0.49 0.08 *** 1.63
Marital Status Single Married 0.11 0.09 1.12 0.06 0.06 1.06
Separated/divorced -0.11 0.06 ** 0.89 -0.09 0.05 ** 0.91
Widowed 0.12 0.14 1.13 0.04 0.12 1.04
Origin of
spouse Not Swedish Partner is Swedish 0.68 0.09 *** 1.97 0.72 0.06 *** 2.06 Kids in house No kids With kids 0.24 0.04 *** 1.27 0.23 0.03 *** 1.26 Income
Quintile No income Income quintile 1 0.07 0.06 1.08 0.12 0.05 ** 1.13
Income quintile 2 0.31 0.07 *** 1.36 0.33 0.06 *** 1.39
Income quintile 3 0.62 0.07 *** 1.86 0.62 0.06 *** 1.86
Income quintile 4 0.85 0.07 *** 2.33 0.87 0.06 *** 2.38
Income quintile 5 1.07 0.08 *** 2.90 1.08 0.06 *** 2.94
Tenure Own house Own appartment -0.33 0.05 *** 0.72 -0.28 0.04 *** 0.75
Rent dwelling -0.50 0.04 *** 0.61 -0.43 0.03 *** 0.65
Schooling Primary Lower 2ndary 0.33 0.04 *** 1.39 0.33 0.04 *** 1.39
Upper 2ndary 0.51 0.04 *** 1.66 0.48 0.04 *** 1.62
Lower university 1.18 0.06 *** 3.25 1.13 0.05 *** 3.10
Upper university 1.48 0.07 *** 4.40 1.48 0.06 *** 4.40
Place of
schooling outside Sweden Last level of schooling outside Sweden 0.08 0.09 1.08 Schooling * Place of
schooling Lower 2ndary * outside Sweden -0.17 0.12 0.85
Upper 2ndary * outside Sweden -0.16 0.12 0.85
Lower university * outside Sweden -0.60 0.15 *** 0.55
Place of birth Sweden Born in Sweden w 1 imm. Parent -0.22 0.05 *** 0.80
Born in Sweden w 2 imm. parents -0.53 0.07 *** 0.59
Nordic -0.81 0.13 *** 0.44 EU no nordic -1.12 0.13 *** 0.33 Rest of Europe -1.12 0.09 *** 0.33 Africa -0.92 0.14 *** 0.40 N. America -0.45 0.24 * 0.64 S. America -0.40 0.15 *** 0.67 Middle East -0.69 0.09 *** 0.50 E. Asia -1.16 0.14 *** 0.31 Rest of Asia -0.61 0.17 *** 0.54
Time in Sweden Years since immigrating 0.00 0.00 * 1.00
Citizenship (Not a citizen) Citizen
Citizen * Years since immigrating
Significance: * = 0.1, ** = 0.05, *** = 0.01
Table 2 (continued)
Results from logistic regressions estimating the odds of voting, Sweden, 2006
Variable comparison group value Logit 3 Logit 4
Minorities (non-Swedes) Total population
Coef S.E. sig Odds
Ratio Coef S.E. sig Ratio Odds
Observations 23,678 70,932
Population 1,354,719 6,244,501
Prob>0 0 0
Contextual variables Log of city population 0.04 0.09 1.04 -0.13 0.05 ** 0.88 Log of immigrant population -0.02 0.09 0.98 0.18 0.05 *** 1.20
% minorities on council 0.01 0.01 1.01 0.00 0.00 1.00
City employment rate -0.26 0.53 0.77 0.90 0.35 ** 2.46
Sex Female Male -0.27 0.04 *** 0.77 -0.29 0.03 *** 0.75
Age 18-25 Age 25-34 -0.42 0.08 *** 0.66 -0.43 0.04 *** 0.65
Age 35-44 -0.30 0.08 *** 0.74 -0.36 0.05 *** 0.70
Age 45-54 0.04 0.09 1.04 -0.09 0.05 * 0.91
Age 55-64 0.10 0.11 1.11 0.19 0.06 *** 1.21
Age 65+ 0.42 0.15 *** 1.53 0.52 0.08 *** 1.68
Marital Status Single Married -0.02 0.06 0.98 0.03 0.05 1.03
Separated/divorced -0.09 0.07 0.91 -0.09 0.04 ** 0.91
Widowed -0.25 0.18 0.78 0.04 0.11 1.05
Origin of
spouse Not Swedish Partner is Swedish 0.75 0.07 *** 2.12 0.75 0.05 *** 2.12 Kids in house No kids With kids 0.23 0.05 *** 1.26 0.24 0.03 *** 1.27
Income
Quintile No income Income quintile 1 0.22 0.07 *** 1.24 0.12 0.05 *** 1.13
Income quintile 2 0.31 0.08 *** 1.36 0.31 0.05 *** 1.37
Income quintile 3 0.57 0.08 *** 1.77 0.60 0.05 *** 1.83
Income quintile 4 0.83 0.08 *** 2.29 0.84 0.05 *** 2.32
Income quintile 5 0.99 0.09 *** 2.69 1.05 0.06 *** 2.84
Tenure Own house Own appartment -0.13 0.06 ** 0.88 -0.27 0.04 *** 0.76
Rent dwelling -0.23 0.05 *** 0.80 -0.42 0.03 *** 0.66
Schooling Primary Lower 2ndary 0.31 0.08 *** 1.36 0.33 0.04 *** 1.39
Upper 2ndary 0.48 0.08 *** 1.62 0.50 0.04 *** 1.64
Lower university 0.99 0.10 *** 2.70 1.12 0.05 *** 3.07
Upper university 1.47 0.11 *** 4.35 1.47 0.06 *** 4.37
Place of
schooling outside Sweden Last level of schooling outside Sweden 0.18 0.09 * 1.20 0.13 0.07 * 1.14 Schooling * Place of
schooling Lower 2ndary * outside Sweden -0.15 0.12 0.86 -0.19 0.09 ** 0.82
Upper 2ndary * outside Sweden -0.20 0.12 * 0.82 -0.17 0.09 * 0.84
Lower university * outside Sweden -0.51 0.14 *** 0.60 -0.57 0.11 *** 0.57 Upper university * outside Sweden -0.83 0.13 *** 0.44 -0.78 0.10 *** 0.46 Place of birth Sweden Born in Sweden w 1 imm. Parent 0.53 0.15 *** 1.70 -0.23 0.04 *** 0.79 Born in Sweden w 2 imm. parents 0.22 0.15 1.24 -0.55 0.06 *** 0.57
Nordic -0.22 0.14 0.81 -0.89 0.10 *** 0.41 EU no nordic -0.30 0.14 ** 0.74 -1.00 0.10 *** 0.37 Rest of Europe -0.47 0.13 *** 0.63 -1.13 0.08 *** 0.32 Africa -0.18 0.16 0.83 -0.85 0.12 *** 0.43 N. America -0.03 0.17 0.97 -0.72 0.14 *** 0.49 S. America 0.26 0.16 * 1.29 -0.40 0.12 *** 0.67 Middle East -0.01 0.13 0.99 -0.66 0.08 *** 0.51 E. Asia -0.46 0.15 *** 0.63 -1.15 0.12 *** 0.32
Rest of Asia (Comparison) -0.66 0.14 *** 0.52
Time in Sweden Years since immigrating 0.00 0.00 1.00 -0.01 0.00 *** 0.99 Citizenship (Not a citizen) Citizen 0.89 0.07 *** 2.44 0.93 0.07 *** 2.55 Citizen * Years since immigrating 0.01 0.00 *** 1.01 0.01 0.00 *** 1.01 Significance: * = 0.1, ** = 0.05, *** = 0.01